How to Write Chart Titles That Say Something
 By Tony Astor ·
How to Write Chart Titles That Say Something
An action title states the chart’s main conclusion instead of naming its topic, so readers grasp the finding before reading the data. Write it by summarizing the chart in one sentence, then trimming it to ten words or fewer with a specific subject, active verb, and key number.
Table of Contents
Action Titles
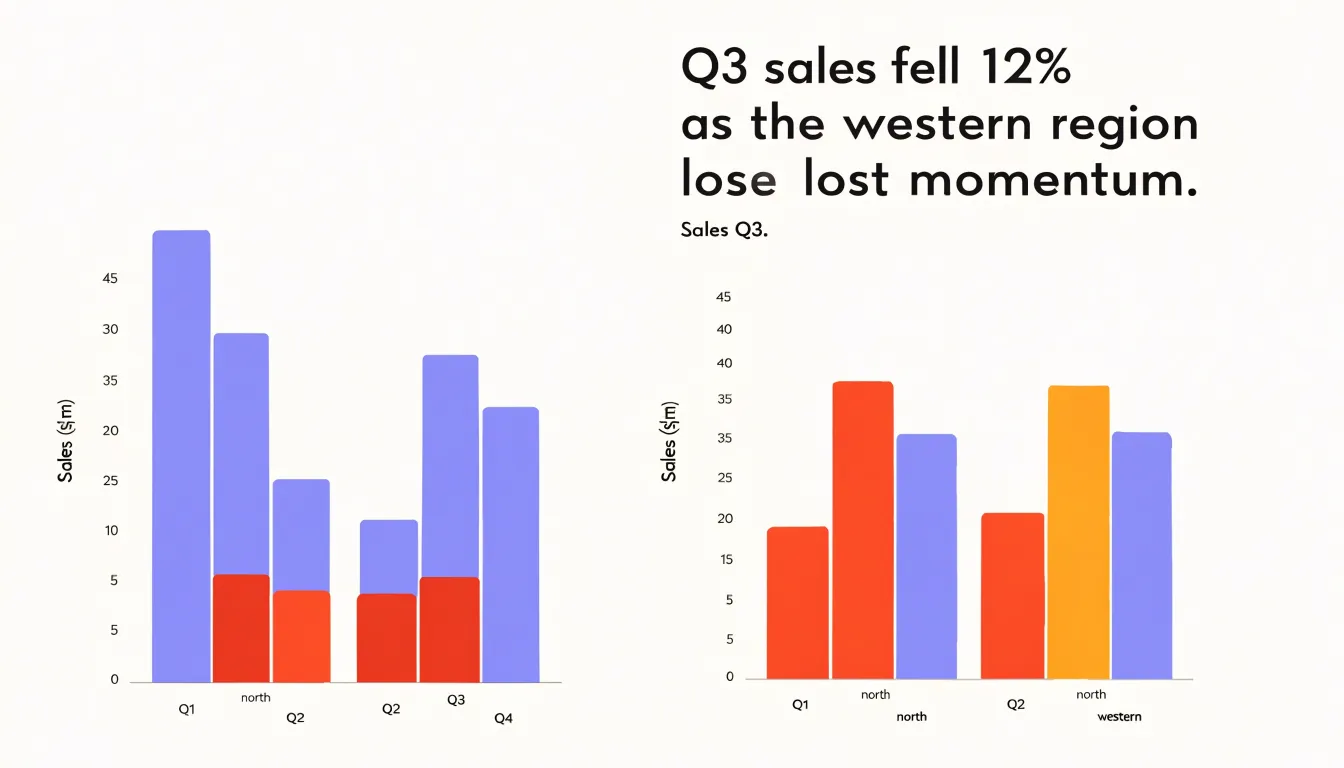
A generic chart title such as “Sales Q3” tells the reader only what data they are about to see. It works like a filing label, sorting the chart into a category without offering any interpretation. The reader still has to scan the axes, compare the bars, and work out what the numbers actually mean. That extra effort is small for one chart, but across a report or presentation it adds up quickly, and busy readers often skip past figures they cannot decode at a glance.
An action title shifts that work onto the writer. Instead of naming the topic, the title states the conclusion the chart supports, so the reader meets the main point first and then sees the evidence that backs it up. A chart labeled “Sales Q3” might become “Q3 sales fell 12% as the western region lost momentum.” The second version tells the reader what happened, where it happened, and how serious it was before they have looked at a single bar or line. The chart then does the job it is best suited to: confirming and illustrating a claim rather than posing a puzzle.
Writing action titles takes a little more effort because it forces you to decide what the chart is really saying. The practical method is to look at the chart, write down the single sentence you would say aloud if explaining it to a colleague, and then trim that sentence into a title. The sentence usually contains the direction of change, the size of the change, and the key comparison or cause. If you find that no single sentence captures the chart, that is often a sign the chart is trying to do too much and should be split.
A common worry is that action titles will sound too assertive or editorial. In practice, readers appreciate the guidance, and the title can always include the relevant qualifier, such as the time period or segment, so the claim stays precise. The goal is a title that a reader could repeat to someone else after glancing at the page for five seconds.
Insight-First Titles
Insight-first titles start with a deliberate reading of the data before any chart is built, answering the question every reader silently asks: what am I supposed to take away from this? Analysts can scan for the largest movements, the sharpest divergences, or the point where a trend breaks from its historical pattern, since these are usually where the story lives. Ranking categories by magnitude, comparing current values against a meaningful baseline, or tracking a single metric across time all help surface the most important finding.
Once the primary story is identified, the next step is translating raw statistics into language a business audience can act on. A figure such as a four-point margin decline means little on its own; framed as customers shifting toward the lower-priced tier, it points to a decision about pricing or positioning. The translation should name the subject, describe the direction and scale of the change, and, where possible, indicate why it matters.
Complex visuals often contain several possible stories, so the writer has to choose. The best choice is usually the finding with the clearest implications for the audience’s decisions, even if it is not the most visually dramatic element on the page. Drafting two or three candidate titles and testing which one captures the central message fastest is a practical way to refine the wording. Reading the title aloud also reveals vagueness and helps sharpen it into a confident, specific statement.
Active Verbs
Active verbs give a chart title a sense of motion, telling the reader what the data is doing before their eyes reach the axis labels.
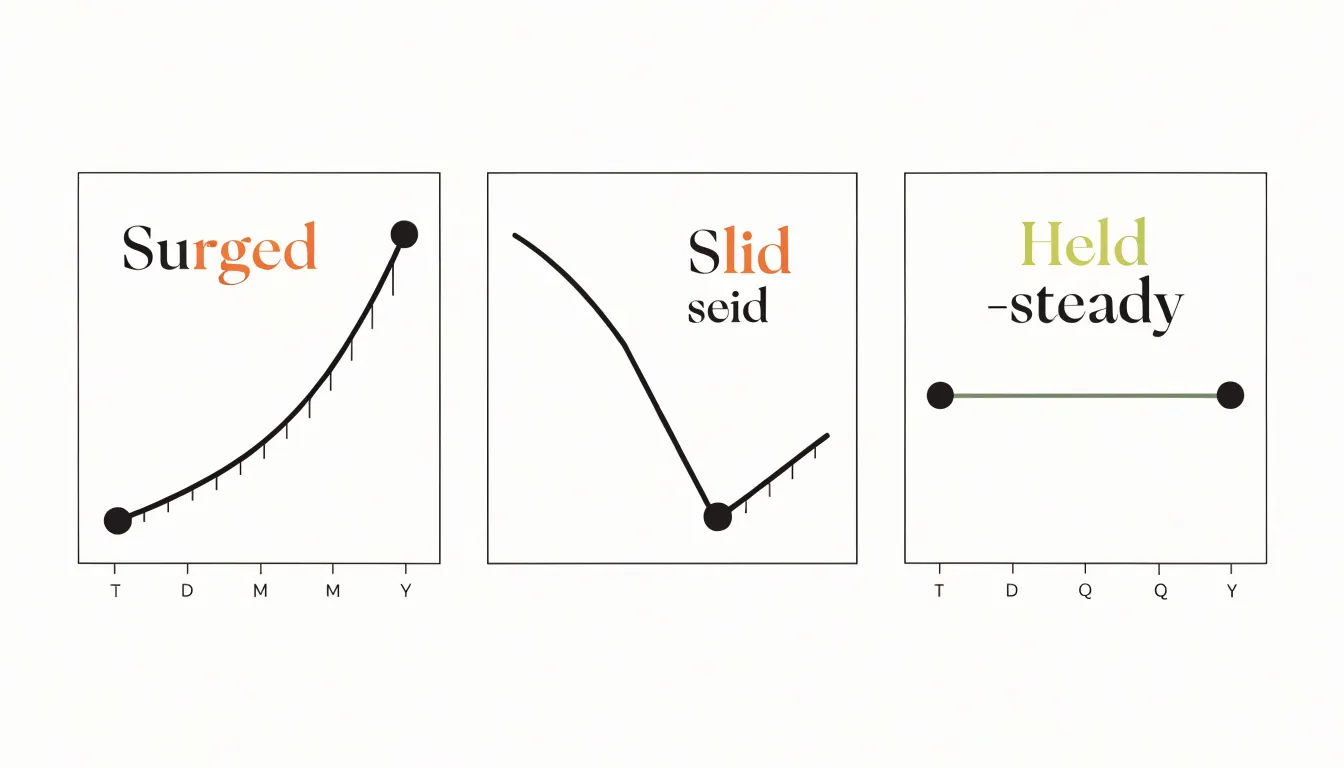
- When a metric is climbing: Verbs like surge, climb, or accelerate convey both the direction and the intensity of the movement.
- When a figure is dropping sharply: Verbs like plummet, slide, or collapse carry an emotional charge that a flat word like decreased cannot deliver.
- When a value is holding steady: Verbs such as hold, level off, or stabilize signal that the flat line is itself a finding worth noting.
A title that names a subject and attaches a vivid verb creates a small narrative promise: something happened, and the chart will show how. Readers arrive at the visual with a question already formed, which makes the data easier to absorb and remember. Weak constructions, by contrast, leave the reader to infer the direction and significance of the trend from the shape of the line—an extra cognitive step where attention often slips away.
Choosing the right verb also enforces analytical precision. If the writer cannot decide whether a metric rose, spiked, or crept upward, the underlying analysis may need another look. The verb becomes a test of how well the trend has been understood. Matching the verb to the magnitude of the change keeps the title honest, so a modest gain is described as a gain rather than a dramatic leap.
Key Numbers
When a title reads “Conversion Rate Rose 18% Last Quarter” instead of “Conversion Rate Improved,” the reader receives the central claim and its supporting evidence in a single glance. Exact figures carry an authority that adjectives cannot match, because they can be checked, compared, and remembered. A percentage or dollar amount signals that the chart rests on measurement rather than impression.
“Revenue Grew to $4.2 Million” gives the audience a fixed reference point they can hold onto while scanning the bars or lines below. Dollar amounts are especially effective in business and financial contexts, where audiences evaluate outcomes in monetary terms. A title such as “Support Costs Fell by $310,000 After Automation” communicates scale and consequence at once.
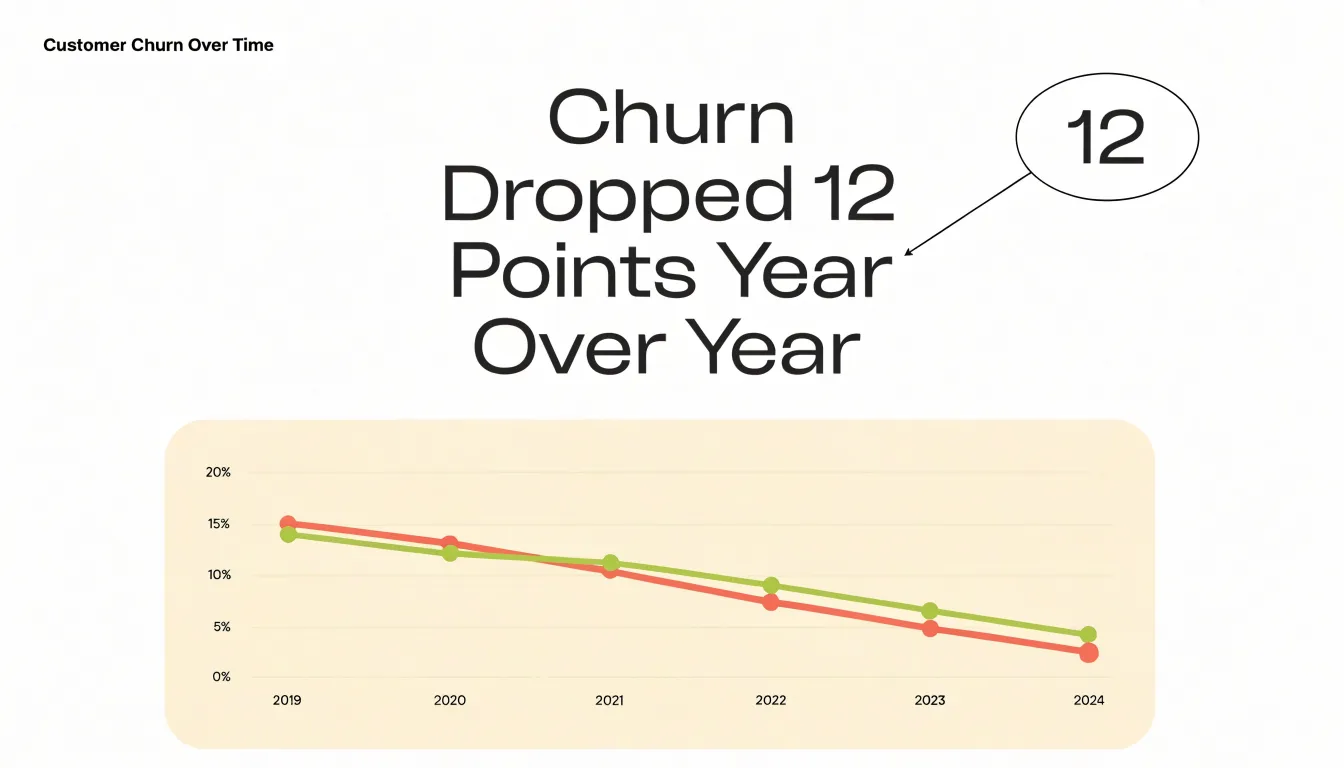
Percentages serve a complementary role by expressing change and proportion in terms readers can quickly interpret, regardless of the underlying magnitude. A title that states “Churn Dropped 12 Points Year Over Year” gives an immediate sense of direction and size. Rounded or vague quantities weaken this effect. Precision, even to a single decimal place where the data supports it, reinforces the impression that the chart reflects careful analysis.
Writers should draw key numbers directly from the data displayed and place them early in the title, where they receive the most attention. Pairing the figure with a short, plain description of what it measures turns the title from a label into a compact argument grounded in verifiable evidence.
Plain Language
Plain language begins with a simple test: could a busy colleague from another department read this title once and correctly tell someone else what the chart shows? If the title depends on insider shorthand, that test fails. Start by hunting for corporate jargon and replacing each term with the words people actually use in conversation:
- “Leverage” becomes “use”
- “Optimize” becomes “improve”
- “Synergy” usually just means “working together”
These swaps cost nothing in precision and save readers a moment of translation.
Acronyms deserve special scrutiny. Every organization carries its own alphabet soup, and what feels obvious internally can read as code to an outsider. The practical fix is to spell out an acronym the first time it appears and keep the abbreviation in parentheses if it recurs, or drop it entirely when space allows. Where the acronym is unknown even to some internal teams, write the full name outright so stakeholders across finance, sales, or leadership can grasp the finding without a glossary or follow-up email.
Watch for noun-heavy phrases that stack abstractions together, such as “customer acquisition cost efficiency initiatives.” Break these into a plain subject and verb: say who did what, or what happened, such as “Support tickets fell 30% after the April update.”
Finally, test titles on someone outside the project and ask them to explain the chart back to you. Any hesitation or misreading points to a phrase that needs simplifying.
Concise Headlines
A chart title has a limited amount of space before it stops being read at a glance and starts demanding effort. Trimming a title to ten words or fewer keeps it readable. Once you build the title around the chart’s single claim, any word that does not support that claim can usually go. Phrases like “A Comparison of,” “Data Showing,” or “The Relationship Between” announce what the chart is doing without adding needed information; cutting them often removes four or five words with no loss of meaning. Protect numbers, units, and time periods because they carry critical context, and target connective and descriptive filler instead.
Leading with the finding also saves space. “Revenue Fell 12% in Q3” tells the reader what matters in six words, while “Quarterly Revenue Performance Across Regions for Q3” spends seven words circling the point. Because verbs do more work than noun stacks, converting nominalizations into active phrasing typically shortens a title while sharpening it. “Enrollment Growth Was Driven by Online Programs” becomes “Online Programs Drove Enrollment Growth,” losing two words in the process.
As a final check, read the trimmed title without the chart and ask whether a colleague would understand the message. If context is missing, add back only the specific element that resolves the ambiguity, such as the geography or the comparison baseline.
Audience Questions
For executive decision-makers, the question brought to a chart is almost always strategic. They are not reading your chart simply to learn that revenue rose or that a segment grew; they are reading to learn whether the number changes what they should do next. Frame your headline around that decision, and the chart earns its place in the room.
Before writing a single word of the title, list the two or three decisions the reader is weighing this quarter and the fears attached to them, then ask which of those concerns your data speaks to. A headline such as “Customer churn is clustered in the mid-market” tells an executive where to look. A headline such as “Mid-market churn threatens the retention target” tells them why it matters and what is at stake, connecting the data to a strategic concern they already carry into the meeting.
Executives scan for numbers, thresholds, and named segments, so build the title around the precise figure or comparison that carries the argument. Tie the chart to a decision by using the language of trade-offs and priorities: where to invest, what to protect, which risk is growing, which opportunity is closing. When the chart supports a choice, say so in the headline.
Finally, test the title against the question your reader will ask out loud: so what should we do? If the headline gives them a grounded starting point for that answer, it has framed the conversation that follows.
Trend Highlights
A trend highlight in a chart title directs the reader’s attention to the most important pattern over time, such as multi-year growth, seasonal drops, or structural shifts:
- Multi-year growth: Quantify the change over time—for example, “Revenue has tripled since 2018”—so readers do not have to calculate the trajectory themselves.
- Seasonal drops: A title like “Sales dip every January” alerts readers to the recurring nature of the decline, helping them distinguish it from a one-time anomaly.
- Structural shifts: Highlight a change in market share or a sudden break in trend with titles like “Market share shifted in 2020” or “Customer behavior changed after the pandemic.”
Include specific time frames or magnitudes to ground the observation, and state the pattern directly so the reader knows immediately what feature of the chart deserves their attention.
Surprising Findings
Calling out an unexpected outlier in the title transforms a passive display into an active invitation to explore. A chart showing monthly sales might reveal that one region consistently underperforms, and a title like “Why the Northeast Lagged Behind in Q3” immediately signals a story worth investigating.
Because humans are naturally drawn to anomalies, emphasizing a counter-intuitive data point gives readers a reason to pause and engage with the details. They want to understand what caused the outlier, whether it is a one-time event or an emerging trend, and what it means for the broader picture. This curiosity encourages deeper exploration of the report, moving readers beyond the headline to examine the underlying data and compare segments.
To maximize impact, choose outliers that are genuinely surprising and relevant to your audience’s goals. Avoid trivial anomalies that might confuse or distract; instead, focus on data points that challenge assumptions or reveal hidden opportunities.
Honest Claims
A title distills a complex dataset into a handful of words, creating a real risk: a finding that holds under specific conditions can look like a universal truth once the qualifiers are stripped away. Writers should anchor titles in the actual statistical result rather than the most dramatic interpretation it could support. If a study found a modest correlation among a narrow population, the title should reflect that scope. Ask what the confidence intervals, sample sizes, and study conditions permit a reader to conclude, then draft a title that stays inside those bounds.
Sensationalized headlines often emerge from a predictable chain: a cautious finding gets sharpened into a causal claim, then into a promise, then into a scare or a miracle. Good practice breaks that chain early:
- Avoid causal verbs when the underlying analysis is correlational.
- Avoid words like skyrockets or plummets unless the rate of change genuinely warrants them.
- Describe changes in absolute terms alongside percentages, since a doubling from a tiny base can sound far larger than it is.
- Note the time frame explicitly, because a trend measured over three months reads very differently from one measured over a decade.
- Disclose comparisons honestly by naming the baseline and avoiding cherry-picked starting points that inflate a shift.
Before publication, ask whether someone who read only the title would form an accurate impression of the chart and its source data. If the title invites a conclusion the numbers cannot bear, revise it until the claim would survive scrutiny by the statisticians who produced the data. That discipline protects credibility and prevents misleading dissemination through social sharing.
Subtitle Strategy
A subtitle gives you room to carry the practical details that would weigh down a punchy main title. While the title states what the chart is saying, the subtitle answers the questions of when, how, and from where:
- Timeframes: A single reference date, a rolling window, a fiscal year, or a comparison period.
- Methodology notes: Details such as whether figures are seasonally adjusted, indexed to a base year, or calculated per capita.
- Data sources: The agency, survey, or database behind the numbers so readers can gauge reliability and follow up.
The craft lies in keeping the subtitle lean. Include only the details that would change how someone reads the chart. If a reader might misinterpret a jump in the data without knowing the series was rebased, that belongs in the subtitle; if a detail is merely interesting background, move it to a footnote or the surrounding text.
Keep the subtitle to a single line where possible, use plain sentence case, and set it in a smaller weight beneath the title so the visual hierarchy stays clear. Consistent placement across a set of charts helps readers know where to look without thinking about it. A subtitle that runs to three lines starts competing with the title and slows the reader down, so prune anything not needed on a first pass and prefer compact phrasing over full sentences.
Audience Fit
The same data rarely warrants the same title for every reader. Audience fit means deliberately choosing the vocabulary, level of detail, and tone of a title to match the people who will read it:
- Executive summaries: Lead with outcomes and implications. A leader scanning slides wants a title such as “Revenue growth slowed to 3% in Q3 as enterprise renewals slipped,” which delivers the finding and its cause in a single line while leaving jargon and methodology elsewhere.
- Technical reports: Serve readers who expect precision and scrutinize definitions. Here a title can carry methodological specificity—units, sample sizes, time windows, or segmentation criteria—that would clutter an executive slide. “Median latency by region, 95th percentile, 30-day rolling window” tells an analyst exactly what they are looking at in a neutral, descriptive tone, trusting them to interpret the data themselves.
- Public marketing materials: Reach a broader, less patient audience that responds more to benefit than to measurement. Favor plain language, active phrasing, and rounded, memorable figures connected to the reader’s interests: “Customers cut reporting time in half” rather than “Average reduction in report generation time following platform migration.”
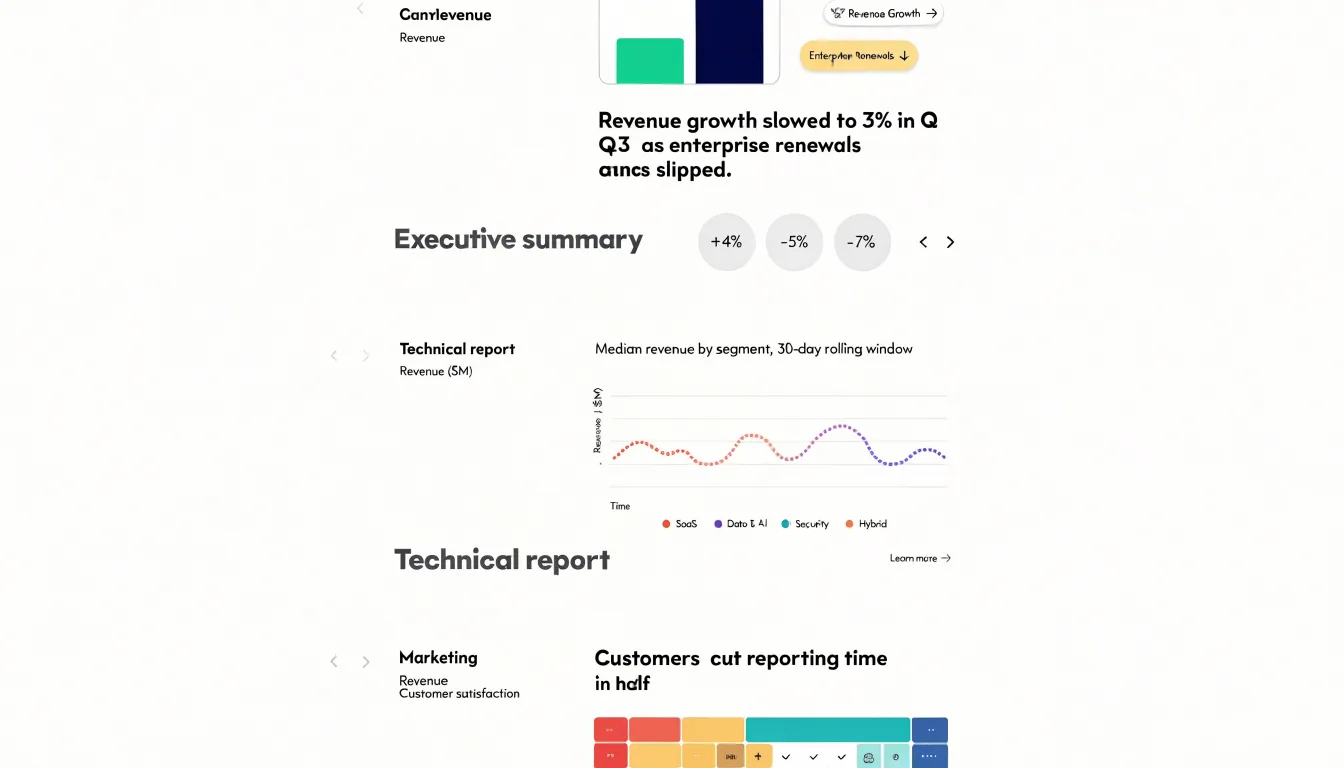
A title that works well in a boardroom can confuse a customer and frustrate an engineer. Recognizing which audience is in front of you is the first decision in drafting a title.
Real-World Examples
Seeing the transformation side by side makes the principle concrete:
- Quarterly sales across five regions: The weak topic label “Quarterly Sales by Region” becomes “West Region Doubles Growth While Others Stall,” directing attention to the single most important finding.
- Customer churn over eighteen months: The descriptive headline “Customer Churn Over Time” becomes “Churn Spiked After the Spring Pricing Change,” connecting a visible trend to a likely cause and inviting examination of the inflection point.
- Survey responses on employee satisfaction: “Employee Satisfaction Scores” becomes “Remote Staff Report the Lowest Satisfaction Scores” once the writer identifies the standout comparison.
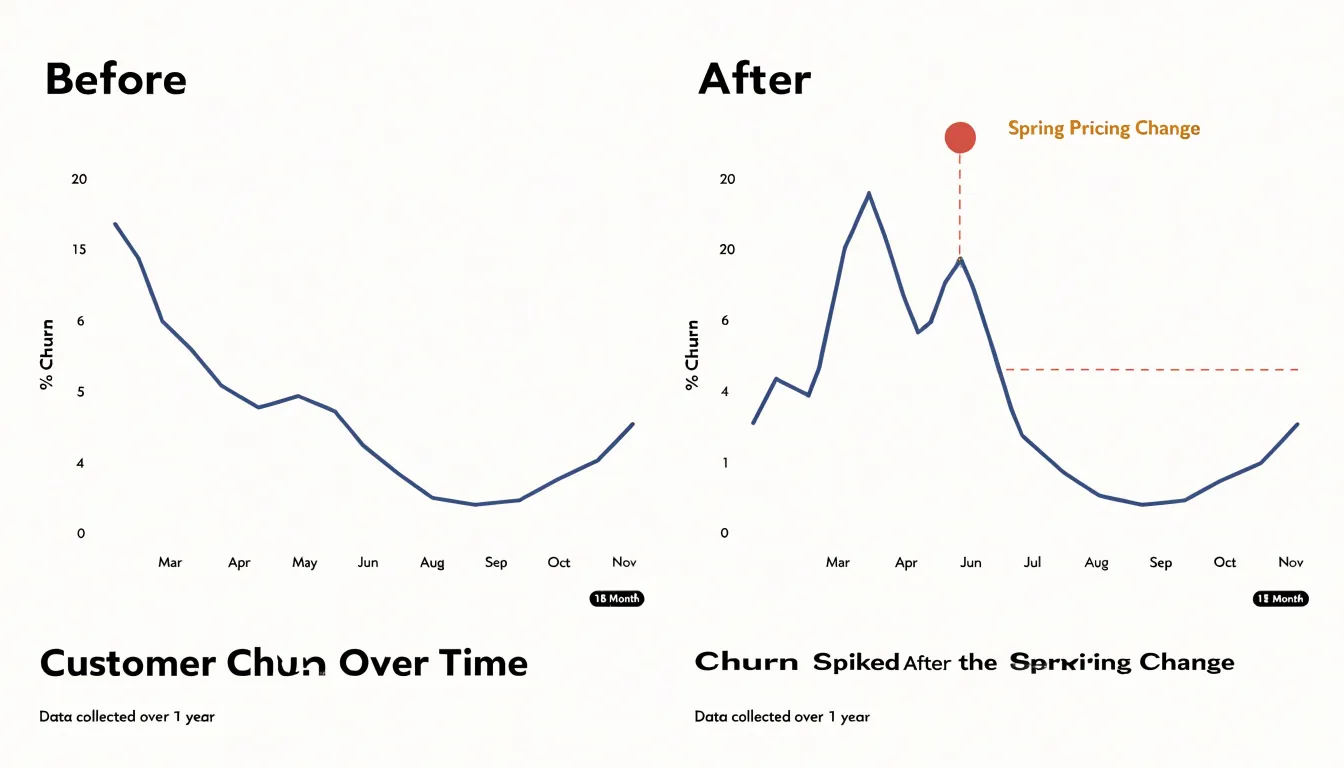
In each pair, the weak version names the variables while the strong version states the takeaway using a specific subject, a verb, and a direction or comparison (“doubles,” “spiked,” “lowest”). Collecting before-and-after pairs like these gives writers a practical reference when drafting their own titles.
Final Editing Checklist
Before a chart goes out the door, run a structured final editing pass:
- Clarity: Read the headline on its own, without the chart beneath it, to verify a busy reader would understand the main message without jargon or unexplained acronyms.
- Accuracy: Confirm that the direction of the claim matches what the chart shows, quoted numbers match the plotted values, and qualifiers like time period or geography are correct. Do not overstate small differences or round away important nuance.
- Length: Count the characters and words against the space available in the final layout. Long titles wrap awkwardly on small screens and compete with the chart for attention; trim redundant words and move secondary context to the subtitle or an annotation.
- Visual hierarchy: Check the size, weight, and color of the headline relative to axis labels, legends, and annotations so the title sits clearly at the top of the reading order. Inspect the finished piece on the device where most readers will see it, since a title that works on a desktop mockup can disappear on mobile.
- Sign-off routine: Have one reviewer check the words, another check the numbers, and the chart owner confirm the headline still reflects the intended story. Log any changes so the published version matches the approved version.
Frequently Asked Questions
What is an action title in a chart?
An action title states the conclusion the chart supports rather than naming only the topic. For example, “Sales Q3” might become “Q3 sales fell 12% as the western region lost momentum.”
Should chart titles include exact numbers?
Yes; exact figures carry authority because they can be checked, compared, and remembered. The article recommends drawing key numbers directly from the displayed data and placing them early in the title.
How do I keep a chart title concise?
Trim the title to ten words or fewer and cut phrases like “A Comparison of,” “Data Showing,” or “The Relationship Between.” Protect numbers, units, and time periods, and lead with the finding to save space.
How can I make sure a chart title is honest?
Anchor the title in the actual statistical result rather than the most dramatic interpretation it could support. Avoid causal verbs when the underlying analysis is correlational, and avoid words like skyrockets or plummets unless the rate of change genuinely warrants them. Also describe changes in absolute terms alongside percentages, note the time frame explicitly, and disclose comparisons honestly.
What should go in a chart subtitle?
A subtitle can carry practical details such as timeframes, methodology notes, and data sources. Keep it lean, use plain sentence case, and set it in a smaller weight beneath the title so it does not compete with the main headline.
How should chart titles differ for executives and technical audiences?
For executive summaries, lead with outcomes and implications, while technical reports can carry methodological specificity such as units, sample sizes, time windows, or segmentation criteria. Match the vocabulary, level of detail, and tone to the audience in front of you.
Tony Astor
Tony writes about data visualization and the tools people use to build charts and dashboards. More about Data Illustrator