How to Visualize Survey Results Clearly
 By Tony Astor ·

How to Visualize Survey Results Clearly
Choose bar charts to compare discrete survey responses (use horizontal bars for labels over ten characters or more than seven options), pie charts for single-select totals with five or fewer slices, line graphs for repeated surveys over time, and stacked bars or heat maps for composition and matrix questions. Always start axes at zero, label directly, and limit colors to highlight key findings.
Table of Contents
Bar Charts
Bar charts are a reliable format for comparing discrete survey response options because each bar represents a single category, making differences in frequency or percentage easy to read. Choosing between vertical and horizontal orientation depends on the response options and the space available for labels. Vertical bars work well when categories are short and few, such as yes/no questions or a handful of age brackets. The labels sit comfortably beneath each bar, and the eye compares heights from left to right.
Horizontal bars become the better choice as response options grow longer or more numerous. Likert scale statements, open-ended categories grouped into themes, or department names often run to several words, and placing them under a vertical bar forces rotation or truncation. Rotating labels 45 degrees forces readers to tilt their heads and makes dense text hard to scan. A horizontal layout places each label on a single line beside its bar, keeping text readable and aligning bars neatly down the page. Long option lists also benefit from horizontal orientation because the chart can grow downward without squeezing bars into a narrow width.
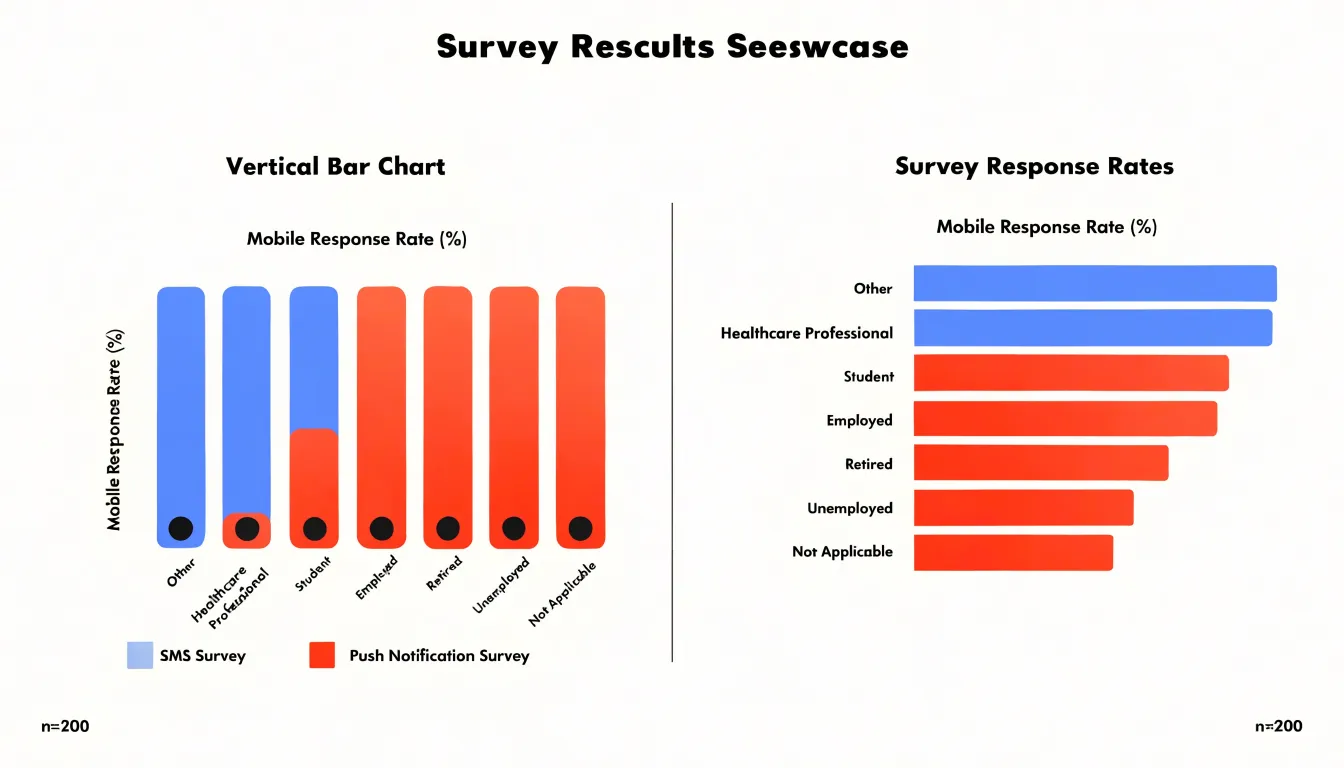
When deciding, count the characters in the longest label and the number of categories. If labels exceed roughly ten characters or options exceed seven, horizontal bars usually prevent overlap. Ordering bars by value rather than alphabetically strengthens comparison, while sorting options in a logical sequence—such as strongly disagree through strongly agree—helps readers follow intrinsic scales. Maintaining consistent spacing between bars keeps the chart uncluttered.
Pie Charts
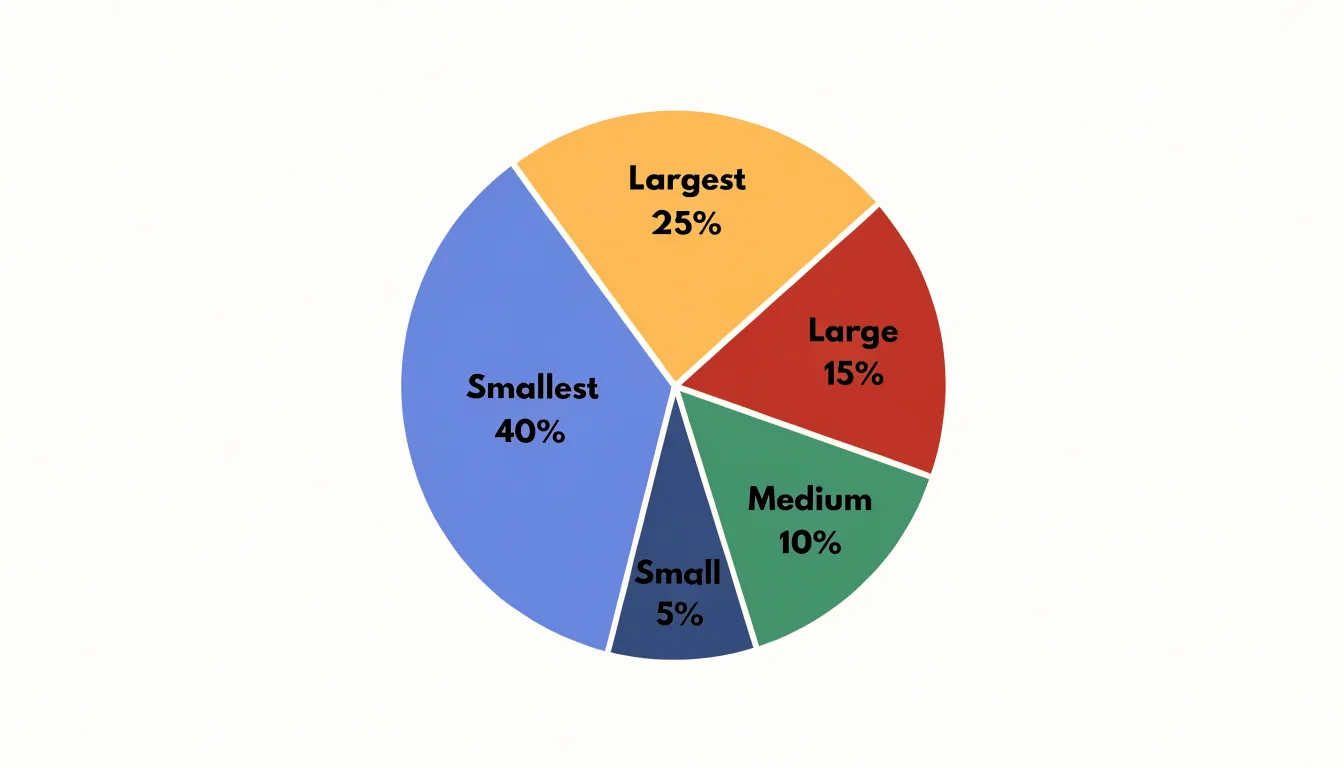
Pie charts show how individual categories combine into a single total. For survey reporting, this makes them a natural fit for single-select questions, where each respondent chooses one option and the slices together represent 100% of responses. Because every slice’s angle corresponds to its share of the whole, viewers can compare proportions only when the number of slices stays small. Limiting a pie to five or fewer slices keeps labels legible and prevents a cluttered ring of indistinguishable slivers. When a question produces more categories, group the smallest responses into a single “Other” slice, or switch to a horizontal bar chart.
Slices must be calculated from the real distribution of responses, including respondents who skipped the question. Decide up front whether percentages are based on all respondents or only those who answered, and state that base in the chart title or subtitle.
Avoid 3D effects, exploded slices, and tilted perspectives, which distort apparent area and make small differences look larger than they are. Keep slice order consistent, typically starting at the twelve o’clock position and moving clockwise from the largest slice to the smallest. Label each slice directly with both the category name and the percentage rather than using a separate legend whenever space allows.
Line Graphs
Line graphs are the natural choice when a survey is repeated on a regular schedule to reveal how responses evolve across continuous time intervals. When the same questions are asked in each wave—such as quarterly employee engagement items, monthly customer satisfaction ratings, or annual program evaluations—a line graph connects data points in sequence to make the direction of change visible. Each wave sits on the horizontal axis, and the measured value (a mean score, percentage agreement, or net promoter figure) sits on the vertical axis. A steady climb suggests improving sentiment, a flat run indicates stability, and a sharp bend signals a shift worth investigating.
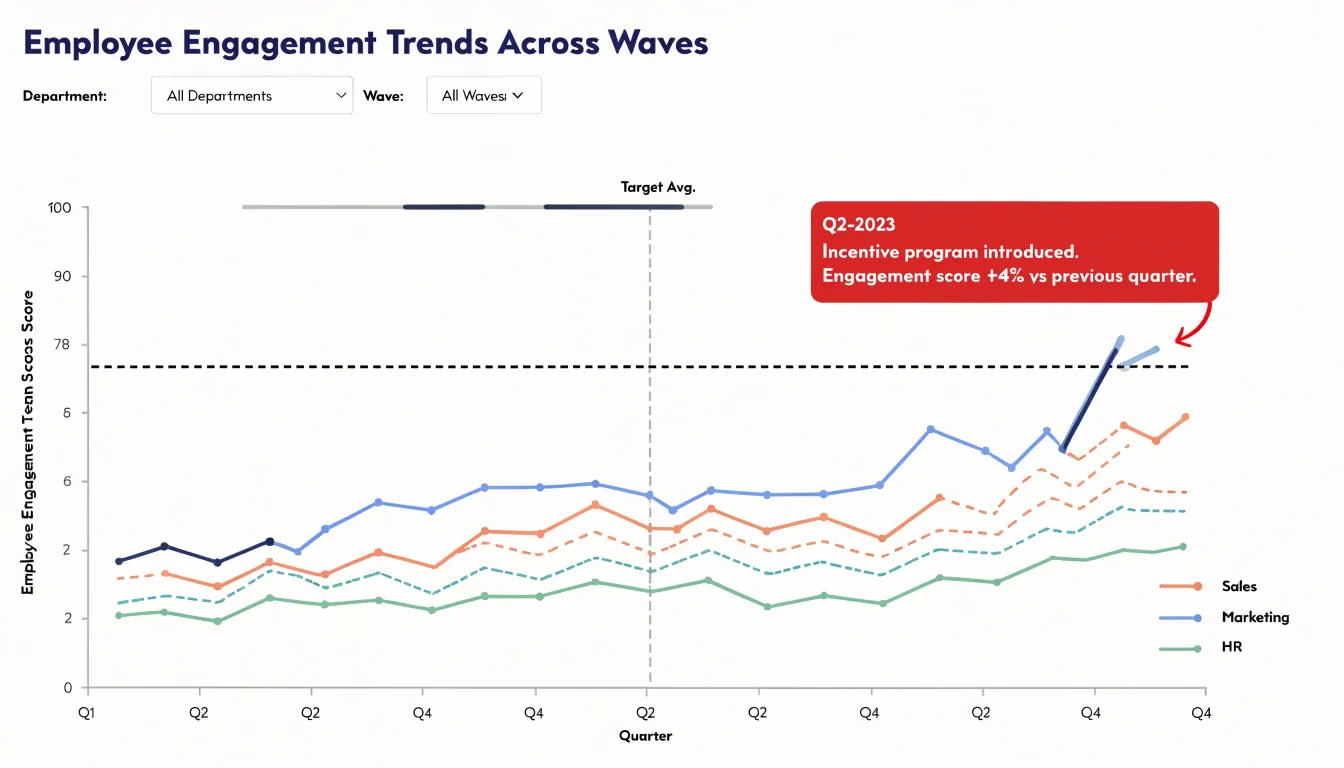
Mapping recurring longitudinal data requires consistent axis intervals that reflect real elapsed time. If surveys are conducted quarterly, place each quarter at an equal distance; if the cadence changes, annotate the axis so readers understand the gap. Plotting multiple series on the same chart, such as one line per department or customer segment, lets viewers compare trajectories and spot diverging groups. Keep the number of lines modest and use distinct colors or markers so each series remains legible.
Line graphs also expose seasonal shifts. When a dip appears at the same point every year, such as lower satisfaction during peak workload periods, the line helps analysts separate genuine change from predictable fluctuation. Adding a reference line for a target or prior-year average gives context to each movement, supported by clear axis labels, a concise legend, and a descriptive title.
Stacked Bar Charts
Stacked bar charts show how a total divides into component parts across multiple groups. Each bar represents a whole group, such as a department, region, or demographic cohort, while its internal segments correspond to response options or sub-categories. The full length of the bar communicates the group total, and the relative size of each segment shows the internal composition, allowing viewers to compare overall volume and makeup at once.
Keep the number of segments manageable. A bar divided into three or four categories reads easily, while ten segments create a patchwork that forces constant trips to the legend. Grouping smaller categories into an “Other” segment preserves clarity. Ordering segments consistently across every bar—often placing the largest category at the base—lets viewers scan horizontally and compare like with like.
Apply distinct hues uniformly across all bars so viewers can track a single sub-group from one cohort to the next. Where space permits, label segments directly inside the bars to remove the need for a legend. Percentage labels within segments focus on composition, while raw counts emphasize volume.
When comparing individual segments matters more than overall totals, a 100% stacked bar normalizes every group to the same length, making relative proportions the central message. Slight gaps between segments add visual separation without clutter.
Heat Maps
Heat maps display intensity across categories, making them ideal for matrix questions and dense cross-tabulations where patterns might get lost in a table of numbers. By assigning a color gradient to response values—typically light to dark or cool to warm—heat maps let viewers spot high and low activity instantly. In a matrix question where respondents rate multiple attributes on a scale, the color coding reveals which attributes score consistently high and which lag behind.
In cross-tabulations with many categories, such as demographic segments by survey items, a heat map highlights important intersections by intensity. Viewers can see where responses cluster—such as a specific age group showing strong agreement with a statement—or spot a moderate value standing out against a sea of low values without scanning every number.
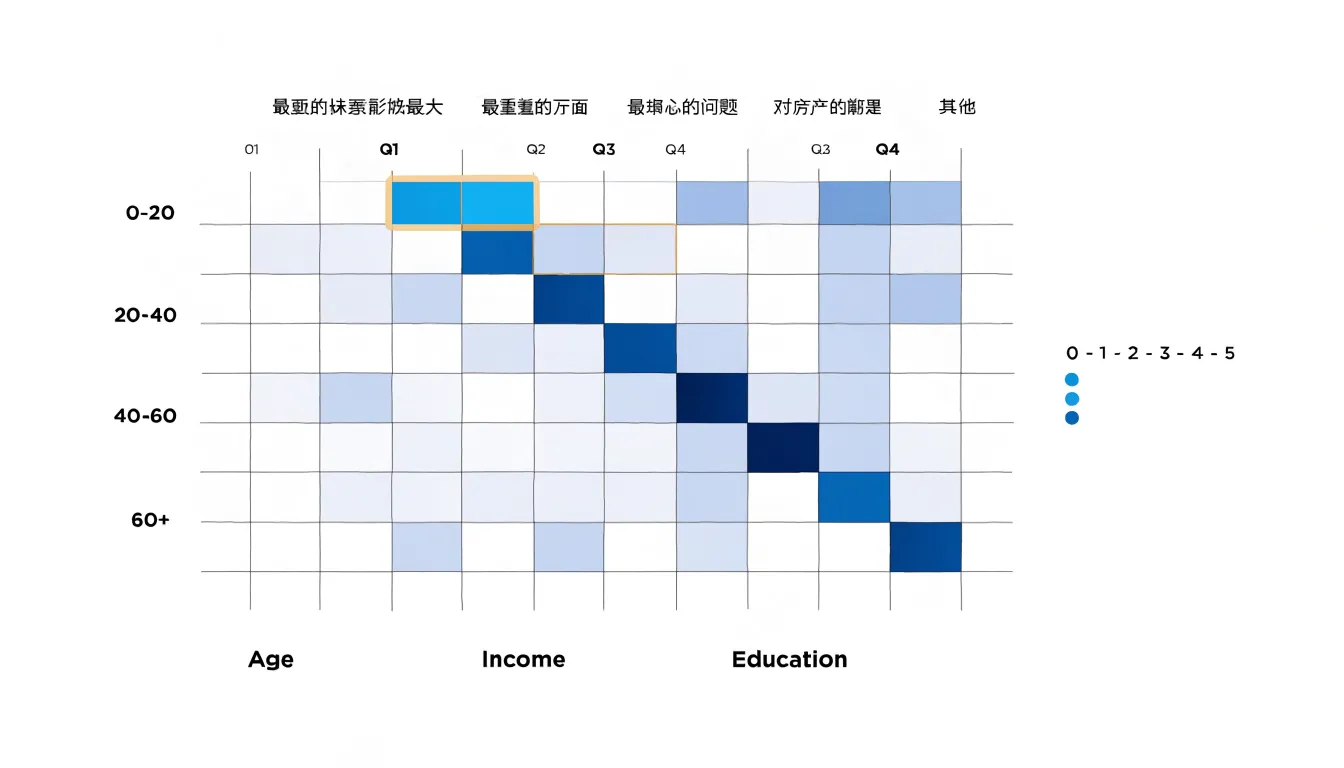
Sequential palettes (e.g., light blue to dark blue) work well for ordered data, while diverging palettes (e.g., red to blue with white in the middle) highlight deviations from a midpoint. Include a clear legend and ensure sufficient color contrast for accessibility.
Likert Scale Charts
Likert scale questions produce data with a natural direction running from strong disagreement through neutrality to strong agreement. A divergent stacked bar chart preserves this direction by placing a single horizontal bar for each question and dividing it into segments for the response options. Negative responses extend to the left of a central baseline while positive responses extend to the right, mirroring the scale’s midpoint so viewers see instantly whether opinion leans toward agreement or disagreement.
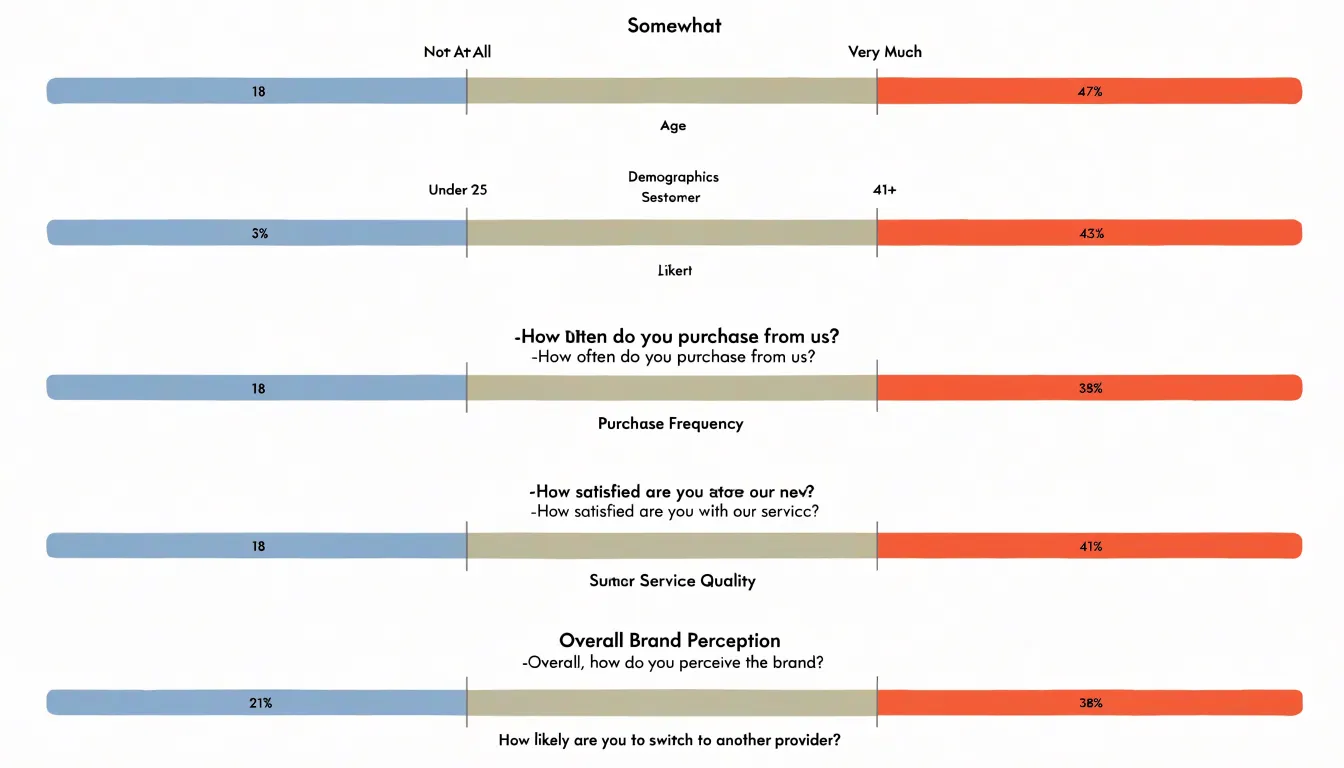
Rather than letting neutral responses blur the boundary between positive and negative sentiment, place the neutral segment directly at the center of the bar, often in a muted tone so it reads as a pivot point. Because each segment’s width corresponds to the proportion of respondents who selected that option, the chart shows the full distribution of sentiment in a single view. Comparing bars across questions reveals how agreement shifts from item to item. Consistent color assignments across bars, clear labeling of scale endpoints, and a legend ensure readers can decode the chart without checking the questionnaire.
Word Clouds and Text Charts
Open-ended survey questions produce rich material, but varying detail, spelling, and tone make verbatim comments resistant to simple tallying. A practical first step is thematic extraction: reading responses and grouping similar comments under shared labels such as product reliability, pricing concerns, or support responsiveness. Reporting the number of comments in each theme shows which issues dominate, while selected quotes illustrate patterns in authentic customer language.
Keyword frequency visuals offer a complementary summary. A word cloud arranges the most frequent terms in a response set, sizing each word by how often it appears to give an at-a-glance impression of common topics. Text charts display keywords alongside counts or ranked bars, adding precision by making exact frequencies easy to compare. Both approaches require basic cleaning: removing common stop words, merging variants of the same term, and consolidating synonyms so related language does not split the frequency count.
These visuals work best as summaries rather than conclusions. A word cloud might highlight frequent mentions of wait times or billing, while the surrounding narrative connects those mentions to coded themes and representative quotes.
Color and Contrast
A purposeful color scheme directs attention before a reader processes a single label or number. Start with a small set of hues chosen for their relationships: a calm base for background elements, a neutral mid-tone for supporting categories, and one or two saturated accents reserved for key findings. If every bar, slice, or line carries equal visual weight, the reader has to sort the data themselves; a restrained palette does that sorting in advance.
Working from your organization’s brand colors keeps reports consistent across materials. Assign each brand color a specific role: a primary color for the headline metric, a lighter tint for secondary categories, and a deeper shade for comparisons or benchmarks. Role-based assignment prevents the palette from becoming merely decorative.
High-contrast accents draw the eye to a single data point, such as a spike in a trend line, the top response in a ranking, or a diverging segment. Limit a view to two or three high-contrast moments so they do not cancel each other out and create visual noise. Check that accent colors hold enough contrast against their backgrounds for readers with low vision or color blindness, and pair color with labels or position so meaning never rests on hue alone.
Decluttering Charts
Every gridline, legend entry, border, and background shade competes for attention. Decluttering applies the data-ink ratio: maximizing the proportion of ink devoted to actual data and minimizing everything else.
Start with gridlines. Light horizontal reference lines help readers estimate values, but dense two-directional grids add weight without insight. Remove vertical gridlines, thin the remaining ones, or replace them with faint axis ticks. Apply the same scrutiny to legends: when a chart uses only two or three categories, place direct labels next to the lines or bars to eliminate back-and-forth lookups.
Remove heavy chart frames, shaded plot backgrounds, thick axis lines, drop shadows, and textured fills. A clean chart often needs only a subtle baseline and unobtrusive tick marks. Test every removal against comprehension: if readers can still read values accurately and compare categories quickly, the element was not earning its place.
Clear Labels and Scales
For bar charts and similar visuals where length represents quantity, start the axis at zero so visual proportions remain honest.
Next, use direct data callouts by placing actual numbers near the relevant data points or bars. This saves readers from tracing lines to an axis to estimate values and often eliminates the need for a separate legend or table.
Finally, choose legible, unadorned typography with high contrast against the background, and size fonts so they can be read on mobile screens without zooming. Test charts across screen sizes to prevent overlapping or truncated labels, and format numbers consistently by aligning decimal places and using thousands separators.
Highlighting Key Insights
Because decision-makers often spend only a few minutes with a report, the most important finding on the page should be the most visually prominent.
Three tools create this hierarchy of attention:
- Callout boxes: A contained area beside the chart that states a finding in plain language—such as noting that satisfaction among first-time customers dropped twelve points this quarter—gives busy stakeholders an immediate entry point.
- Bold text annotations: Labeling a specific bar or trend line directly on the chart explains unusual spikes and anchors the claim to the supporting evidence.
- Focal color: Rendering most of the chart in neutral tones while picking out a single element in a strong accent color draws the eye before deliberate reading begins.
Used together, these techniques make the takeaway obvious at a glance and turn a passive report into a decision aid.
Avoiding Misleading Charts
Choices about axes, scales, and geometry can distort how survey data is perceived:
- Truncated y-axes: Starting a scale above zero makes small differences look larger and exaggerates change. Unless there is a compelling reason to truncate—paired with clear labeling—start the y-axis at zero.
- Inconsistent scale increments: Changing the distance between gridlines or tick marks without indication skews the visual weight of data points, especially when comparing multiple survey questions or time periods.
- Area and volume distortions: Using 3D pie charts or scaling pictogram icons in two dimensions exaggerates differences depending on placement and size. Stick to two-dimensional bar and line charts, and arrange categories in a logical order (by value or natural sequence) to support accurate interpretation.
Mobile-Friendly Charts
Because many stakeholders review results on smartphones, charts must hold up on small screens. Give interactive elements—such as tooltips, filter menus, and legend toggles—a tap area of at least 44 by 44 pixels with generous spacing to prevent accidental taps. Place labels directly beside data points rather than relying on hover states that do not exist on touch devices.
Vertical layouts fit narrow screens better than wide ones. A horizontal bar chart that works on a desktop can become cramped on a phone, whereas a vertical stacked bar or a ranked list stays legible. Keep category labels horizontal, and split numerous data series into vertically stacked small multiples, each with a compact title, so users can scroll through one comparison at a time.
Use relative units and fluid grids so charts scale with the viewport instead of breaking at fixed pixel widths. At smaller breakpoints, drop gridlines, reduce tick marks, collapse secondary series behind a toggle, and put the headline number or trend at the top so the key takeaway appears before scrolling. Always test charts on phones in both portrait and landscape orientations.
Dashboards
Dashboards bring individual survey visualizations onto a single screen, letting viewers move between response rates, demographic breakdowns, and open-ended themes without losing their place. Arrange charts in a clear hierarchy: place headline metrics at the top and supporting details below so the eye travels from the big picture to finer points.
Interactivity separates a dashboard from a static report. Shared filters let viewers segment data by respondent group, time period, or question category, recalculating every tile in step so comparisons stay consistent. Hover tooltips can reveal exact values and sample sizes, while linked highlighting lets a selection in one chart flag corresponding data across the screen.
Cohesion requires restraint. Use consistent color palettes, share axes and scales where comparisons are intended, and ensure each tile answers a distinct question without duplication.
Frequently Asked Questions
When should I use a horizontal bar chart instead of a vertical one?
Use horizontal bars when response options are longer or more numerous; if labels exceed roughly ten characters or options exceed seven, horizontal bars usually prevent overlap. Vertical bars work well for short, few categories such as yes/no questions or a handful of age brackets.
How many slices should a pie chart have?
Limit a pie to five or fewer slices to keep labels legible and prevent a cluttered ring of indistinguishable slivers. If a question produces more categories, group the smallest responses into a single “Other” slice or switch to a horizontal bar chart.
What is a line graph best for in survey reporting?
Line graphs are the natural choice when a survey is repeated on a regular schedule to reveal how responses evolve across continuous time intervals. They work well when the same questions are asked in each wave, such as quarterly employee engagement items or monthly customer satisfaction ratings.
How can I make a heat map accessible?
Include a clear legend and ensure sufficient color contrast for accessibility. Sequential palettes such as light blue to dark blue work well for ordered data, while diverging palettes such as red to blue with white in the middle highlight deviations from a midpoint.
How should I design survey charts for mobile screens?
Give interactive elements such as tooltips, filter menus, and legend toggles a tap area of at least 44 by 44 pixels with generous spacing. Vertical layouts fit narrow screens better than wide ones, and charts should be tested on phones in both portrait and landscape orientations.
How can I avoid making survey charts misleading?
Start the y-axis at zero unless there is a compelling reason to truncate it, paired with clear labeling, because starting above zero makes small differences look larger. Keep scale increments consistent and stick to two-dimensional bar and line charts to avoid area and volume distortions.
Tony Astor
Tony writes about data visualization and the tools people use to build charts and dashboards. More about Data Illustrator