How to Visualize Part-to-Whole Relationships
 By Tony Astor ·

How to Visualize Part-to-Whole Relationships
Part-to-whole visualizations show how individual categories contribute to a total. Pie and donut charts suit two to five simple segments; stacked bars compare totals and composition across groups; 100% stacked bars compare proportions only; treemaps and sunbursts handle hierarchical data; waffle charts map percentages onto a 100-square grid; Sankey diagrams trace flows across stages.
Table of Contents
Pie Chart
Pie charts excel at showing simple fractions of a whole when your data has only a few categories—typically two to five. With this limited number of slices, viewers can easily compare each segment to the whole and to each other. For example, a pie chart works well to display market share among three competitors or the breakdown of a household budget into four main expenses. When you have more than five categories, the slices become too thin to interpret accurately, and the chart loses its effectiveness.
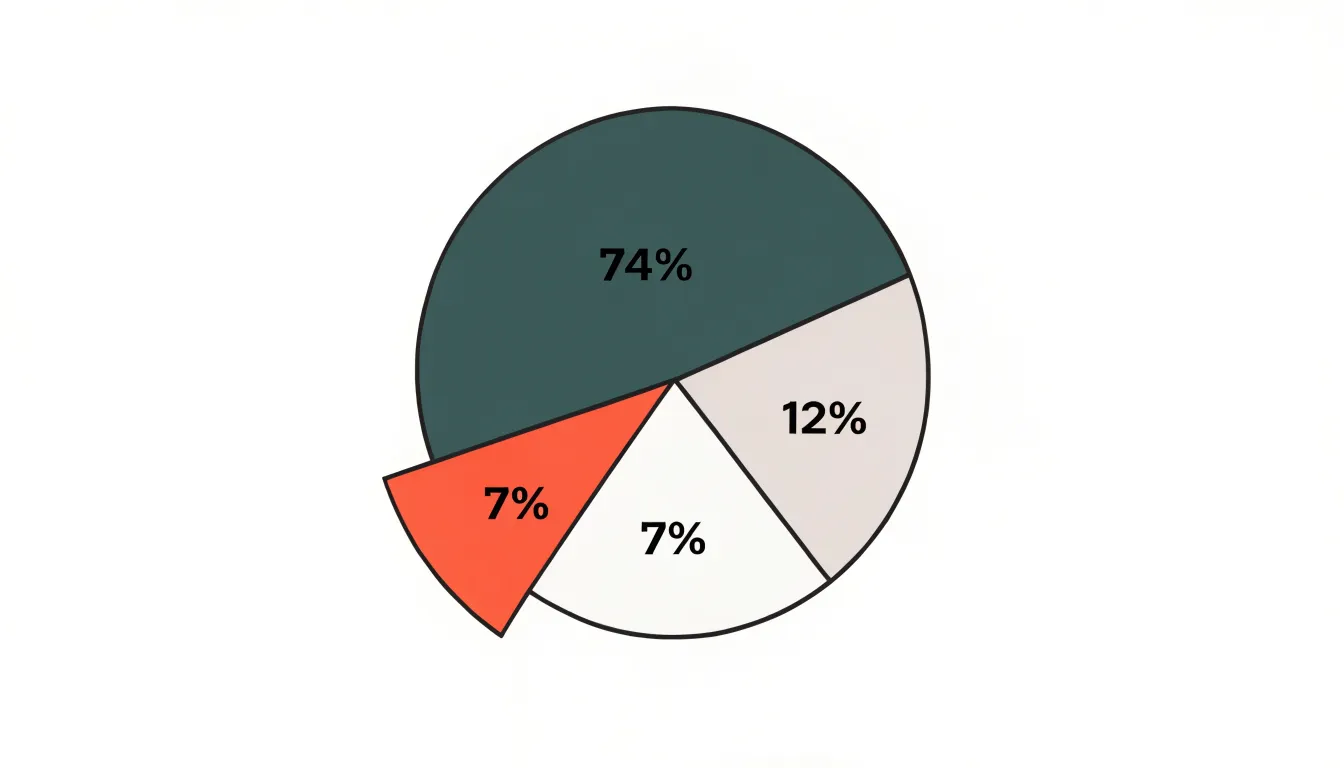
Ordering slices thoughtfully enhances readability. A common best practice is to arrange slices by size, either clockwise from largest to smallest or starting at the 12 o’clock position with the largest slice and proceeding clockwise. This ordering creates a natural visual hierarchy, making it easier for viewers to grasp the relative proportions. Alternatively, you might order slices to follow a logical sequence, such as chronological order or the order of steps in a process, if that sequence is meaningful to your audience. Consistency in ordering across multiple pie charts also aids comparison.
To emphasize key proportions, use visual cues sparingly. You can pull out a slice slightly (explode it) to draw attention, but reserve this for the most important category. Another technique is to use a distinct color or a contrasting shade for the slice you want to highlight, while keeping other slices in muted tones. Adding data labels directly on the slices, showing percentages or values, helps viewers quickly grasp the emphasized proportion. Avoid using too many emphasis techniques at once, as this can clutter the chart and confuse the message.
Donut Chart
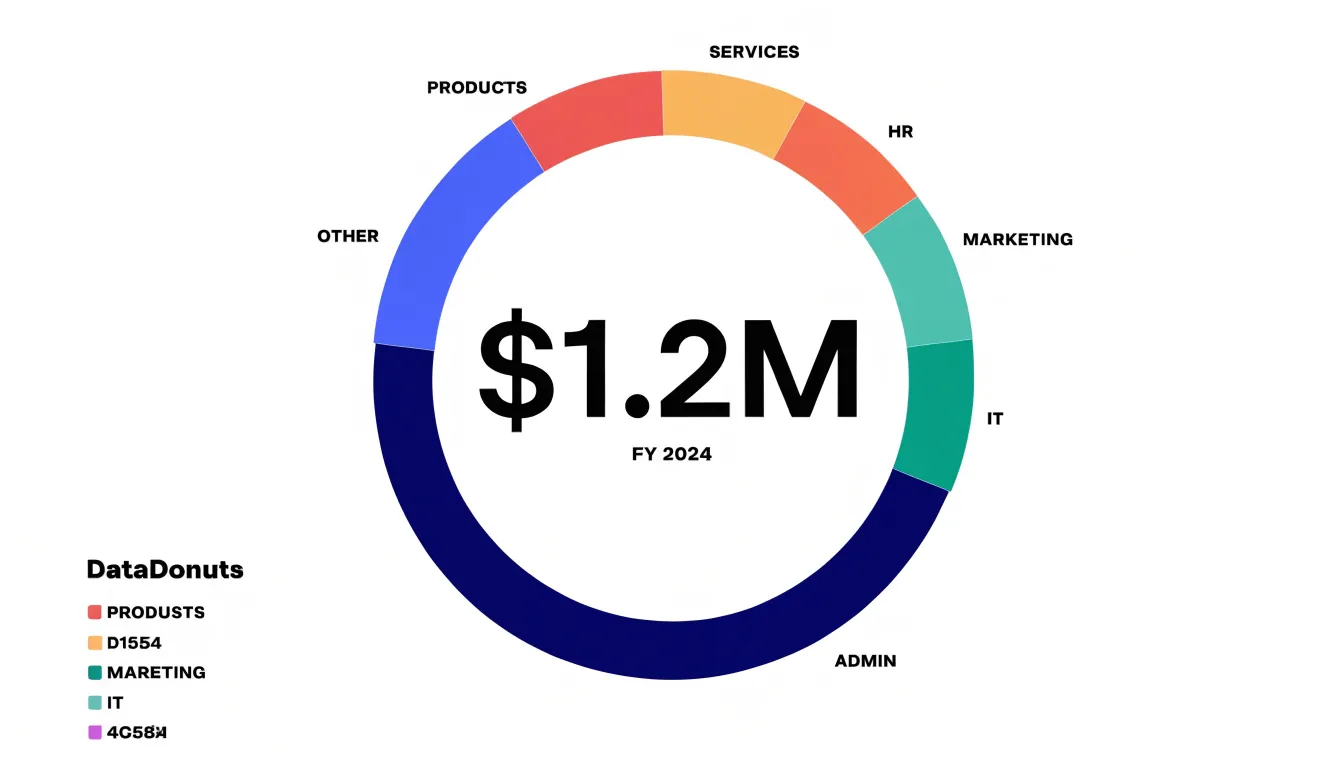
The donut chart takes the segmented circle of a pie chart and removes the middle, replacing solid wedges with arcs wrapped around a hollow core. That empty center changes how readers process the graphic. With a pie chart, the eye is pulled toward the crowded point where all the slices converge, and the sharp angles near the apex make small differences between similar wedges hard to judge. In a donut chart, each segment reads as a band of consistent thickness along the outer ring, so the viewer can follow the arc length and gauge proportion without the visual noise of a cluttered center. The open middle also lightens the overall composition, giving the surrounding arcs more breathing room and making labels, leader lines, and category names easier to place around the perimeter.
The cutout itself is useful real estate. A common approach is to place a single headline figure at the center, such as the total value the segments sum to, the largest category’s share, or a period-over-period change. Centering this figure anchors the chart and lets readers interpret the surrounding arcs against an immediate reference point. Secondary text, like a label reading ‘Total Revenue’ or ‘FY 2024,’ sits directly beneath the number in a smaller weight. Some designers use the space for a short callout or annotation that summarizes the story, while others insert a sparkline or a small icon to add context. Keep the center content minimal, sized to fit comfortably within the inner radius, and aligned to the visual center rather than the geometric center when the ring carries a label. A restrained center keeps the focus on the arcs; a busy one competes with the data it is meant to clarify.
Stacked Bar
Stacked bar charts show part-to-whole relationships across multiple categories at once. The total length of each bar represents the aggregate value for a group, while the bar itself is divided into segments whose lengths correspond to the component categories that make up that total. This dual reading allows a viewer to compare totals between groups and inspect how each group distributes its value across the same set of subcategories. A retail analyst might use this to compare regional sales totals while seeing the product mix within each region, or a survey report might show overall response rates per demographic group with each bar split by answer choice.
The shared categorical segments should appear in the same order and color across every bar, ordered from largest to smallest or following a natural sequence such as hierarchy or process stage. When totals vary widely, adding a direct label of the total value at the end of each bar removes the need to trace back to the axis. A useful refinement is pairing a stacked bar with a summary row or reference line that emphasizes the total comparison, then letting the segments carry the internal breakdown. For very long category lists, horizontal orientation gives segment labels room to breathe. Designers should also consider whether the primary message is the total or the composition, since that priority guides decisions about bar ordering, label placement, and whether to annotate individual segments.
Full Stacked Bar
A 100% stacked bar chart shifts the emphasis from absolute totals to proportional composition. Each bar is normalized to represent 100%, with segments showing the percentage each category contributes to the whole. This normalization allows you to compare the relative makeup of different datasets directly, even when their total magnitudes vary widely. For example, if you want to compare the sales mix of a small boutique and a large chain, a standard stacked bar would make the boutique’s bar tiny and hard to read. A 100% stacked bar gives both bars equal length, so you can easily see whether the boutique relies more on accessories or apparel relative to the chain.
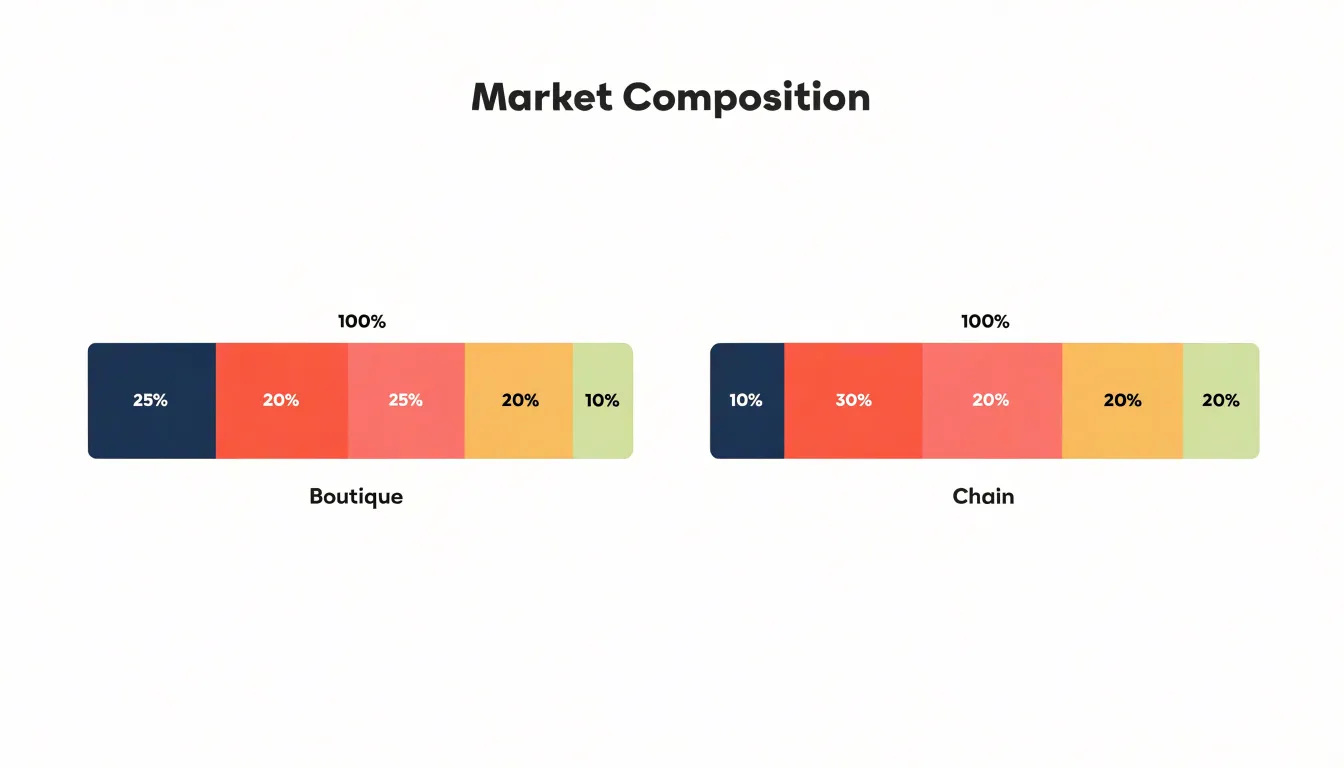
By converting all bars to the same length, the viewer’s attention is drawn to the internal proportions and how they vary across groups. This is particularly useful when totals are not the main point of interest, or when they differ so much that they would obscure compositional patterns, such as a category that consistently takes up a larger share in one group compared to another.
However, the 100% stacked bar does not show actual totals; it only shows percentages, meaning you lose information about the scale of each dataset. If the absolute values matter, a regular stacked bar or a combination of charts might be more appropriate. Additionally, a small percentage in a large dataset could represent a larger absolute value than a large percentage in a small dataset, so the chart should be used with caution when absolute comparisons are also needed.
Treemap
A treemap represents a hierarchical dataset as a set of nested rectangles, where the total area of the chart corresponds to the whole and each rectangle’s area is proportional to its value. A top-level category occupies a large region of the canvas, and its subcategories subdivide that region into smaller rectangles, which can themselves subdivide further. This nesting continues down the hierarchy, so a single view can carry two, three, or even four levels of categorical detail without forcing the reader to consult a legend for every branch. Each level is visually encoded through position and size, and additional variables such as color can reinforce grouping or signal a secondary measure like growth rate or margin.
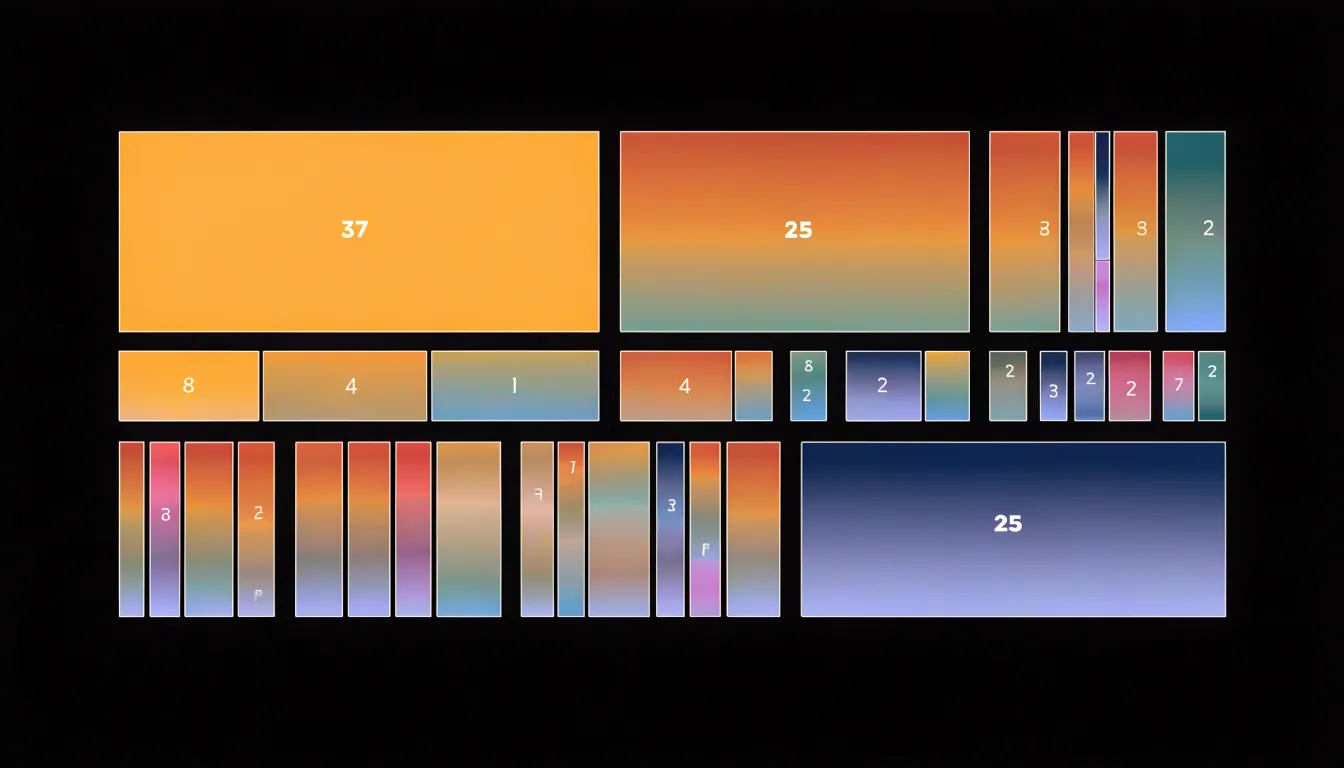
Treemaps earn their place when datasets are dense, containing dozens of categories and several layers of subcategories. Where slice-based charts struggle once a category falls below a few percent of the total, rectangles scale down more gracefully: even modest values retain a visible footprint, and the rectangular packing uses the available space efficiently, keeping labels and values legible across a wide range of magnitudes.
Because rectangles align along shared edges within a parent region, readers can scan rows and columns of subcategories and judge relative sizes at a glance. Grouping is explicit, since every child sits inside its parent, making the hierarchy self-evident rather than something the reader must reconstruct from color keys. Consistent color ramps per branch, restrained borders between nested levels, and direct labeling of the largest rectangles keep the structure readable. Ordering rectangles by value within each parent lets readers follow a predictable pattern, and limiting depth to what the data genuinely needs prevents the smallest tiles from turning into noise.
Sunburst Chart
A sunburst chart displays hierarchical part-to-whole relationships by mapping a multi-level categorical structure onto concentric rings, with each ring representing a level of the hierarchy. The central circle is the root category, and each successive ring moving outward corresponds to a deeper level, such as subcategories or sub-subcategories. Each node in the hierarchy is drawn as an arc, and its angle is proportional to its share of the whole at its level. This radial layout enables viewers to trace a path from the root to any leaf, comparing proportions at each branching point.
To read a sunburst chart, start at the center and move outward along a radial direction. The angle of each arc shows the relative size of that category within its parent. For example, in a budget breakdown, the central circle might represent total spending, the first ring major categories like housing and food, the second ring subcategories, and so on. Because all levels are visible simultaneously, patterns such as dominant branches or unusually small leaves stand out.
Sunburst charts work well when the hierarchy is moderately deep, typically up to three or four levels, and when the number of categories at each level is manageable. The radial design uses space efficiently and creates a natural sense of flow from the center outward, though careful labeling and color use are essential to guide interpretation. Interactive features like hover details or click-to-zoom can further support exploration of multi-layered data step by step.
Waffle Chart
A waffle chart replaces the continuous bar or pie with a grid of small squares, most commonly arranged as ten rows of ten. Each square represents one percent of the total, so the complete grid stands for the whole. To show that a category accounts for thirty-seven percent, you fill thirty-seven squares and leave the rest in a neutral shade. Readers grasp this instantly because counting small units is natural, and the hundred-square frame maps directly onto the idea of a percentage. The chart communicates fractions without requiring the viewer to estimate angles or compare lengths.
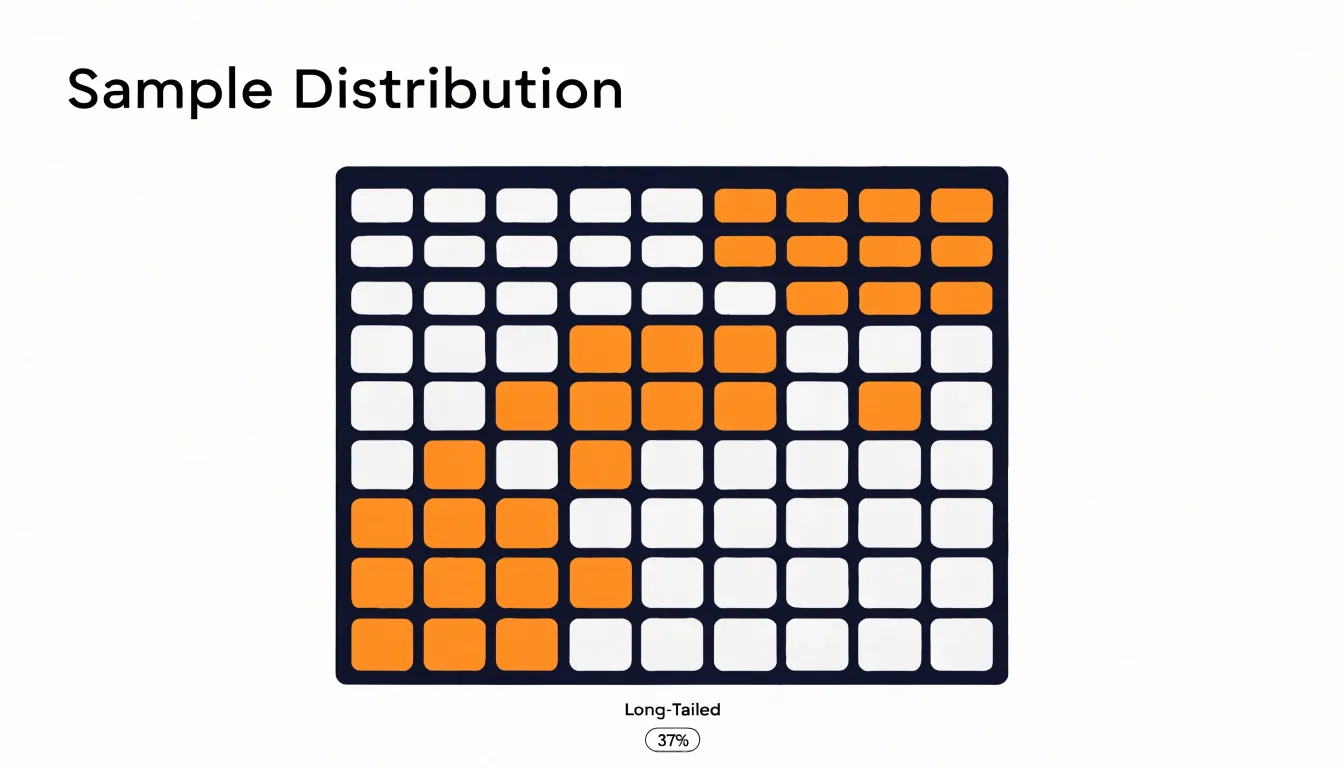
This makes the waffle chart effective in public-facing dashboards and visual reports, where audiences may have limited time and no statistical training. Because the overall shape stays constant across categories, side-by-side waffle charts invite direct comparison: a viewer can see at a glance that one group occupies noticeably more squares than another.
The grid format also supports partial squares, partial fills, or grouped color bands when a whole is divided into several segments, letting a single chart show a complete breakdown while preserving the hundred-unit scale. Designers can add labels inside the filled area, annotate key thresholds, or highlight differences by leaving a clear gap between segments. It favors clarity over precision and turns percentage communication into a visual counting exercise.
Sankey Diagram
A Sankey diagram represents part-to-whole relationships as flows rather than as static slices or bars. The overall width of the diagram corresponds to the total quantity being tracked, and that total is divided into bands whose thicknesses are proportional to the amounts they carry. Where a stacked chart stops at a single snapshot, a Sankey follows those bands across a sequence of stages, so the reader can trace how a starting quantity is split, recombined, and redistributed as it moves through a system. The bands connect stage to stage, and their changing widths reveal gain, loss, and transfer at each step.
This makes Sankey diagrams well suited to process flows:
- Manufacturing pipelines: Raw material enters, splits into product and scrap, and the surviving product divides again into finished goods and rework.
- Energy systems: A primary fuel is tracked from generation through conversion and transmission to final end uses, with waste heat falling away at each stage.
- Resource allocations: A budget or staffing pool flows from a central source into departments and then into specific projects, making it plain which destinations consume the largest share.
When proportions shift across multiple stages, the bands narrow or widen to show where the composition of the whole has altered, with splits and merges appearing as branches and junctions. Consistent left-to-right ordering of stages, clear labels at nodes, and restrained color that distinguishes flows without overwhelming them all help the reader follow the bands. Limiting the number of stages and nodes keeps the diagram readable, and showing quantitative values alongside widths grounds the visual impression in precise figures.
Chart Selection
Selecting a chart for part-to-whole data depends on three factors:
- Category count: When a whole divides into three to seven segments, pie charts, stacked bars, and treemaps each carry the message without strain. As category counts climb into the teens or higher, visual clutter becomes the dominant constraint, shifting the practical answer toward treemaps or ranked stacked bars with grouped small segments.
- Data complexity: Simple single-value splits suit classic part-to-whole forms. Hierarchical or multi-level compositions call for treemaps, sunbursts, or nested bar structures that preserve parent-child logic. When the same whole shifts across periods, a stacked bar series or area chart lets readers track both the total and the internal reallocation.
- Audience intent: If the goal is a quick impression of dominance, pie charts and treemaps let the largest segment command attention immediately. If the goal is precise comparison between segments, bar-based forms give readers a common baseline to measure against. If the goal is exploration, favor forms that reward closer inspection, such as interactive treemaps with drill-down. Writing down the intended takeaway in one sentence is a reliable test for matching the chart to your goal.
Color Strategy
In a part-to-whole visualization, the shades assigned to each segment show where one portion ends and the next begins, and how the pieces relate to the whole. A sequential palette, in which a single hue progresses from light to dark, works well when the segments have an inherent order, such as ranges of spending from lowest to highest. Reserve your sharpest contrast for the segment that matters most, giving the key proportion a saturated accent shade against quieter neighbors so it draws attention immediately. For segments that are distinct in kind rather than degree, a set of clearly separated hues communicates difference at a glance.
Every additional color adds a demand on the reader’s attention, and too many competing shades quickly become visual noise. Limit the palette to a handful of shades, let neutral tones carry the less important segments, and keep saturation consistent across categories so that brightness signals importance rather than decorating the chart. Test your choices by squinting at the finished graphic: the largest and most significant portions should remain legible, and the relationships between segments should still read clearly.
Labeling Guidelines
Place labels directly on or immediately beside each segment, close enough that the association is unambiguous. For pie and donut charts, position labels outside the arcs when slices are thin, using short leader lines to keep the connection clear. Inside labels work best for larger segments where the text has room to breathe. Keep a consistent number format throughout the chart, rounding all values to the same precision so that readers compare like with like. If rounding causes segments to add up to 99 or 101 percent, note the discrepancy in a small footnote rather than silently distorting one slice to compensate.
Legends create a second lookup step: the reader finds the color in the chart, then finds it again in the legend. Direct percentage labeling removes that step, making it the strongest choice for part-to-whole charts with a modest number of segments. Reserve a legend for cases where categories repeat across multiple charts or where segment names are too long to fit near their shapes. Even then, place the legend close to the chart and order its entries to match the visual order of the segments, clockwise from the top for circular charts.
A percentage printed on a segment anchors the reader to the true value, so modest design imperfections matter less. Avoid heavy shadows that spill beyond the arc boundaries and distort perceived size. Set type at a readable size relative to the segment, and move or rotate labels rather than shrinking them.
Common Mistakes
Two design traps appear frequently when mapping proportions visually:
- Misapplied 3D effects: Rendering a pie chart with depth and perspective tilt distorts the proportions. Slices near the front of the tilted disc appear larger than slices of identical size placed toward the back, so the viewer’s estimate is shaped by position rather than value. Perspective also obscures area at the edges, making small slices almost impossible to read and forcing the eye to judge curved surfaces instead of flat angles. Keep proportions flat, letting the angle or length of each segment carry the message without decorative rotation.
- Overcrowding: Trying to show twenty categories at once collapses a chart into slivers too thin to label, color distinctly, or compare, while turning the legend into a long cross-referencing list. Group the smallest categories into a single ‘Other’ segment (using a neutral tone) to keep the chart focused on the parts that matter most. Around five to seven slices is a comfortable ceiling for a pie or donut, while stacked bars tolerate somewhat more before the eye loses track.
Accessibility
Roughly one in twelve men and one in two hundred women experience some form of color vision deficiency, meaning reds and greens, or certain blues and purples, can collapse into nearly identical tones and erase the boundaries between segments. The first defense is high visual contrast: choose hues that differ substantially in lightness as well as hue, so boundaries remain visible regardless of color perception. Pairing a light fill with a dark fill, or adding a thin white or dark border between segments, keeps the edges legible.
Pattern fills offer a second layer of redundancy. Combining a solid or textured pattern—such as a dotted fill, diagonal hatching, or crosshatch—with each hue means every segment carries both color and texture cues. This works best when patterns are distinct from one another and applied consistently across the chart, so readers can match legend entries to segments without guessing.
Finally, review charts through colorblindness simulation tools, and ideally ask people with visual impairments to evaluate drafts. Check legend readability, label placement, and whether the chart still communicates its key takeaway when viewed in grayscale or with reduced contrast.
Dashboard Overview
Before sharing a dashboard, review proportion accuracy through a structured validation workflow:
- Verify underlying calculations: Confirm that each part-to-whole visualization uses a consistent denominator and that percentages sum to 100% (allowing for rounding). Check that no data has been inadvertently filtered out or double-counted, and pay attention to how missing or null values are handled, as these can distort proportions.
- Assess visual integrity: Ensure that slice angles or bar segment heights accurately reflect the data values without distorting 3D effects, and confirm that colors are distinct and consistently applied across related charts.
- Review labeling: Every chart needs a clear title, axis labels (where applicable), and an unambiguous legend or direct labels. Include tooltips or labels displaying exact values or percentages, especially for small segments, without cluttering the view.
- Test overall clarity: Have a colleague who is unfamiliar with the data review the dashboard to catch any confusion. Document your validation steps and keep a checklist for future reviews.
Frequently Asked Questions
How many categories should a pie chart have?
Pie charts work best with only a few categories—typically two to five—because viewers can easily compare each segment. With more than five categories, the slices become too thin to interpret accurately, and the chart loses effectiveness.
What should I put in the center of a donut chart?
A common approach is to place a single headline figure in the center, such as the total value the segments sum to, the largest category’s share, or a period-over-period change. Keep the center content minimal and sized to fit comfortably within the inner radius.
When should I use a 100% stacked bar instead of a regular stacked bar?
Use a 100% stacked bar when the emphasis is on proportional composition and you want to compare the relative makeup of datasets whose total magnitudes vary widely. It normalizes each bar to 100%, but it does not show actual totals, so use a regular stacked bar or a combination of charts if absolute values matter.
What kinds of data are treemaps best for?
Treemaps are best for dense datasets containing dozens of categories and several layers of subcategories. Their rectangles scale down more gracefully than slice-based charts and make the hierarchy self-evident because every child sits inside its parent.
How do I make part-to-whole charts accessible for people with color vision deficiency?
Use high visual contrast, choose hues that differ substantially in lightness as well as hue, and consider adding thin borders or pattern fills so segments carry both color and texture cues. The article notes that reds and greens, or certain blues and purples, can collapse into nearly identical tones for some viewers, so review charts with colorblindness simulation tools and ideally ask people with visual impairments to evaluate drafts.
What are common mistakes to avoid when visualizing part-to-whole data?
Avoid misapplied 3D effects, because depth and perspective distort proportions and make small slices hard to read; keep proportions flat. Also avoid overcrowding by grouping the smallest categories into a single “Other” segment rather than showing twenty categories at once.
Tony Astor
Tony writes about data visualization and the tools people use to build charts and dashboards. More about Data Illustrator