How to Visualize Flows and Movement
 By Tony Astor ·
How to Visualize Flows and Movement
Visualizing flows and movement uses chart types matched to what is being tracked: flow diagrams map fluid through pipes and processes, particle drift maps and vapor trail maps plot airborne dispersion, viscosity and fluid resistance charts compare flow rates against temperature, thermal current charts show convection loops, and absorption and inhalation route maps trace molecules into skin or through the nasal cavity to the brain.
Table of Contents
- Flow Diagram
- Particle Drift Map
- Viscosity Comparison
- Thermal Current Chart
- Energy Path Diagram
- Mist Pattern Chart
- Absorption Diagram
- Vapor Trail Map
- Flow Rate Chart
- Swirl Diagram
- Inhalation Route Map
- Circulation Line Chart
- Evaporation Wave Chart
- Density Layer Diagram
- Airflow Pathway Map
- Droplet Dispersion Chart
- Fluid Resistance Chart
- Dashboard
Flow Diagram
A flow diagram for a distillation and dispensing system maps the journey of carrier oil and essential oil from raw material to finished product. The diagram begins at the source, where carrier oil and essential oil are stored in separate tanks. Each tank is represented by a distinct symbol, and the fluid within is identified by a label and a color code. From the tanks, lines trace the path of each oil through piping to the distillation unit. The diagram shows the carrier oil entering the heating chamber, where it is brought to a specific temperature, while the essential oil follows a parallel path into the same chamber through a separate inlet.
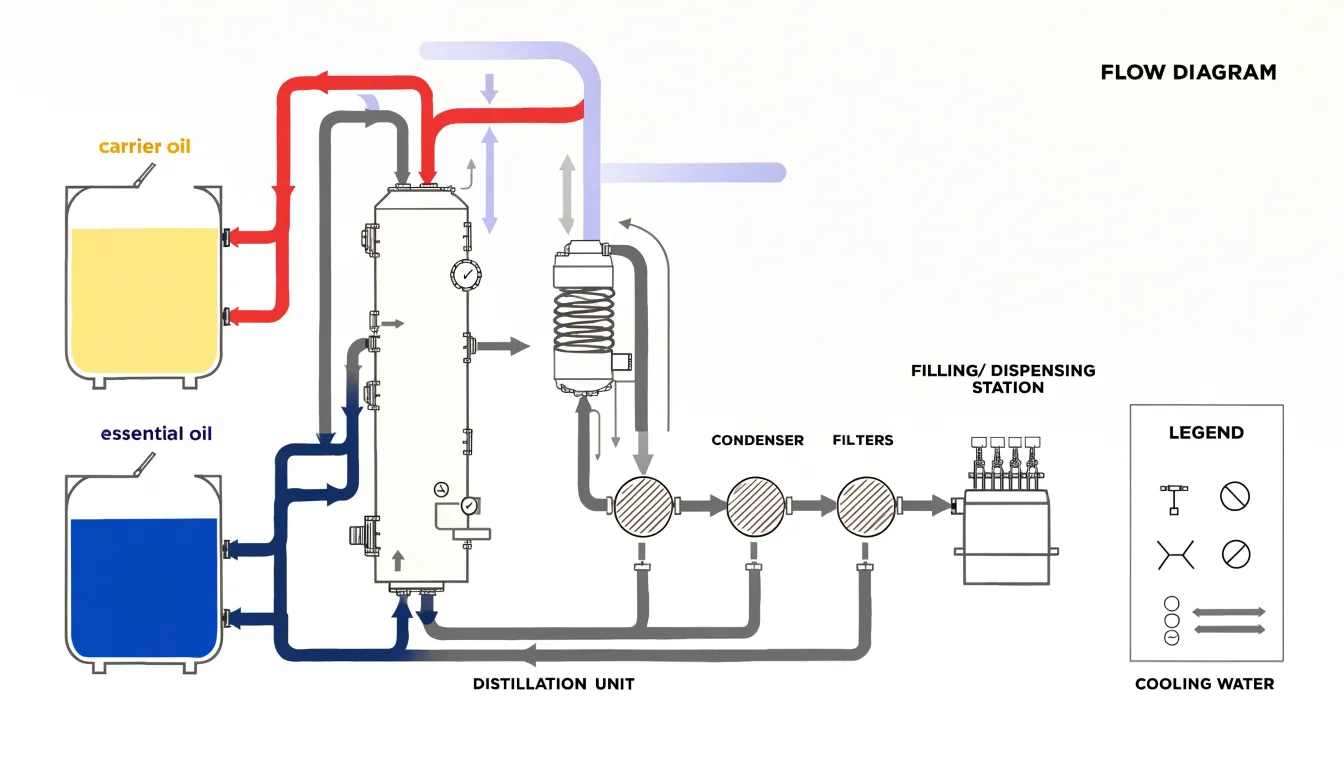
Inside the distillation unit, arrows indicate the direction of flow and the separation of volatile compounds from the carrier oil. Vapor lines lead from the top of the unit to a condenser, where cooling water flows in a countercurrent direction, shown by a second set of arrows. The condensed essential oil then travels to a collection vessel, while the remaining carrier oil exits from the bottom of the unit.
After distillation, the diagram traces the purified carrier oil and the collected essential oil through a series of filters, each marked with a pressure gauge symbol. The filtered oils then enter dispensing equipment, where the diagram depicts filling heads, nozzles, and containers. Flow rates are annotated at key points, such as liters per minute through the main line and milliliters per fill at the dispensing station. Valves are shown as circles with a line, and pumps as circles with a triangle. A legend explains each symbol and color, showing where the two oils combine or separate and where control points regulate their progress.
Particle Drift Map
A particle drift map visualizes how airborne volatile aromatic compounds move through an enclosed space over time. It works by releasing tracer particles or scent molecules at a known source point and recording their dispersion along the room’s existing air currents. Each particle’s path is plotted as a short trailing line or a sequence of dots, so the finished map reads as a field of directional streaks. Warm zones near radiators, cool drafts slipping under doors, and the gentle convection loops set up by body heat all leave their signature in the drift pattern.
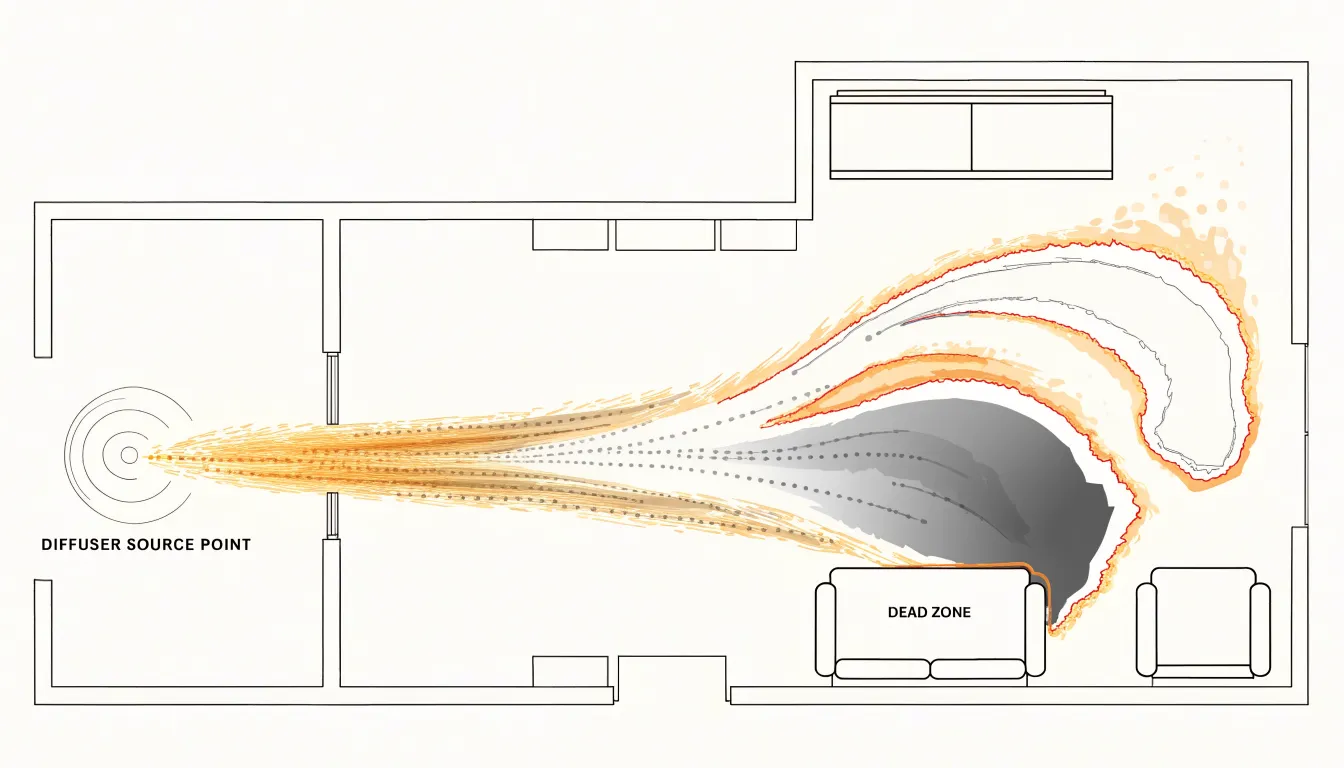
Building this map begins with a diffuse source, such as a reed diffuser or an ultrasonic nebulizer, releasing vapor steadily at a fixed location. Over the following minutes and hours, the concentration of scent at various points in the room is sampled, either with electronic sensors or through structured human sniff tests at marked grid positions. Those readings are interpolated into contour bands showing where the aroma lingers and where it thins out. The resulting picture typically shows a plume stretching along the dominant draft, with eddies curling into corners and dead zones forming behind furniture.
The practical value lies in coverage planning. A drift map shows whether a single diffuser placed near a doorway will reach the far side of an open-plan living area, or whether a second source is needed to fill a stagnant alcove. It also exposes seasonal changes: windows closed in winter create slow, stratified movement, while summer cross-ventilation can sweep a scent plume quickly across a room and out again. Designers use these maps to position sources where airflow naturally carries the fragrance, achieving even distribution without over-concentrating any one zone.
Viscosity Comparison
Viscosity is the internal friction of a fluid, explaining why some essential oils glide across a surface in seconds while others barely creep. Light citrus oils such as lemon, orange, and grapefruit consist almost entirely of small, mobile monoterpene molecules. These compact molecules slide past one another with little intermolecular attraction, giving the oils low viscosity and near water-like flow. A drop placed on a tilted glass spreads quickly into a thin film, and the same drop drawn into a pipette releases in a fast, steady stream.
Heavy resinous oils behave very differently. Vetiver oil is rich in long-chain sesquiterpenols and khusimol, while sandalwood oil contains large santalol molecules. Their greater molecular size and stronger intermolecular forces create substantially higher resistance to flow. Pour a drop of vetiver onto the same tilted glass and it moves slowly, holding a rounded bead shape rather than spreading into a film. Drawn into a pipette, it releases in a thick, sluggish thread, often clinging to the glass wall before falling.
A side-by-side viscosity comparison makes this contrast visible in a single frame. Place a drop of each oil at the top of an inclined surface and record with a fixed camera over a set interval, or time how long each takes to travel a marked distance. Because the difference in flow resistance is so large, the citrus drop will finish its run long before the resinous drop has cleared the starting line, showing how molecular structure translates into physical flow behavior.
Thermal Current Chart
A thermal current chart visualizes how heat energy translates into fluid motion as temperature gradients develop. When essential oils are warmed in a burner or added to a bath, the applied heat reduces the fluid’s density, setting up a buoyancy-driven flow. The chart maps this process by plotting velocity vectors or streamlines that show the fluid moving upward from the heat source, spreading outward, and eventually cooling and descending in a continuous convection loop.
In a burner, the heat source is localized—typically a small candle or electric coil beneath a dish—so the warmed oil mixture rises in a narrow plume, entraining surrounding air and creating a steady upward stream. The chart depicts this as a concentrated vertical flow with higher velocities near the center, tapering as the fluid mixes with cooler air above.
In a bath, the heat source is distributed along the bottom or throughout the water volume, making the convection pattern broader and more diffuse. Warm water near the heated surface rises while cooler water sinks to replace it, establishing a gentle circulation that the chart represents with curved streamlines and color gradients indicating temperature. By linking temperature change to velocity and direction, the chart shows how warming essential oils drives the upward movement of scent molecules and how the flow pattern evolves over time.
Energy Path Diagram
An energy path diagram captures the motion of a massage session as a spatial record, translating the practitioner’s hands into directional marks across the body’s topography. The diagram begins with a simplified outline of the client’s body, often rendered from a top-down or lateral perspective, onto which each stroke is drawn as an arrow or line. Application direction matters: a long effleurage stroke running from ankle to hip is drawn as a sweeping vector, while a circular friction movement at the shoulder appears as a spiral or loop. Pressure vectors add a second layer of information, typically shown through line thickness or graded shading, so that deep tissue work on the glutes reads differently from a feather-light finish across the face.
Oil distribution forms a third dimension. As aromatherapy blends are worked into the skin, the diagram marks zones of saturation, showing where oil was first applied, how it spread along the path of the strokes, and which muscle groups received the most concentrated coverage. This record helps practitioners review whether the blend reached the intended areas evenly or pooled in one region. Muscle groups are labeled so that the flow across the trapezius, erector spinae, or gastrocnemius can be traced as a continuous journey.
The diagram functions as both a documentation and planning tool. A therapist can compare sessions, noting changes in stroke direction or pressure emphasis over time, and spot gaps where a muscle group received little attention. When shared with clients, it offers a visual summary of where the work was concentrated and how movement traveled across the body.
Mist Pattern Chart
The mist pattern chart maps how ultrasonic mist spreads within small, enclosed spaces. Cold-water ultrasonic diffusers generate a fine, visible plume by vibrating a piezoelectric disc at high frequency, breaking water into microscopic droplets carried upward and outward by ambient air currents. Because these droplets are small enough to remain suspended for extended periods, the plume behaves like a slow-moving aerosol whose shape is heavily influenced by room geometry, furniture placement, and ventilation. The chart typically plots the plume as a translucent cone or fan that widens with height, showing where concentration is highest near the nozzle and where it thins toward the edges.
Dispersion radius is a second key variable. In still air, mist travels upward in a relatively narrow column before drifting outward under its own momentum and slight thermal gradients. A gentle cross-breeze, a nearby wall, or a partially open door can push the plume sideways and compress its vertical reach, producing asymmetric shapes. The chart layers these conditions as concentric rings or shaded gradients, each marking a boundary of visible mist density at a given distance from the device.
Humidity interaction adds a third dimension. As the diffuser raises local relative humidity, the surrounding air approaches saturation, and the plume becomes denser and more visible before dispersing. In already humid rooms, the mist may linger as a low-lying haze; in dry conditions, droplets evaporate quickly and the visible plume shortens. Combining plume geometry, radial spread, and humidity shading gives a compact account of how a diffuser’s output behaves in confined environments.
Absorption Diagram
An absorption diagram traces the journey of lipophilic scent molecules as they migrate from the skin’s surface into deeper tissue. The visualization begins at the outermost layer, the stratum corneum, a compact arrangement of flattened, keratin-rich cells embedded in a lipid matrix. Because many fragrance compounds are oil-soluble, they readily partition into this fatty environment. The diagram shows them gathering along the intercellular channels between corneocytes rather than forcing their way through the cells themselves. Arrows or gradient bands indicate downward travel from the surface, following the tortuous lipid pathways between the brick-like cells.
As the molecules descend, the diagram depicts the transition into the viable epidermis and the dermal layers beneath. Here the visual language changes to reflect a wetter, more aqueous environment, using color gradation to signal concentration dropping as the compounds spread and dilute. Capillary networks woven through the dermis offer a natural endpoint where absorbed molecules meet the bloodstream. Labeling the stratum corneum, epidermis, dermis, and lipid channels provides an anatomical map against which to read the flow.
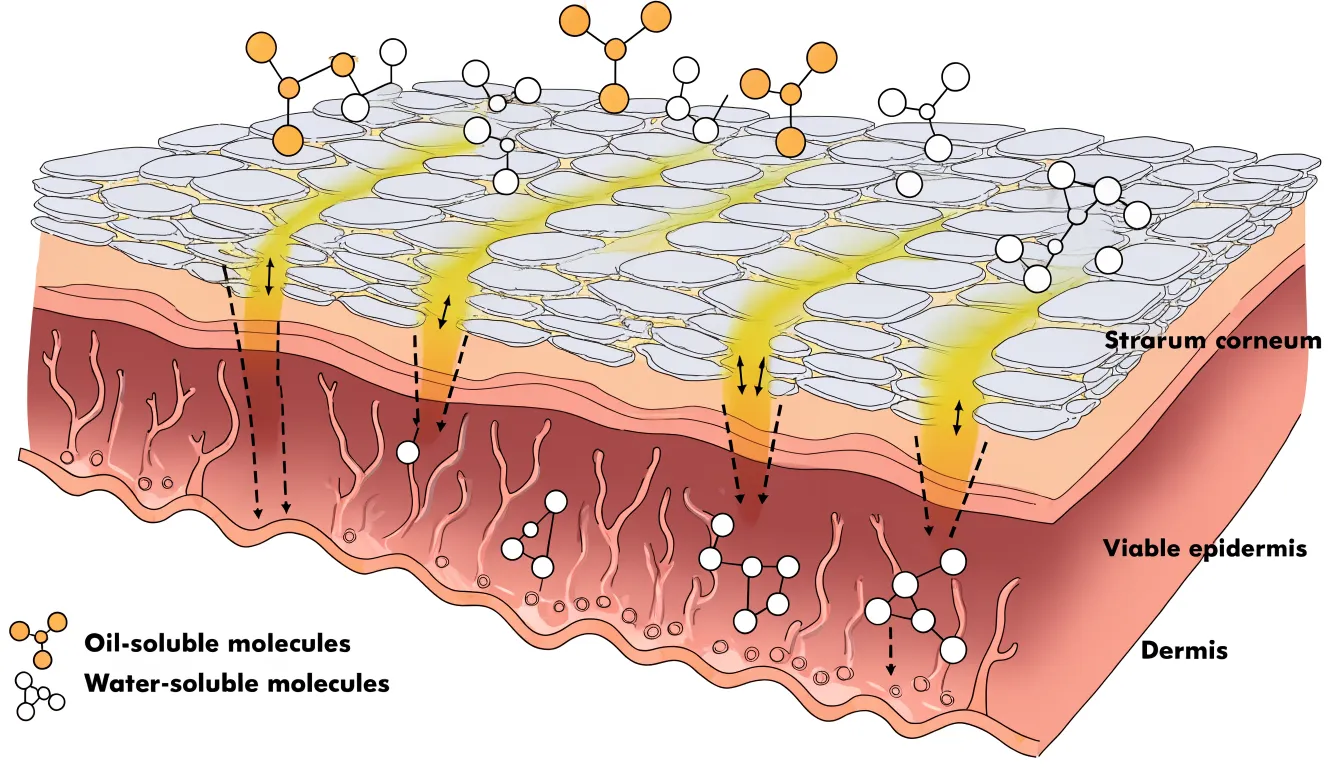
Effective absorption diagrams balance anatomical accuracy with clarity by simplifying the number of cell layers, exaggerating the width of intercellular channels, and using a consistent arrow style. A legend distinguishing oil-loving molecules from water-loving ones reinforces why certain ingredients penetrate while others remain on the surface.
Vapor Trail Map
A vapor trail map diagrams rising steam and the aromatic molecules it carries during a hot shower. When hot water strikes the shower floor or a bather’s skin, it transfers heat to the surrounding air and moisture droplets. This warm, humidified air is less dense than the cooler air around it, rising in a plume that gathers volatile aromatic molecules from soap, shampoo, essential oils, and skin. The map captures these currents by recording the paths steam follows over time, often using time-lapse photography, thermal imaging, or observation against a contrasting background.
The map reveals several distinct zones. Near the water source, a dense upward column forms where heat input is strongest. As the plume rises, it cools and spreads laterally, curling along the walls and ceiling before descending in cooler corners. Aromatic molecules concentrate in the rising core and disperse into eddies near the top of the enclosure. Bathers standing within the central plume encounter the highest concentration of volatiles, while those near the edges experience more diluted, intermittent exposure. The map also shows how door gaps, vents, and shower curtains redirect the flow, creating escape routes or trapping scent-laden air in pockets.
Reading a vapor trail map explains why certain scents seem stronger at head height, why aromas linger near the ceiling, and why opening a door can abruptly shift the aromatic field.
Flow Rate Chart
A flow rate chart maps the relationship between the aperture size of an orifice reducer and the resulting drip speed, providing a reference for controlling dosage precision. The chart plots orifice diameter on one axis against drop frequency, measured in drops per minute, on the other. As the aperture narrows, the flow rate falls in a predictable curve, making it possible to select a reducer size that matches a target dosage without trial and error.
The underlying mechanism is surface tension. At the outlet of a small orifice, liquid clings to the rim and swells into a droplet until its weight overcomes the surface tension holding it in place. A larger aperture releases that droplet sooner and produces a heavier drop, so drops form and fall more frequently. A smaller aperture lets surface tension retain the liquid longer, slowing the release. The chart captures this interaction as a continuous curve rather than a single fixed value, since the relationship between aperture and drop frequency is not strictly linear across all sizes.
For accurate dosage, the chart serves as a calibration tool. A technician can read the expected drop frequency for a given reducer top, compare it against measured output during a test run, and adjust the aperture choice accordingly. Because liquid viscosity and ambient temperature also influence surface tension, the chart works best when paired with a verification step under actual operating conditions.
Swirl Diagram
A swirl diagram captures the dynamic mixing that occurs when hydrophobic essential oils are stirred into an aqueous base. Curved streamlines trace the path of oil droplets as they are drawn into the vortex created by stirring. The streamlines loop and intertwine, illustrating how the oil phase breaks down into smaller droplets and disperses throughout the water.
This visualization highlights the turbulence and shear forces that drive emulsion formation, showing areas of high mixing intensity where droplets collide and coalesce. It also tracks how the mixing effect changes over time, from initial large swirls to finer, more uniform dispersion. This shows why vigorous stirring is needed to create a stable emulsion and how the oil eventually distributes evenly in the aqueous phase.
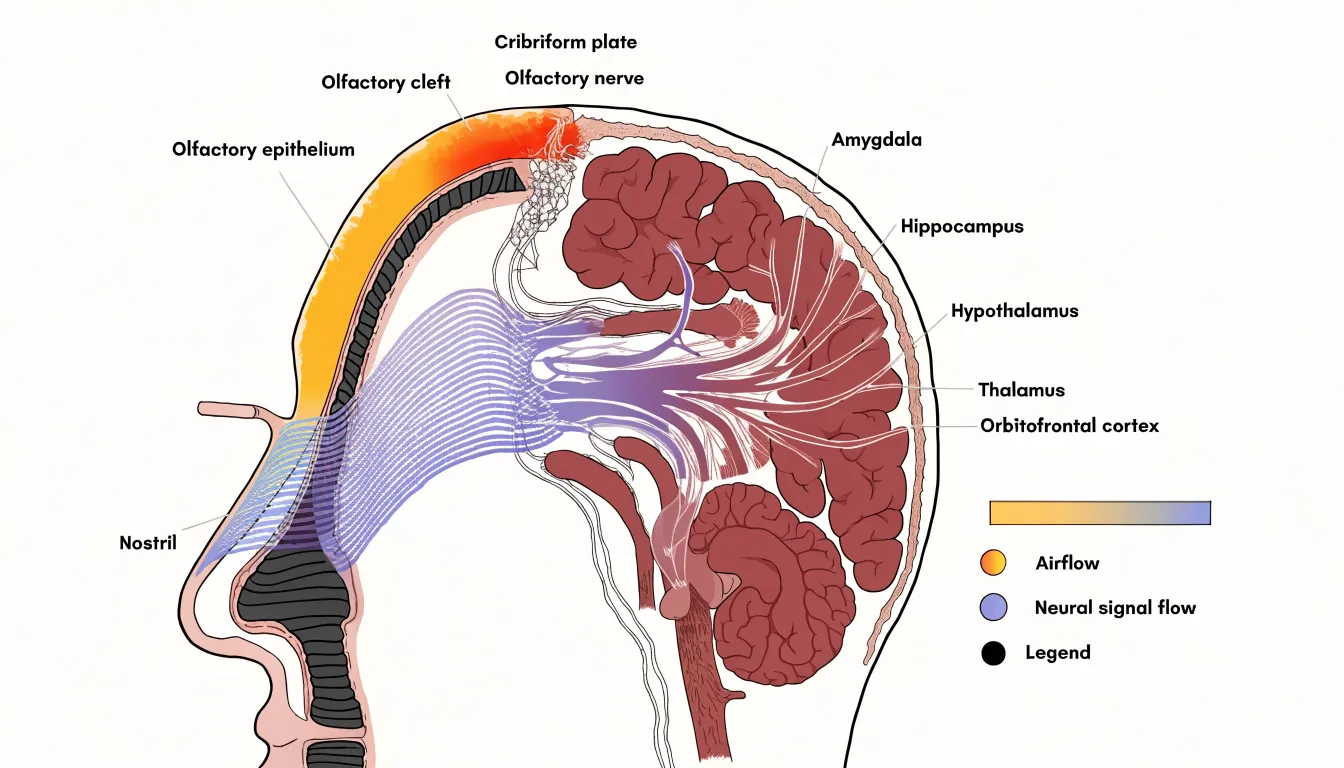
Inhalation Route Map
An inhalation route map traces the physical path that scent molecules follow from the surrounding air into the brain. The visualization begins at the nostrils, where an incoming breath draws in air carrying volatile compounds from food, flowers, smoke, or other sources. Arrows rendered in widening bands show how this air splits into two nasal passages and moves upward toward the olfactory cleft, a narrow region at the roof of the nasal cavity where the sensory epithelium sits. Along this route, the map annotates the filtering role of nasal hairs and mucus, which capture larger particles while allowing smaller volatile molecules to continue.
At the olfactory epithelium, the diagram shifts scale to show receptor neurons and their cilia, illustrating how individual molecules bind to specific receptor proteins. From there, the route continues along the olfactory nerve, drawn as a bundle of fine lines passing through the cribriform plate—the perforated bone at the base of the skull—to arrive at the olfactory bulb, where signals are sorted into glomeruli before traveling along the olfactory tract.
A key feature of this visualization is the branching into limbic destinations. Pathways diverge toward the amygdala, hippocampus, and hypothalamus, alongside routes to the thalamus and orbitofrontal cortex. This branching shows that smell signals reach emotional and memory centers before conscious processing areas, explaining why scents can trigger vivid recollections or strong feelings. Stage labels, directional arrows, a consistent color scale distinguishing airflow from neural signal flow, and a small cross-sectional anatomy inset keep the diagram legible.
Circulation Line Chart
A circulation line chart shows how specific massage strokes influence blood flow and lymphatic movement within the skin and underlying tissue. Effleurage, the long gliding stroke that opens and closes a massage sequence, applies broad, continuous pressure across the skin’s surface. This motion encourages blood to move through superficial capillaries and supports the return of venous blood toward the heart. On a line chart tracking circulation over time, effleurage typically appears as a gentle upward curve, reflecting a gradual increase in localized blood flow that builds with each pass and slowly settles once the stroke ends.
Petrissage introduces a different rhythm. This family of kneading, squeezing, and rolling techniques works deeper into muscle and connective tissue, compressing and releasing the tissue in rhythmic cycles. Mechanical pressure pushes fluid out of the intercellular spaces, and the release phase allows fresh blood to rush back in. Plotted on the same chart, petrissage often produces a more pronounced rise, sometimes with small peaks and dips mirroring the kneading rhythm. The alternating compression and release also stimulates lymphatic drainage, since lymph vessels rely on external pressure and movement to propel fluid.
Showing both strokes side by side makes their distinct signatures visible: effleurage reads as a smooth, sustained climb, while petrissage shows a sharper, oscillating pattern. Viewers can trace how each stroke affects microcirculation, watch how quickly the effects fade, and see how combining the two shapes the overall tissue response.
Evaporation Wave Chart
The evaporation wave chart tracks how a fragrance’s constituent notes volatilize at different rates after application. Top notes, typically composed of light, highly volatile molecules such as citrus, green, or aqueous accords, evaporate first to create the initial olfactory impression. Middle notes, often floral, fruity, or spicy, follow at a slower pace to form the heart of the composition. Base notes, usually low-volatility resins, woods, or musks, linger longest and anchor the dry-down. Plotting each note’s evaporation rate against time reveals a staggered sequence of peaks and troughs as the fragrance shifts from bright and fleeting to deep and persistent.
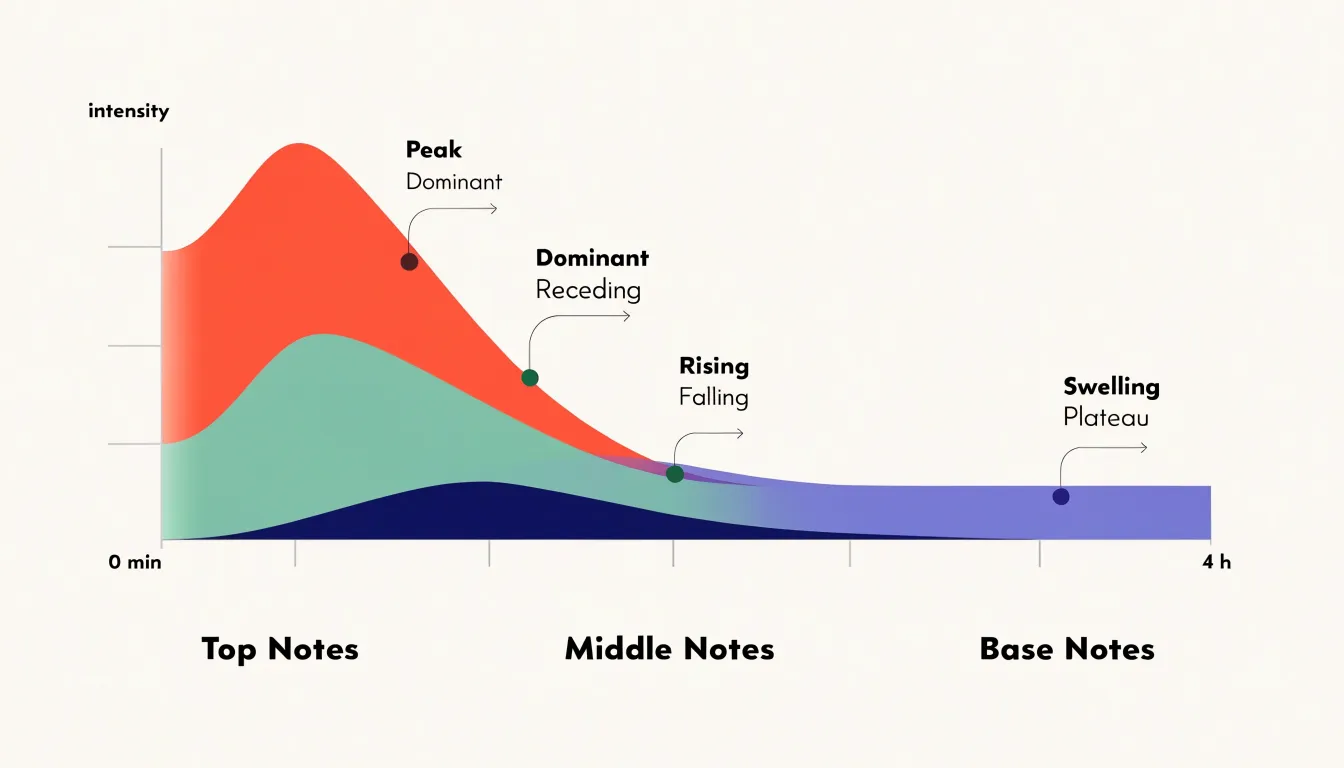
The chart can be constructed as overlapping curves or a stacked area graph, with time (from minutes to hours) on the x-axis and intensity or concentration on the y-axis. Each note category occupies a band that rises and falls according to its volatility profile. The top-note band crests early and recedes, while the base-note band swells gradually and plateaus, showing when a particular note dominates and how the overall balance evolves.
Perfumers, product developers, and educators use this chart to discuss a fragrance’s architecture, diagnose issues like a top note that fades too quickly or a base that overwhelms, and design release profiles for topical products. Applied to diffusion, the chart can also incorporate environmental factors like temperature and airflow, which accelerate evaporation and shift the timing of each wave.
Density Layer Diagram
The density layer diagram shows what happens when several pure botanical extracts meet inside a carrier oil. Each extract has its own specific gravity, and when left to settle, the liquids arrange themselves into distinct strata. Mapping density along one axis and time along the other lets a reader watch heavier extracts drift downward and lighter ones rise until they reach equilibrium.
The visualization plots each extract as a colored band whose thickness reflects its proportion in the blend, illustrating how those bands migrate. A viewer can compare a resinous extract that sinks quickly with a volatile citrus extract that hovers near the surface. Where two extracts share a similar specific gravity, their bands merge into a blended zone; where the gap is wide, a sharp boundary persists.
The carrier oil’s own density sets the reference point against which the extracts move. A lighter carrier allows certain extracts to settle more decisively, while a heavier one slows separation. The diagram can show this by adjusting the vertical scale or depicting the carrier as a background medium through which the extract bands travel, helping formulators anticipate which combinations will stay homogeneous and which will separate.
Airflow Pathway Map
An airflow pathway map uses strategically positioned diffusers to direct visible mist along a room’s natural air currents. Start by identifying the primary air sources and sinks—doors, windows, and HVAC vents—where pressure differences drive movement. Place a diffuser slightly to the side of an incoming vent or open window, rather than directly in the air jet, so the mist is drawn into the airstream as a tracer.
For rooms with multiple vents, place a diffuser near each supply vent to observe where mist streams converge, diverge, or create stagnant zones. Elevate diffusers to roughly breathing height or vent level, depending on what you want to study. Near doors, a diffuser placed low and to one side shows how air spills under the door or along the floor when it opens or closes. Near a window crack or open sash, a diffuser reveals infiltration or exfiltration patterns, especially when indoor and outdoor temperatures differ.
Position each diffuser so the mist is neither overwhelmed by strong currents nor left in dead air. Mapping these pathways helps identify poor ventilation, locate drafts, and optimize furniture or equipment placement to improve circulation.
Droplet Dispersion Chart
A droplet dispersion chart shows how a spray nozzle breaks liquid into droplets. When you press a spray bottle trigger, liquid is forced through a small orifice under pressure. The nozzle’s internal geometry—including the swirl chamber and exit hole diameter—determines whether the liquid emerges as a coherent stream or atomizes into a mist. The chart captures this by plotting droplet size on one axis against the relative quantity of droplets at each size on the other.
For homemade room sprays, particle size shapes both the sensory experience and practical behavior. Very fine droplets (roughly 10 to 50 microns) hang in the air longer and travel farther, creating a light mist that disperses quickly. Larger droplets (from around 100 microns upward) fall faster and wet nearby surfaces, which can spot furniture or fabrics. The chart shows where a bottle and nozzle combination lands along this spectrum.
The curve’s shape is equally informative. A narrow, tall curve indicates uniform atomization where most droplets cluster around a single size for predictable coverage. A broad, flat curve signals a mixed output of fine mist and heavier droplets. Makers experimenting with different nozzle heads, trigger pressures, or formulations containing alcohol, surfactants, or essential oils—which alter surface tension and viscosity—can compare curves side by side to tune a spray’s mist quality and settling behavior.
Fluid Resistance Chart
A fluid resistance chart plots flow rate against temperature to show how dropping temperatures thicken essential oils and slow their movement through pipettes, droppers, and narrow channels. As the curve bends downward toward the cold end of the axis, colder molecules lose kinetic energy, pack more closely together, and resist shear forces more strongly. The chart translates this viscosity change into a visual gradient, showing where an oil crosses from freely flowing to sluggish to nearly immobile.
Many botanical oils also contain trace waxes and naturally occurring compounds that crystallize as temperatures fall. On a resistance chart, this appears as an abrupt upward spike or plateau rather than a smooth curve, because solid crystals interrupt flow and raise resistance sharply. Citrus oils and other cold-sensitive extracts are especially prone to this effect, clouding the oil or clogging fine openings until warmed.
Overlaying several oils as separate curves allows immediate comparison: a robust carrier oil may stay fluid across a wide band, while a fragile floral extract turns resistant much sooner. Annotations marking crystallization onset or safe storage ranges make the chart a practical reference for handling, storing, or transporting aromatic liquids in cool conditions.
Dashboard
A dashboard serves as a consolidated summary matrix, bringing together fluid dynamics, vapor and gas movement, and anatomical or physiological flows into a single reference view. Readers can consult the matrix to see the full scope of visualization types at a glance and jump directly to the relevant chart.
Each entry identifies a specific chart alongside a brief descriptor of what it depicts. The fluid section might include river discharge diagrams, ocean current maps, and pipe network schematics; the vapor section gathers wind patterns, atmospheric circulation models, and plume dispersion charts; and the anatomical section covers blood flow through vessels or respiratory airflow.
Organizing these chart types into rows and columns reveals relationships across categories, allowing a reader interested in how direction and magnitude are encoded to compare fluid, vapor, and anatomical examples side by side. The dashboard works best when each entry includes a thumbnail or icon, a short label, and a hyperlink to the full visualization, serving both first-time readers seeking orientation and returning users looking for a specific reference.
Frequently Asked Questions
What is a particle drift map used for?
A particle drift map visualizes how airborne volatile aromatic compounds move through an enclosed space over time. It is useful for coverage planning, such as showing whether a single diffuser will reach the far side of an open-plan area or whether a second source is needed.
Why do citrus essential oils flow faster than vetiver or sandalwood oils?
Light citrus oils such as lemon, orange, and grapefruit consist mostly of small, mobile monoterpene molecules, giving them low viscosity and near water-like flow. Heavy resinous oils like vetiver and sandalwood contain larger molecules and stronger intermolecular forces, creating substantially higher resistance to flow.
How does an absorption diagram show scent molecules moving into the skin?
An absorption diagram traces lipophilic scent molecules from the stratum corneum along intercellular lipid channels between corneocytes, then into the viable epidermis and dermal layers. Capillary networks in the dermis are shown as a natural endpoint where absorbed molecules meet the bloodstream.
What does an evaporation wave chart show about fragrance notes?
An evaporation wave chart tracks how top, middle, and base notes volatilize at different rates after application. Top notes evaporate first, middle notes follow more slowly, and base notes linger longest, often shown as overlapping curves or a stacked area graph.
How does a flow rate chart help control drip speed?
A flow rate chart plots orifice diameter against drop frequency in drops per minute. As the aperture narrows, the flow rate falls in a predictable curve, helping select a reducer size that matches a target dosage without trial and error.
What path does an inhalation route map trace from scent molecules to the brain?
An inhalation route map begins at the nostrils and follows air upward to the olfactory cleft and olfactory epithelium, where molecules bind to receptor proteins. From there, signals travel along the olfactory nerve through the cribriform plate to the olfactory bulb and then branch toward limbic destinations such as the amygdala, hippocampus, and hypothalamus.
Tony Astor
Tony writes about data visualization and the tools people use to build charts and dashboards. More about Data Illustrator