How to Visualize Change Over Time
 By Tony Astor ·
How to Visualize Change Over Time
Visualizing change over time means turning repeated records into charts so trends become visible: line graphs track daily ratings and rolling averages, bar charts compare outcomes across trials, calendar heatmaps reveal weekly patterns and gaps, photo timelines document gradual physical shifts, and rating scales convert subjective states into measurable data. Consistent scales, dates, and formats keep comparisons valid.
Table of Contents
Line Graphs
Line graphs turn a scattered log of daily mood and energy ratings into a readable record of your emotional baseline. The process begins with a simple rating scale applied each day, commonly a one-to-ten scale for mood and another for energy, recorded at roughly the same time to keep the data comparable. Those daily scores become the data points along the vertical axis, while the horizontal axis holds time, progressing from the first day of tracking through the following months. Plotting mood as one continuous line and energy as a second line on the same chart lets you see how the two measures move together or drift apart across weeks and seasons.
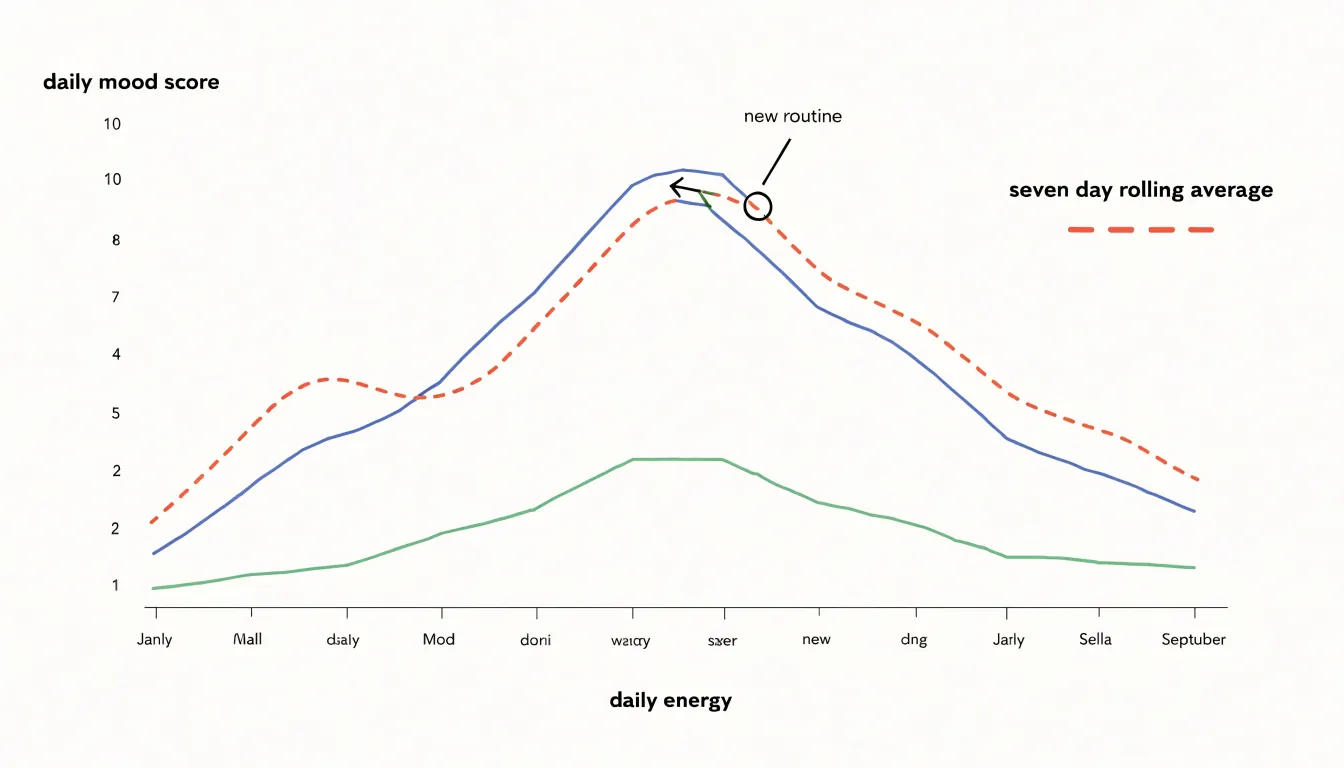
Daily ratings fluctuate widely, so individual points can look alarming or encouraging without meaning much. A rolling average, such as a seven-day or thirty-day mean, smooths that noise into a trend line that reveals the underlying baseline. Over months, the trend line may creep upward even when particular days are still difficult, and that slow movement is precisely the kind of change that is invisible in memory alone. Annotating the chart with events such as a new routine, a change in medication, or a stretch of poor sleep helps you interpret shifts in the line.
Continuous line charts also make patterns apparent that a table of numbers hides. You might notice recurring dips on certain weekdays, energy declining before mood, or a gradual rise in both measures following a sustained habit change. Because the line is continuous, gaps in data stand out as breaks, prompting you to fill them rather than overlook them.
Keep the scale and chart type consistent over time so comparisons remain valid. Reviewing the chart monthly, rather than daily, keeps attention on the baseline trend and supports informed decisions about routines, treatment, and lifestyle adjustments.
Bar Charts
Bar charts offer a direct way to compare blend recipes and dilution ratios when evaluating therapeutic outcomes. By placing bars side by side, each representing a specific combination of essential oil drop counts and carrier oil proportions, you create a visual record that makes differences in results immediately apparent. A practitioner testing several formulations can assign each recipe its own bar, with the height of the bar reflecting a measured outcome such as reported symptom relief, duration of effect, or client satisfaction scores. This arrangement allows patterns to emerge across the full set of trials rather than forcing reliance on memory or scattered notes.
The structure of a grouped bar chart is especially useful when multiple variables shift at once. One axis can hold the drop count, another the carrier ratio, while the bar height captures the therapeutic result. Clusters of bars then reveal which combinations consistently perform well and which fall short. For instance, a blend using three drops of lavender in a ten-milliliter carrier might produce a noticeably taller bar than the same drop count in a five-milliliter carrier, pointing to dilution as a meaningful factor. Over successive trials, these comparisons accumulate into practical guidance for future formulation work.
Color coding and consistent labeling strengthen the chart’s value. Assigning distinct colors to carrier types or drop ranges lets viewers track categories across the entire graph without confusion. Keeping scales uniform between charts ensures that comparisons remain valid when new recipes are added later. Maintained as an ongoing record, these bar charts transform informal experimentation into documented evidence, giving practitioners a reliable reference for selecting drop counts and dilution ratios that deliver the strongest therapeutic results.
Calendar Heatmaps
A calendar heatmap arranges every day of a period into a familiar grid of weeks and months, then colors each cell according to a value recorded on that day. Applied to something like household oil usage, this layout turns a long list of daily measurements into a single picture where patterns stand out immediately. Days of heavy consumption appear as dark squares, light days as pale ones, and the overall rhythm of the week becomes visible without any calculation. Because the grid follows the same structure as an ordinary wall calendar, readers can orient themselves quickly and compare one week or month against another by scanning across rows and columns.
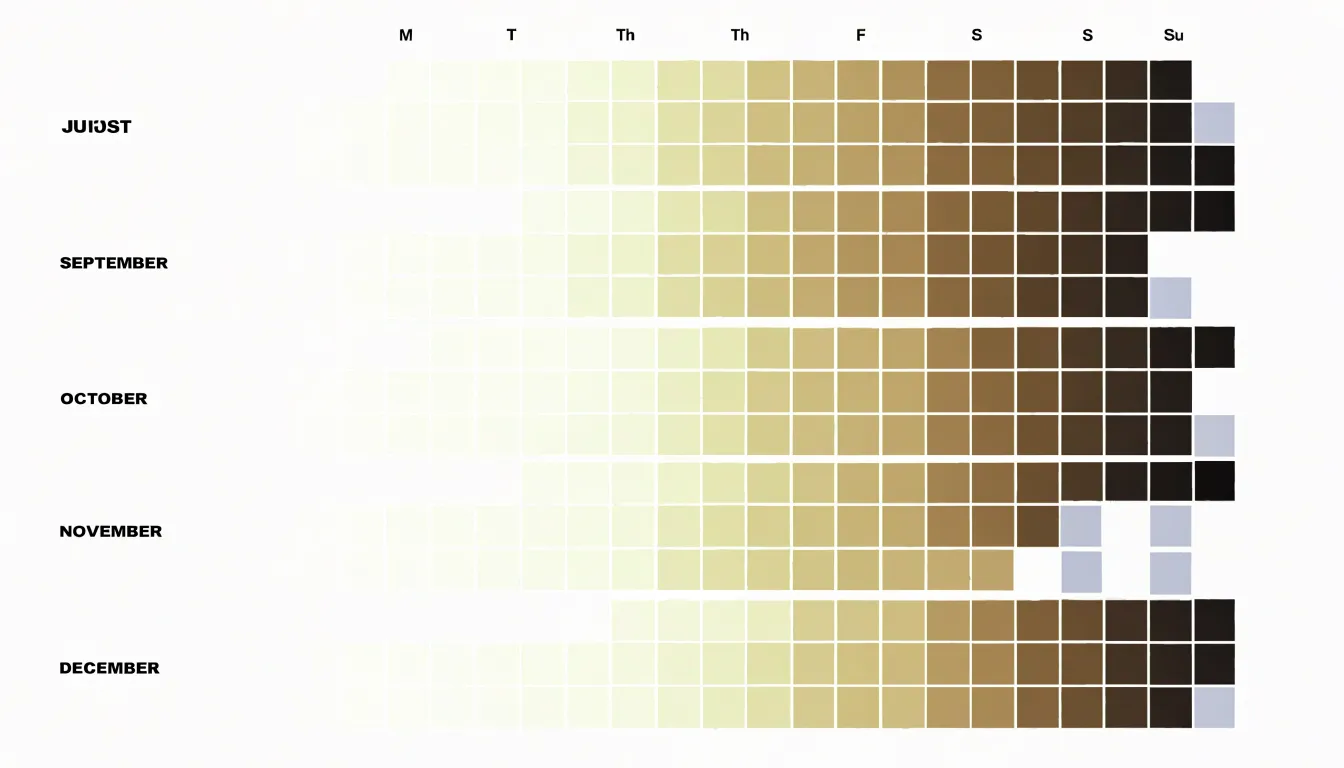
Consistency is one of the first things this format reveals. A routine that uses a steady amount of oil every day produces an evenly shaded band of cells, while a routine with occasional bursts shows clusters of dark squares separated by lighter stretches. Missing days stand out just as clearly, since a blank or neutral cell interrupts the pattern and signals a gap in the record. That visual signal is useful for distinguishing a genuinely low-usage day from a day when no measurement was taken at all.
Application frequency also becomes legible at a glance. If oil is used mainly for weekend cooking or weekly heating cycles, the heatmap will show repeating bands of color that align with those days. Over several months, these bands accumulate into a recognizable texture that makes the weekly routine easy to describe and compare. Readers can look at a single glance and see whether usage is spread evenly, concentrated on particular days, or drifting over time. This makes the calendar heatmap a compact diagnostic tool for spotting habits, verifying data completeness, and understanding how daily choices add up across a longer period.
Photo Timelines
Photo timelines provide a visual record of physical changes that words and numbers struggle to capture, particularly in areas like skin health where shifts are gradual and often subtle. To make these comparisons meaningful, consistency in how each photo is taken matters more than the quality of the camera. Establish a fixed setup: the same location, the same distance from the subject, and the same lighting conditions each time. Natural daylight from a consistent direction works well, since it reveals texture and redness without the harsh shadows or color shifts introduced by artificial bulbs. A tripod or a marked floor position helps keep framing identical across sessions.
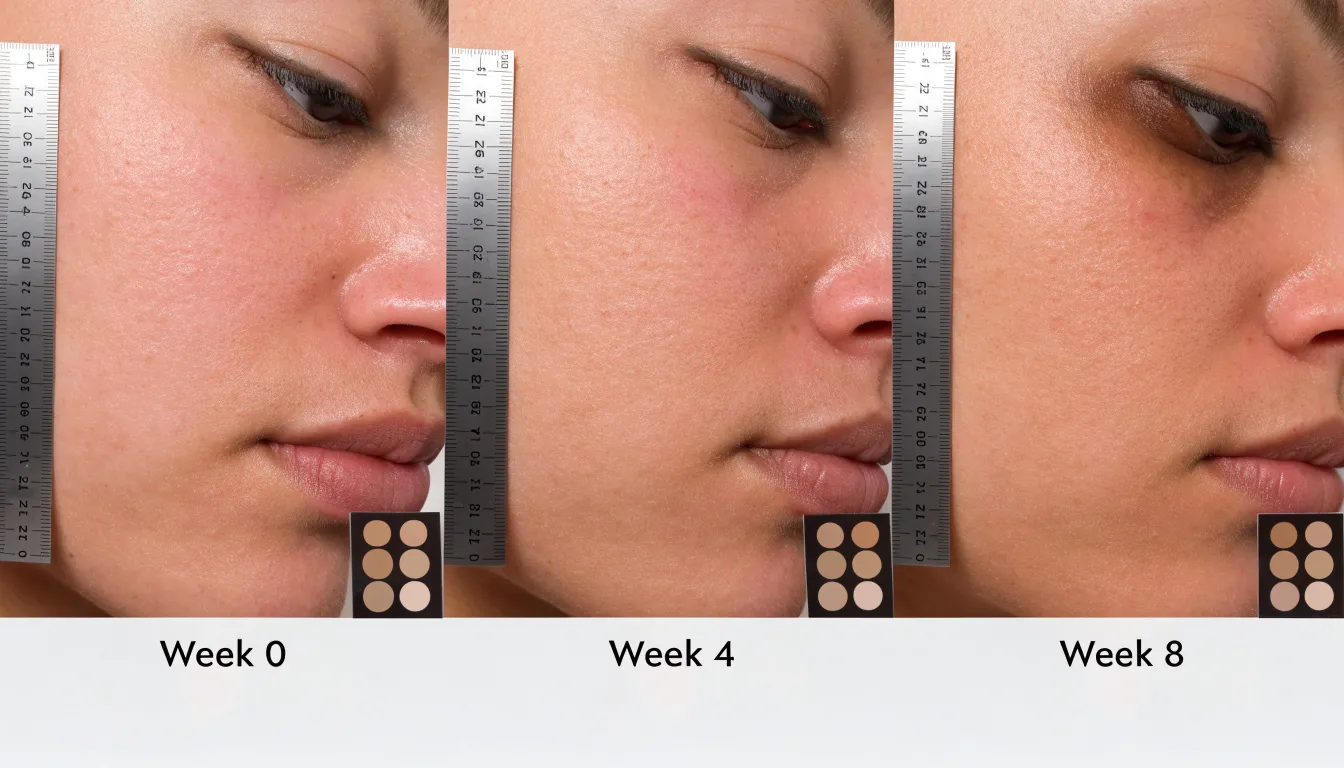
Standardize the timing of your captures. Shooting at roughly the same hour of day reduces variation from factors like morning puffiness or evening oiliness, and spacing photos at regular intervals (daily, weekly, or every few days) creates a reliable baseline for comparison. Before each shot, cleanse and dry the skin, and remove makeup so the surface is visible in its natural state. Include a small reference element, such as a ruler or a color card, within the frame to anchor scale and tone.
When tracking texture, redness, and topical healing, capture multiple angles and a close-up of the specific area of concern alongside a wider shot for context. Slight changes in angle or distance can make improvements appear exaggerated or invisible, so keep the framing mechanical rather than intuitive. Store the images with clear dates and consistent filenames, and review them side by side at matched zoom levels rather than flipping between them. Viewed as a sequence over weeks, subtle improvements in skin texture and fading redness become visible patterns, giving you dependable visual evidence of how a treatment is progressing.
Rating Scales
Subjective experience often holds the key to understanding subtle shifts in mental state, and rating scales provide a simple way to capture that data. By asking individuals to rate their stress and focus on a 1-to-10 scale before and after an aromatherapy session, you create a structured record of change over time. This approach transforms fleeting feelings into quantifiable metrics. For instance, a person might rate their anxiety as an 8 before inhaling lavender essential oil and a 4 afterward, or note an increase in mental clarity from a 3 to a 7. Collected consistently, these numerical snapshots allow you to track patterns across days, weeks, or multiple sessions.
The key is to establish clear definitions for each point on the scale, ensuring that a 1 consistently means “minimal stress” or “complete lack of focus” and a 10 means “extreme stress” or “laser-like focus.” When visualized, such data can take the form of line graphs showing individual trajectories, bar charts comparing group averages, or scatter plots revealing correlations between stress reduction and focus improvement. Over time, these ratings can highlight trends such as a gradual decrease in baseline anxiety or an increasing ability to concentrate during sessions.
Moreover, the act of self-rating encourages mindfulness, as participants become more attuned to their internal states. To enhance reliability, collect ratings at consistent intervals and use the same scale definitions throughout. This method is particularly valuable in aromatherapy research and personal practice, where objective measures of mental state are limited.
Sleep Charts
Sleep charts offer a structured way to map nighttime scent blends against rest quality. The core idea is to combine two streams of data: the metrics captured by a sleep tracker, such as total sleep time, time spent in deep and REM stages, wake-after-sleep-onset, and resting heart rate, and the logs you keep of which diffuser blend ran on which night. Plotted on a shared timeline, these two layers reveal patterns that are invisible when each is viewed alone. A floral blend of lavender and chamomile might line up with longer stretches of uninterrupted sleep, while a woody combination of cedarwood and sandalwood could correspond with a lower resting heart rate through the night. By charting each night as a point or a bar and layering the scent used above it, you create a visual bridge between what you smelled and how you slept.
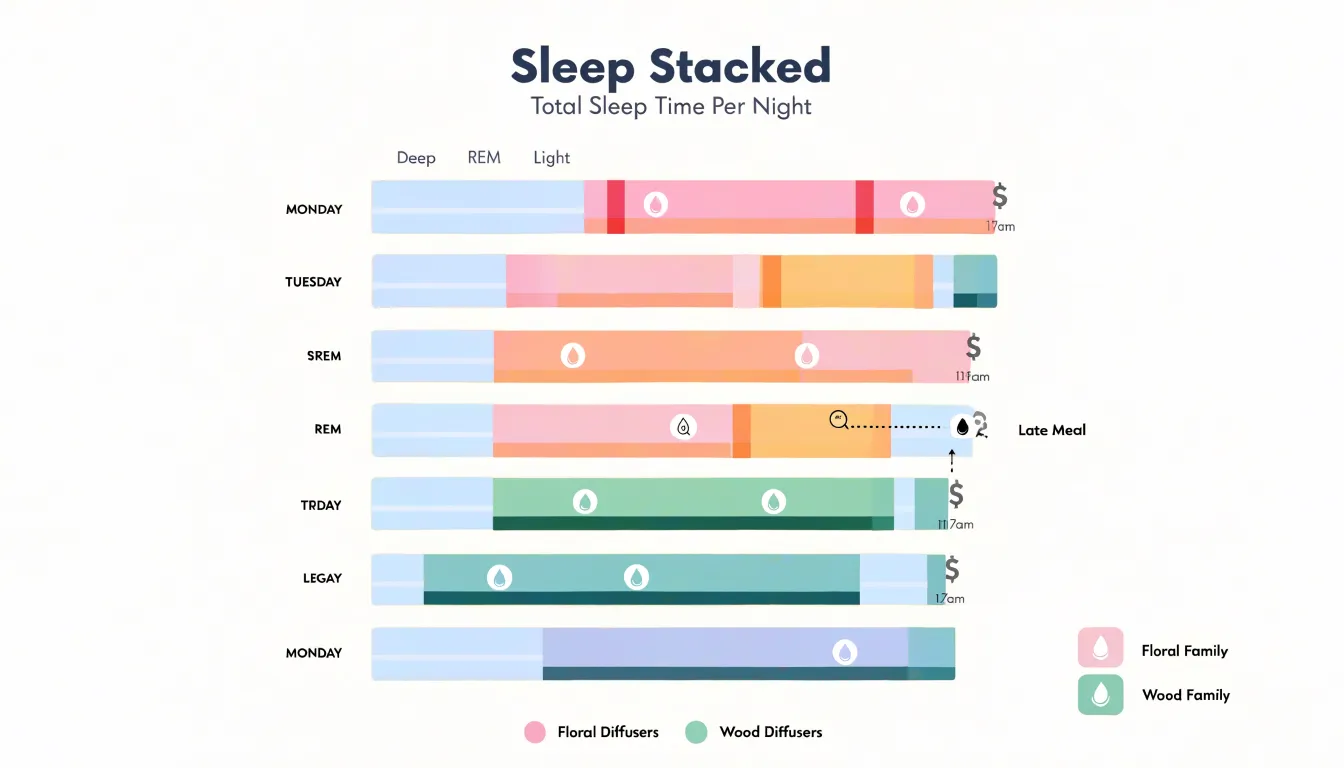
The chart becomes more useful as the dataset grows. A few nights tell you little, but several weeks of tracking can expose recurring correlations, such as whether citrus-forward blends consistently precede more awakenings or whether vetiver-heavy nights trend toward steadier deep sleep. Color-coding by scent family, with florals in one hue and woods in another, makes those clusters easy to spot. Annotations help too: note caffeine intake, late meals, or unusual stress so the chart doesn’t misattribute a poor night to a scent that was simply present during a difficult day. Over time, the sleep chart turns subjective impressions of restfulness into something measurable, giving you a practical basis for refining your diffuser routine toward the blends that genuinely support deeper, more restorative rest.
Skin Progress Charts
Skin progress charts pair the standardized photography of a photo timeline with a weekly check-in log, recording written observations alongside images of the same facial regions.
For anyone testing topical oils such as tea tree or frankincense, this log provides the evidence needed to judge whether a product is helping. Tea tree oil is often applied to target blemishes and inflamed areas, while frankincense is frequently used for overall tone and texture. Each has a distinct intended effect, so the log should track the specific dermatological responses that correspond to each oil: the size and redness of individual blemishes for tea tree, and smoothness, hydration, or brightness for frankincense. Recording these markers separately prevents one oil’s results from being credited to another and makes it easier to identify which product is producing which outcome.
A weekly cadence strikes a practical balance. It gives the skin enough time to show measurable change while remaining frequent enough to catch delayed reactions, such as irritation or purging, before they escalate. Adding brief notes on application frequency, dilution, and lifestyle factors like sleep or diet helps explain unexpected results when reviewing the chart later to decide whether to continue, adjust, or discontinue a given oil.
Seasonal Comparisons
Seasonal comparisons turn your oil selection into a proactive practice rather than a fixed routine. Weather patterns shift gradually across the calendar, and the oils that serve your skin well in one season may feel inadequate or heavy in another. By tracking year-over-year data, you build a personal record of how your skin responds to winter dryness, spring allergies, and summer conditions, then use that record to adjust your choices before problems arise.
Winter data often reveals a pattern of increased tightness and flaking as humidity drops and indoor heating strips moisture from the air. Comparing this season across multiple years shows whether your skin consistently needs heavier, more occlusive oils during these months, or whether a lighter layer paired with a humidifier solves the issue. Spring introduces a different variable through pollen and rising temperatures. Year-over-year notes can show whether your skin becomes reactive or congested during allergy season, which points toward gentler, non-comedogenic oils that soothe without clogging pores. Summer data typically highlights lighter textures and higher sebum production, guiding you toward fast-absorbing oils that protect without feeling greasy under sunscreen.
A single season offers limited information, while repeated observations reveal trends: which months demand richer formulas, when to transition to lighter oils, and how quickly your skin adapts to changing weather. Keeping a simple log of dates, conditions, and skin responses transforms guesswork into a reliable seasonal calendar. Over time, these comparisons let you anticipate shifts and stock your routine accordingly, so your oil selection evolves with the weather instead of reacting after discomfort appears.
Milestone Timelines
Milestone timelines offer a structured way to honor the moments when calmness begins to take root in a person’s life. Rather than treating stress reduction as an abstract or ongoing goal, plotting specific breakthroughs along an interactive timeline gives those achievements a fixed place in memory and makes progress visible. A milestone might be the first week of consistent morning meditation, the day a breathing exercise stopped a panic spiral, or the evening someone finally set a boundary around work messages. Each of these points deserves to be marked, because each one represents a real shift in how a person meets stress.
Users can scroll through months or years on an interactive timeline, click on individual markers, and revisit notes, dates, or reflections attached to each accomplishment. This interactivity allows people to see whether breakthroughs cluster around certain seasons, or whether a particular technique repeatedly appears at moments of calm. Seeing the arc of progress laid out visually can be deeply reassuring during difficult periods, when it is easy to forget that calmer days existed.
Celebrating these points also reinforces the behavior that produced them. When a wellness breakthrough is plotted as a milestone, it becomes something to look back on with pride and something to build toward in the future. The timeline can include small wins alongside larger turning points, creating a fuller picture of resilience. Over time, the accumulated markers serve as evidence that stress reduction is achievable and repeatable, supporting motivation and encouraging reflection.
Plateau Charts
A plateau chart displays your results over time as a flat line after an initial period of improvement, and learning to read it accurately is one of the most practical skills in an essential oil practice. Early on, a new oil or blend often produces noticeable shifts: better sleep, calmer evenings, easier focus. Those gains show up as a rising line on your tracking chart. At some point, many people notice the line stops climbing and levels out, even though nothing about their routine has changed. That flat stretch is the plateau, and it carries useful information rather than signaling failure.
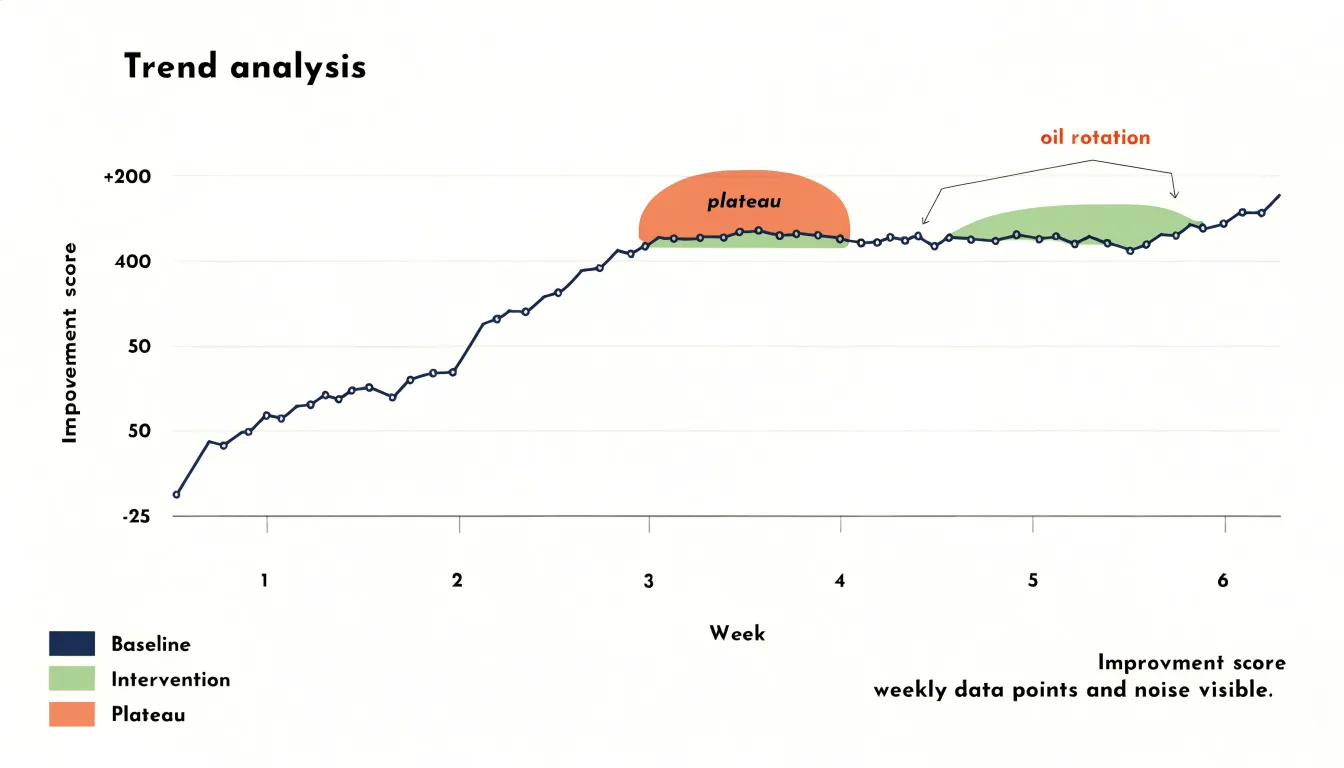
In aromatherapy terms, a plateau frequently reflects olfactory desensitization. The olfactory system adapts to repeated, familiar scents, so the same oil used daily can gradually register less strongly, both in scent intensity and in perceived effect. Your chart captures this adaptation objectively: you can see the week the improvements stopped accumulating. Charting also separates genuine plateaus from ordinary week-to-week noise, since a true leveling off persists across several data points rather than one slow day.
Once you identify a plateau, the chart itself suggests the next step. Common approaches include rotating to a different oil with a complementary profile, taking a short break from a blend, or alternating between two oils on a schedule. Recording each rotation on the same chart lets you see whether the change restores upward movement or produces a fresh plateau, building a personal record of which oils work best in sequence.
Treat the plateau as a checkpoint. It tells you when a routine has delivered what it can and when rotation, rather than repetition, will serve you best.
Habit Dashboards
A habit dashboard brings the scattered details of an essential oil practice onto a single page, so that diffusion sessions, topical applications, and symptom observations sit side by side in one view. Rather than flipping between separate notebooks, apps, or memory, the practitioner opens one layout and immediately sees the full picture of their routine. The dashboard typically organizes information into distinct zones: a diffusion panel listing which oils were diffused, when, and for how long; a topical section recording which blends were applied, to which areas of the body, and at what dilution; and a symptom log capturing subjective notes such as sleep quality, tension levels, or mood at various points in the day. Arranging these panels together makes a diffuser running every evening for a week, paired with a symptom log showing improved wind-down, an observable sequence rather than a vague impression.
Centralizing the data also reduces the friction that causes tracking habits to collapse. When logging requires opening multiple tools or hunting for a pen, entries get skipped. A single-page layout, whether kept in a printed planner, a whiteboard, or a spreadsheet, lets a person record a diffusion session and a topical application in the same motion. Color coding or simple checkboxes can further streamline the process, turning the dashboard into a quick daily ritual of a few seconds rather than a chore.
Looking across weeks of entries in this aggregated view, a practitioner can compare periods of consistent diffusion against symptom notes, or correlate a new topical blend with changes in comfort. Because the dashboard holds everything in one place, these comparisons emerge naturally from the layout itself.
Data Cleanup
Most change-over-time projects begin with information scattered across notebooks, phone reminders, spreadsheets, and half-finished lists: a quick line jotted during a meeting, a voice memo recorded on a commute, a date scribbled in the margin without a year. Before any of this can become a chart, it has to pass through a deliberate cleanup stage that turns quick scribbles into structured data, because a chart can only be as reliable as the records feeding it.
The first step is consolidation, gathering every note and reminder into a single working file so that nothing is lost or counted twice. From there, each entry needs a consistent date format, since charts plot against time and a date recorded as ‘3/4’ or ‘early March’ cannot be positioned on an axis without interpretation. Values require the same treatment: numbers written as words, units mixed between entries, or amounts recorded with approximations all need to be resolved into one agreed format. Missing entries deserve explicit handling as well, either filled in from a reliable source or marked clearly as gaps rather than quietly guessed. Duplicates are common when notes are taken in several places, so sorting and comparing entries helps remove repeated records that would otherwise distort a trend. A final pass checks that each row means the same thing as every other row, with consistent column headings and one category per field. The result is a tidy table where every date sits in its own column and every value is comparable.
Practitioner Reports
Practitioner reports serve as the bridge between the daily discipline of wellness logging and the clinical conversation that happens in a holistic health appointment. The core task is taking weeks or months of raw entries and condensing them into a clean, readable document that a practitioner can absorb in a few minutes. A well-structured PDF export typically opens with a compact summary panel showing average symptom intensity, frequency counts for key complaints, and the date range covered, followed by trend charts that plot each symptom against time. Supporting details, such as sleep duration, dietary notes, or medication changes, can appear as annotated markers along the timeline so the practitioner sees context alongside the symptom curve.
Printouts deserve the same care as digital files; choosing a consistent page layout, readable font sizes, and light gridlines keeps the focus on the data rather than on formatting quirks. Grouping symptoms by body system or category helps a practitioner scan for patterns, and a brief written summary at the top of each report can highlight the two or three observations the patient considers most important. Exporting on a regular cadence, such as monthly or in the week before an appointment, builds a consistent record over time and makes comparisons across visits straightforward. Keeping the export format stable from one report to the next lets a practitioner reviewing several months of history compare charts side by side without recalibrating, moving the appointment conversation quickly from basic history taking into interpretation and treatment planning.
Goal Adjustments
Goal adjustments grounded in historical charts turn aromatherapy planning into a responsive practice. Tracking outcomes over weeks or months reveals which blends consistently ease tension, which scents fade in effectiveness after repeated use, and which seasonal shifts alter client preferences. These trends provide the evidence needed to refine target metrics with confidence. A goal such as reducing reported stress by a certain margin becomes achievable when it is calibrated against past results, because the chart shows what previous interventions actually delivered. Without that record, targets remain guesses that either overreach or undershoot.
Blend recipes benefit from the same backward glance. A historical chart of batch performance might show that a lavender-heavy sleep blend worked well in cooler months but lost potency during humid stretches, prompting a measured adjustment to the carrier oil or the inclusion of a grounding note like cedarwood. These tweaks stay grounded in observed data, so each change can be traced to a documented trend and evaluated against the next round of results. Over time, the recipe evolves through small, tested revisions instead of wholesale reinvention.
Historical charts also reveal the pace of change, including plateaus where progress stalls and rebounds after a recipe adjustment. Knowing that a particular client took six weeks to report consistent improvement allows you to set a six-to-eight-week window for the next phase rather than an arbitrary deadline. The same evidence informs inventory planning and session frequency, keeping resources aligned with demonstrated demand so each planning cycle begins with a clear read of where things stood, what shifted, and which adjustments are most likely to move the metrics forward.
Frequently Asked Questions
How do I make a line graph to track mood and energy over time?
Use a one-to-ten scale for mood and another for energy, recorded at roughly the same time each day. Put daily scores on the vertical axis and time on the horizontal axis, plotting mood and energy as separate continuous lines, and use a rolling average such as a seven-day or thirty-day mean to smooth daily noise. Keep the scale and chart type consistent over time so comparisons remain valid.
What can a calendar heatmap reveal about daily oil usage?
A calendar heatmap arranges every day into a grid of weeks and months and colors each cell according to the value recorded that day, so heavy-use days appear dark and light days pale. It can reveal weekly rhythm, consistency, application frequency, and missing days, since blank or neutral cells interrupt the pattern.
How should I use a 1-to-10 rating scale to track stress and focus during aromatherapy?
Ask individuals to rate stress and focus on a 1-to-10 scale before and after an aromatherapy session, with clear definitions for each point on the scale. Collect ratings at consistent intervals and use the same scale definitions throughout, then visualize them as line graphs, bar charts, or scatter plots.
What should I keep consistent when taking progress photos for skin changes?
Keep the same location, distance, lighting, and roughly the same hour, and space photos at regular intervals; natural daylight from a consistent direction works well. Before each shot, cleanse and dry the skin and remove makeup, and include a small reference element such as a ruler or color card. Capture multiple angles plus a close-up of the area of concern and a wider shot, and store images with clear dates and consistent filenames.
How can I tell if a diffuser blend is affecting my sleep?
Combine sleep tracker metrics such as total sleep time, deep and REM stages, wake-after-sleep-onset, and resting heart rate with logs of which diffuser blend ran each night on a shared timeline. Several weeks of tracking, color-coding by scent family, and annotations for caffeine intake, late meals, or unusual stress can expose recurring correlations.
How often should I do skin progress check-ins when testing topical oils like tea tree or frankincense?
A weekly cadence strikes a practical balance: it gives the skin enough time to show measurable change while remaining frequent enough to catch delayed reactions, such as irritation or purging, before they escalate. Track blemish size and redness for tea tree, and smoothness, hydration, or brightness for frankincense, separately so one oil’s results are not credited to another.
Tony Astor
Tony writes about data visualization and the tools people use to build charts and dashboards. More about Data Illustrator