How to Use Color in Data Visualization
 By Tony Astor ·

How to Use Color in Data Visualization
Effective data visualization color use means matching palette type to data: sequential light-to-dark ramps for ordered values, diverging palettes with a neutral midpoint for data with a meaningful center, and distinct equal-luminance hues for categories. Prioritize luminance contrast over hue, keep palettes small and perceptually uniform, avoid rainbow schemes, meet WCAG contrast ratios of 3:1 for marks and 4.5:1 for text, and use colorblind-safe palettes like Viridis and Okabe-Ito.
Table of Contents
Visual Psychology
When a viewer looks at a chart, the human visual system begins by processing low-level features such as luminance and contrast. Luminance—the perceived brightness of a color—is processed more rapidly and automatically than hue. Because of this, light-to-dark gradients are naturally interpreted as ordered, quantitative scales. While contrast helps distinguish separate elements, variation in luminance conveys magnitude.
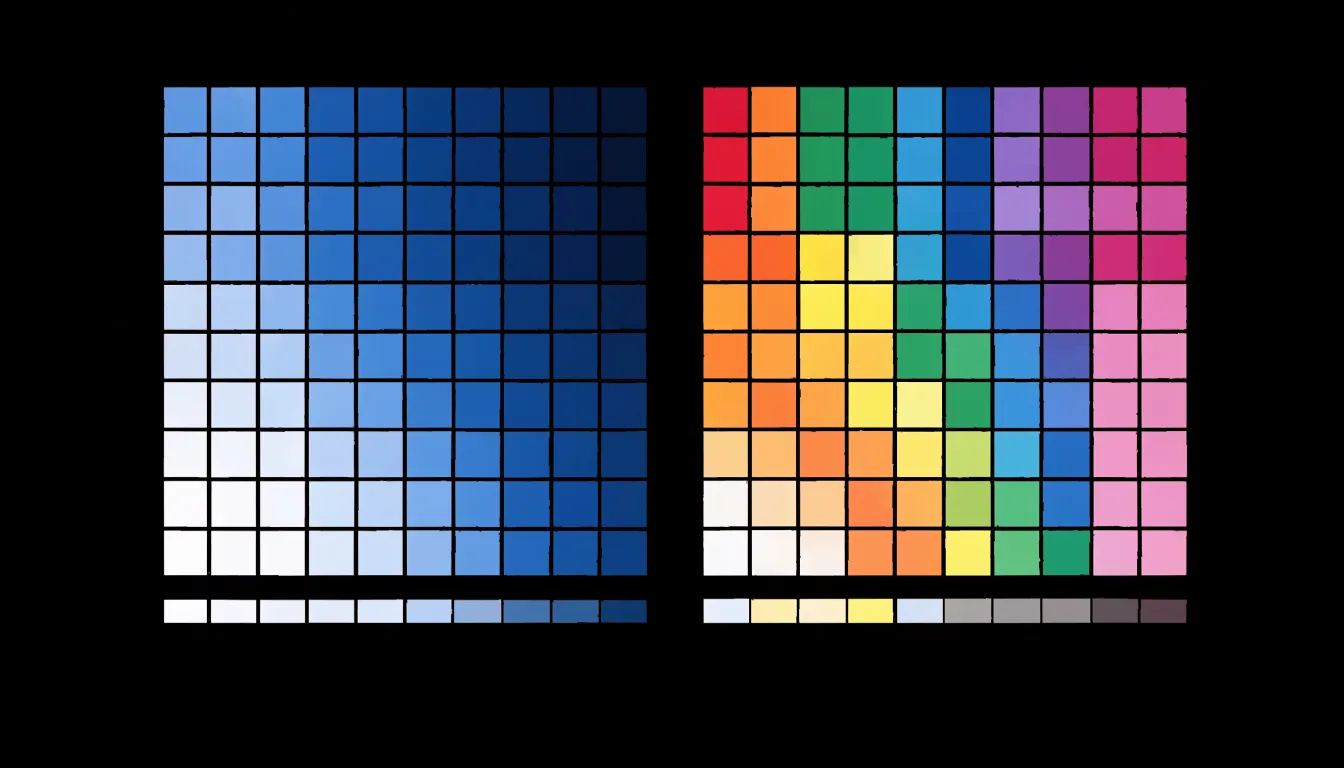
For example, a sequential colormap moving from pale yellow to deep blue maps low values to light shades and high values to dark shades. The brain interprets darker regions as “more” because darker areas often correspond to higher density or intensity in the natural world, such as shadows or concentrated substances. Luminance differences also create a sense of depth and salience, making high-value areas stand out.
In contrast, hue-based scales without luminance variation can be ambiguous because hue does not inherently convey order. Designers should prioritize luminance contrast when encoding quantitative information, ensuring that the gradient is monotonic in luminance to avoid perceptual reversals.
Sequential Palettes
Sequential palettes represent ordered numeric data by transitioning from light to dark. When selecting a sequential palette, you can choose between single-hue and multi-hue continuous ramps:
- Single-hue palettes use variations in lightness of one color, such as light blue to dark blue. This creates a clean gradient that shows magnitude without distracting color shifts.
- Multi-hue palettes blend two or more hues, such as yellow to green to blue, encoding a wider range of values while maintaining visual appeal. However, they require careful design to avoid perceptual artifacts.
A key best practice is ensuring perceptual uniformity, meaning equal steps in data values correspond to equal steps in perceived color difference. This prevents certain data ranges from appearing more important than others. Perceptually uniform palettes, like those based on the Lab color space, maintain consistent lightness and saturation changes.
When designing or selecting a sequential palette, convert it to grayscale to verify that the lightness progression is monotonic and data patterns remain visible. Also ensure sufficient contrast for readability on your target medium, whether screens or print.
Diverging Palettes
Diverging palettes are built around a neutral midpoint that separates two contrasting hues. They belong in charts whenever a dataset has a meaningful center from which values depart in two directions, such as variance from a sales target, profit-and-loss margins, or polar sentiment scores running from strongly negative to strongly positive. Because the central value carries conceptual weight, a light gray, off-white, or very pale tint at the midpoint works well; it recedes visually and lets both arms of the ramp stand out.
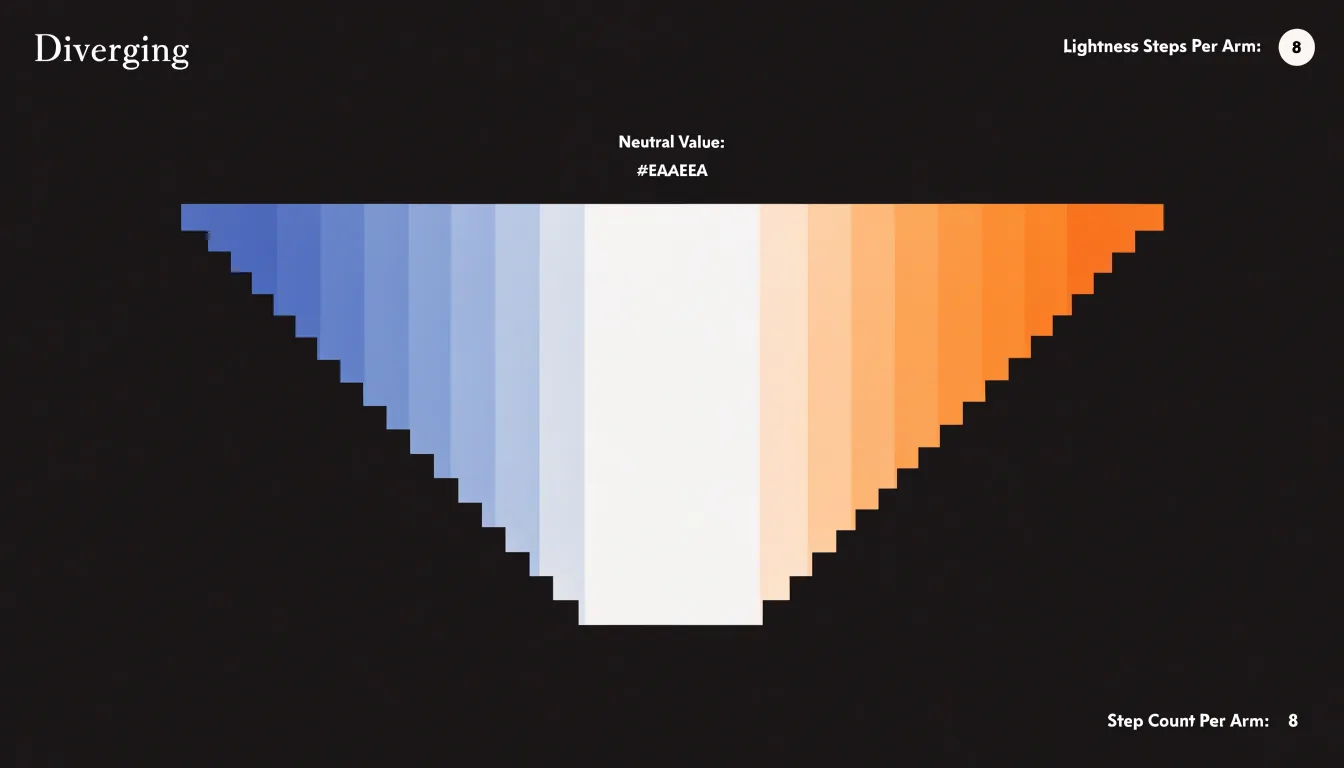
Next, select two hues that read as genuine opposites without clashing, such as blue and orange, teal and red, or purple and green. Each arm should step through several lightness levels, growing darker or more saturated as values move further from the midpoint. Keep the number of steps symmetrical on both sides so that positive and negative deviations of equal size look equally intense. Asymmetry in the ramp quietly distorts perception and leads viewers to over- or under-estimate one direction.
Diverging palettes also depend on a clear anchor:
- State the center value in the legend, and explicitly label uncentered midpoints on maps or charts so readers know where neutrality lies.
- Limit the palette to five to seven steps to keep distinctions legible.
- Test the hues for color-vision deficiency by checking that lightness differences carry the signal even when hue is indistinguishable.
Categorical Colors
When a chart presents qualitative categories such as regions, product types, or departments, the assigned colors carry meaning whether the designer intends it or not. A vivid red next to a muted gray reads as emphasis; a saturated hue beside a pale one suggests importance. Categorical palettes solve this by giving every group a distinct hue while holding luminance roughly constant, so the eye can tell categories apart without ranking them.
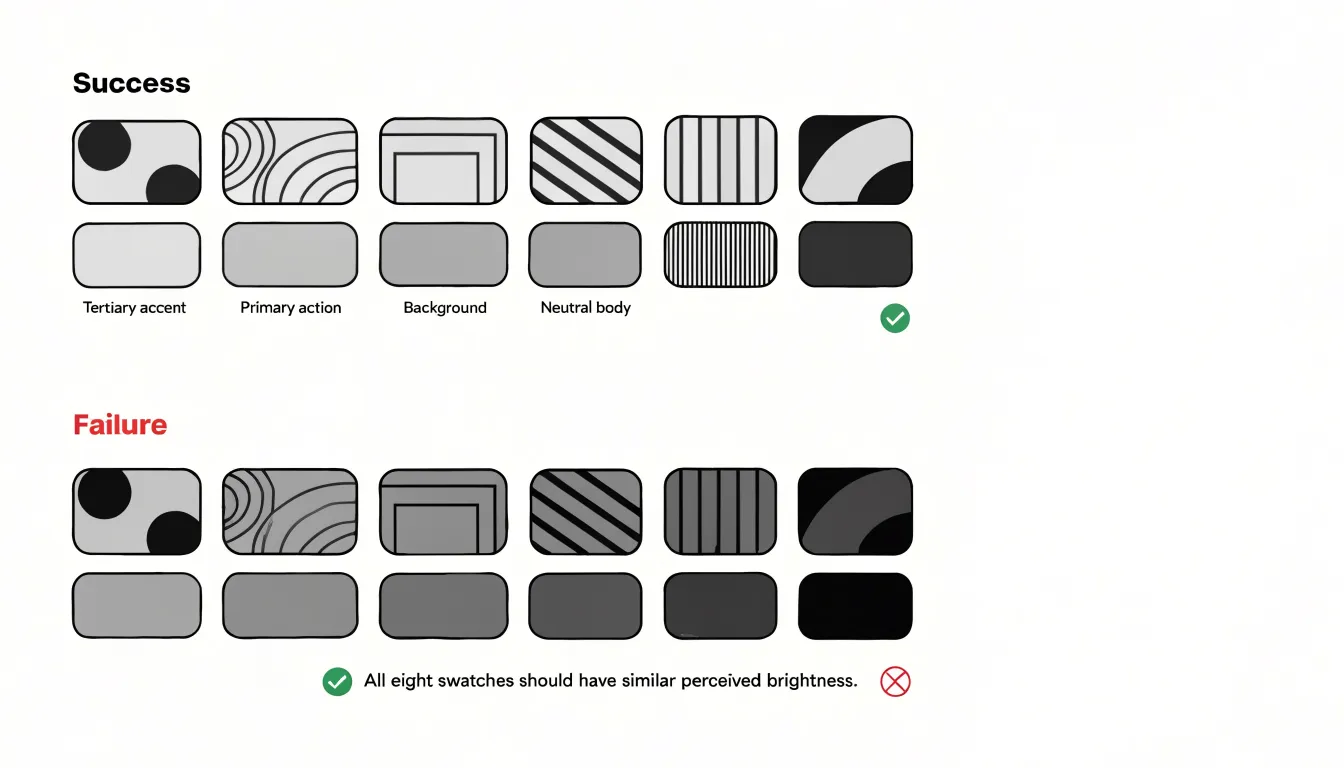
Start by selecting hues that sit far enough apart on the color wheel to be easily discriminated, typically spanning the spectrum rather than clustering in one region. Six to eight categories is a comfortable ceiling for most palettes; beyond that, colors become harder to distinguish and the chart benefits from grouping smaller categories together or switching to a different encoding. Adjust each hue in lightness and saturation until all share a similar perceived brightness. Testing in grayscale is a practical check: if one swatch looks dramatically darker than the others, it will attract disproportionate attention and should be recalibrated.
Ensure your chosen hues remain separable under colorblindness simulations, and keep category color assignments consistent across multiple charts in a report or dashboard.
Color Meaning and Culture
Color carries pre-conscious associations that can work for or against a chart’s message. Everyday colors carry meanings audiences have absorbed over a lifetime: red commonly signals alarm, danger, or loss; green suggests growth, safety, or approval; amber and yellow indicate caution; and blue conveys trust and stability. When a dashboard uses red for declining revenue or green for a rising trend line, the viewer grasps the story almost instantly without consulting a legend. This speed of comprehension is especially valuable in time-pressured contexts like executive reporting, public dashboards, and operational monitoring screens.
These associations are not universal, however. In many Western markets red is tied to financial loss, while in parts of East Asia red signals good fortune and celebration, making a red-down/green-up convention confusing or backward for some audiences. White, associated with cleanliness and simplicity in much of Europe and North America, is linked to mourning in parts of Asia and to purity in other traditions. Green has strong religious significance in some regions, which can make casual use in a chart feel insensitive or distracting. Even the red-amber-green traffic-light metaphor assumes familiarity with road conventions that are not shared everywhere.
Before finalizing a palette for an international or mixed audience, research how key colors are read in each target market. Where ambiguity is likely, pair color with a second visual cue—such as position, shape, or text labels— and add a short annotation to the palette. Testing the chart with representative viewers catches mismatches early.
Contrast Rules
When text and data marks lack sufficient contrast against their background, viewers struggle to distinguish elements, leading to misinterpretation and eye strain. The Web Content Accessibility Guidelines (WCAG) provide a reliable standard:
- Normal text: Aim for a contrast ratio of at least 4.5:1.
- Large text (18pt or 14pt bold): Aim for at least 3:1.
- Data marks (lines, bars, points): Maintain a minimum 3:1 ratio against the background.
Online tools and libraries can compute these ratios automatically using relative luminance. Because lightness differences drive perceived contrast, a dark blue and a light blue may share a hue but have vastly different luminance and legibility. Test your color choices against white, black, and mid-tone backgrounds.
Screen variability and lighting conditions further complicate contrast. Displays vary in brightness, contrast, and color calibration; viewers might read your visualization on a dimmed phone in bright sunlight or on an overexposed monitor. Sufficient contrast acts as a buffer against these extremes. Consider the impact of anti-aliasing and thin lines, which reduce effective contrast, and use solid fills or thicker strokes when contrast is borderline. Finally, evaluate marks in context: when data marks overlap or sit adjacent to other elements, they must remain distinguishable from each other, not just from the background.
Colorblind Accessibility
Roughly one in twelve men and one in two hundred women experience some form of color vision deficiency, meaning a chart relying on red versus green or blue versus purple will fail for a meaningful share of any audience. The most straightforward safeguard is choosing engineered palettes:
- Viridis colormaps remain perceptually uniform across the full range of color vision, progressing smoothly in lightness as well as hue so ordered values stay legible even when particular hues collapse together.
- Okabe-Ito offers a discrete set of eight colors selected specifically to remain distinguishable for readers with deuteranopia, protanopia, and tritanopia, making it a dependable default for categorical series.
When a chart must distinguish many categories or when colors sit side by side in a legend, double-encoding adds a second visual channel so identity survives even if hue does not:
- Scatter plots: Pair each color with a distinct marker shape, such as circles, squares, triangles, and crosses.
- Line charts: Vary the dash pattern of each line, or annotate lines directly with labels at their endpoints.
- Filled areas and bars: Use texture overlays such as hatching or dot patterns to separate adjacent categories.
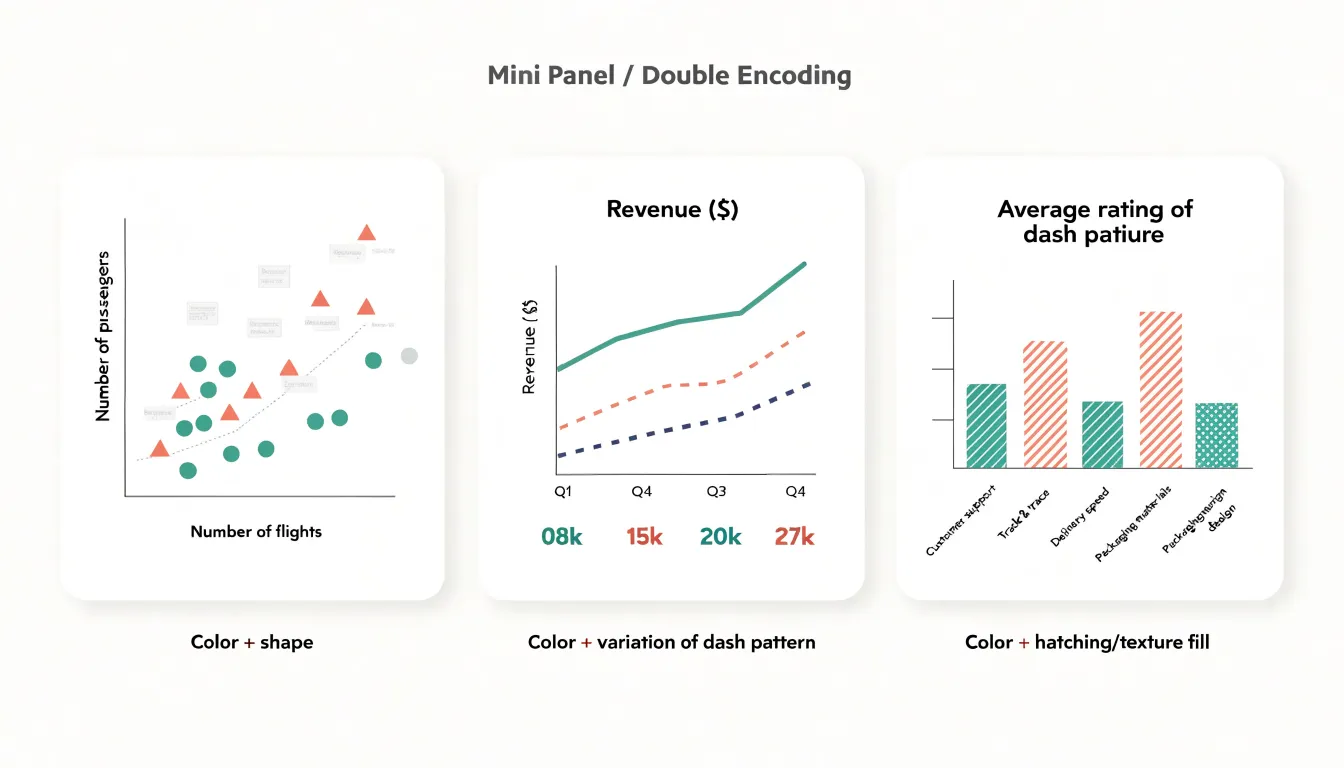
Always apply a colorblindness simulator to a finished chart to reveal collisions that look fine to a typical-vision designer, and check the chart in grayscale to confirm lightness differences carry the structure.
Minimal Palettes
In most visualizations, two or three core colors carry the entire message: one for the primary metric, one for a meaningful comparison or second series, and one neutral tone for context such as gridlines, axes, or background elements. Limiting the palette to this small set forces a designer to prioritize, since every additional hue competes for attention and slows decoding.
When a chart uses six or seven colors, readers must repeatedly consult the legend and mentally map each shade back to its meaning. With a compact palette, that mapping becomes instinctive after a single glance. A practical approach is to select one strong accent color for the headline series, a clearly distinct secondary tone for any supporting series, and a family of grays or muted neutrals for everything else. Because the color structure itself guides the eye, decorative elements such as arrows, callouts, borders, shadows, or gradient fills can be dropped.
Focal Colors
Focal colors establish a clear visual hierarchy by rendering most of the visual field in low-saturation grays, which recede into the background and communicate context. Against this muted backdrop, a single saturated hue stands out immediately because the human visual system is highly sensitive to differences in chroma and luminance. The eye is drawn to the accent color before any conscious reading of labels or axes takes place.
Assign the grayscale palette to baseline data—historical averages, comparison categories, or supporting series—and reserve the accent color for the specific points carrying the insight, such as an outlier breaking a long-standing pattern, a category diverging from its peers, or a trend line crossing a meaningful threshold.
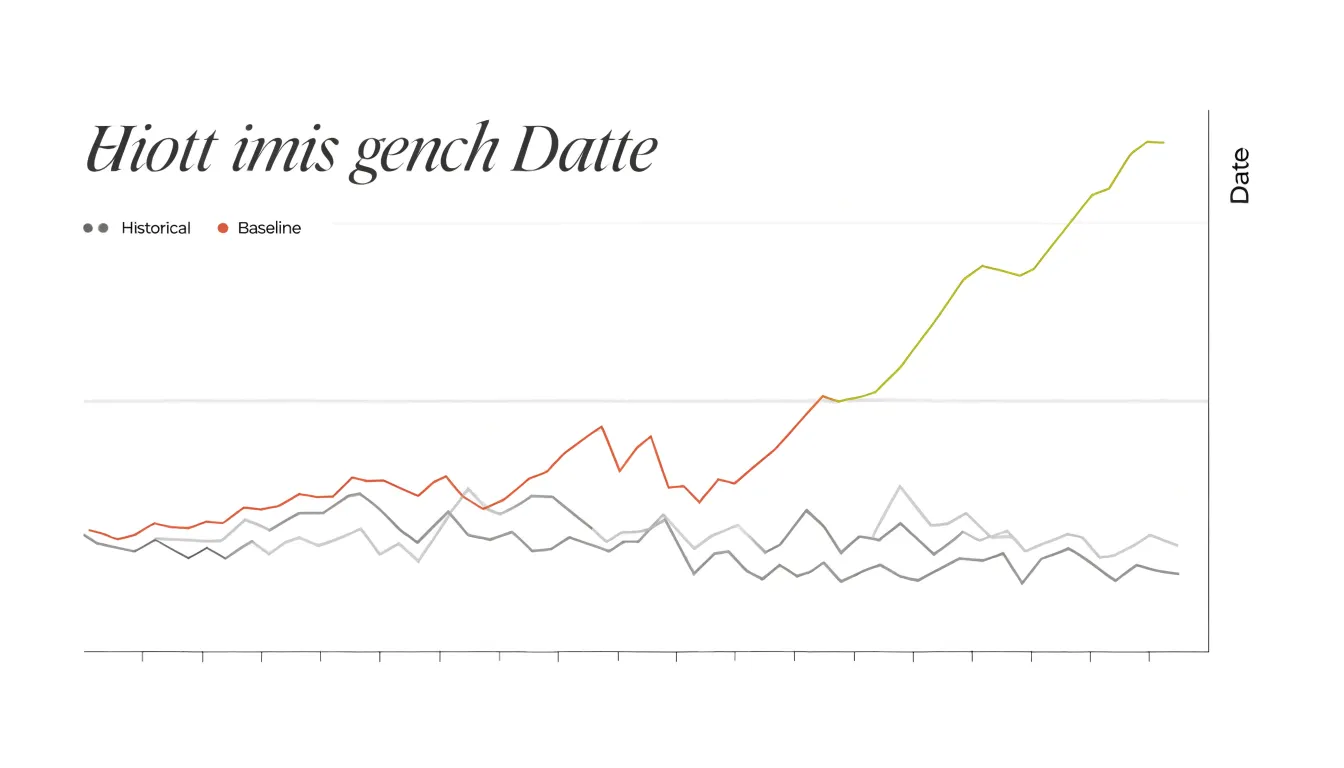
Each additional accent color dilutes the contrast that makes the first one effective, so most charts benefit from a single focal hue. If several elements genuinely deserve attention, consider splitting the chart into separate views. Ensure strong luminance contrast—a bright accent against dark grays, or a deep accent against light grays—so the focal point holds its position in the hierarchy for colorblind readers and in grayscale print.
Background Themes
Choosing between light and dark canvases starts with the viewing environment and display medium:
- Brightly lit offices or outdoor settings: A light background with dark marks maintains sufficient luminance contrast because the screen’s overall brightness competes with surrounding light. Light themes also tend to feel more approachable and print-friendly for dashboards used intermittently.
- Dim rooms and low-light control rooms: A dark canvas reduces the screen’s overall luminance, easing the eye’s adaptation, lowering glare, and minimizing visual fatigue during prolonged viewing sessions. However, dark backgrounds can introduce halation—where light text appears to bleed—especially for viewers with astigmatism.
- Display hardware: Backlit LCD screens render light backgrounds crisply, while OLED screens—where dark pixels emit little to no light—make dark themes power-efficient and visually deep, with true blacks that enhance contrast for bright data marks.
Testing both themes with real users in their actual setting provides the most reliable guidance.
Gradients and Opacity
In dense scatter plots and layered area charts, overplotting occurs when many marks occupy the same screen space and obscure one another. Lowering the alpha channel (opacity) of your fill or stroke color to between 10% and 40% addresses this directly. As individual marks overlap, they accumulate density: regions where many observations cluster appear darker and more saturated, while sparse regions remain pale. This turns overlap into a visual encoding of frequency. Similarly, in stacked or overlapping area charts, semi-transparent fills let viewers see the contours of each band through the others, keeping intersection regions and shared trends legible.
Gradient fills that fade from a saturated hue at one edge to a lighter or fully transparent tone at the other can signal direction, magnitude, or change along a continuous scale. In area charts, a vertical gradient anchored at the baseline and fading upward reduces visual weight in the upper reaches of the plot, keeping attention on the magnitude near zero while still showing the series’ full shape. In scatter plots, encoding a third variable through a color gradient across the point cloud reveals structure that uniform color hides.
Alpha compositing works best when the number of overlapping layers stays modest and base colors have good contrast against the background. Because very low alpha values on tiny marks can wash out entirely, test the rendering at the actual size viewers will see.
Avoiding Rainbow Schemes
Rainbow and jet-style palettes arrange hues across the full spectrum, asking the human eye to decode several distinct color names inside a single scale. Because bright green, yellow, orange, and red sit close together and each reads as its own category rather than a continuous step, viewers looking at a rainbow choropleth or heatmap treat the transitions between green-yellow or yellow-red as hard edges. The palette manufactures boundaries where the underlying data may only have gentle gradients.
Rainbow palettes also lack perceptual uniformity:
- Equal numerical steps do not produce equal perceived differences; some segments compress while others stretch, making flat data regions appear to jump sharply and steep changes fade into a single hue band.
- Jet places its lightest point near the middle of the scale rather than at one end, making a mid-range value look like a natural peak.
- Viewers cannot intuitively order distant hues from opposite ends of a rainbow without repeatedly checking the legend.
Replace rainbow schemes with perceptually uniform sequential scales (like Viridis, Cividis, or single-hue ramps), symmetric diverging scales for data with a meaningful center, or small sets of evenly spaced hues for true categories. Let lightness carry magnitude and reserve hue for grouping or polarity.
Semantic Color Coding
Semantic color coding assigns colors to chart elements based on what they represent in the real world, leveraging viewers’ existing mental models so comprehension happens faster without a translation step:
- Everyday and natural concepts: A category labeled “water” or ocean data reads quickly in blue, atmosphere or air quality in sky blue, “forest” or sustainability metrics in green, soil or land use in brown and tan, and a “warning” state in amber or red. Abstract categories can also borrow these conventions, such as cool-to-warm temperature scales.
- Brand identity: Using established organizational tones for specific products, regions, or business lines lets internal audiences who have seen those signature colors on packaging, campaigns, and dashboards recognize them instantly without consulting a legend.
Applying semantic coding requires knowing the audience and subject matter well enough to predict which associations they hold.
Legends and Labels
When a chart relies on a distant legend, the viewer’s eye must travel back and forth between the data marks and a separate key, holding a color-to-category mapping in working memory. Psychologists call this the split-attention effect, and it causes slower comprehension and more misreadings.
Replacing legends with inline direct labels solves this by placing the category name or annotation immediately beside the line, bar, or point it describes:
- Line charts: Place each series name at the end of its line so readers can trace a trend in a single glance.
- Scatter plots: Annotate clusters or notable points in place.
- Maps: Label regions or markers directly to avoid hunting for matching swatches in a corner key.
Position labels so they do not overlap marks or collide with neighboring text, adjust alignment as needed, and use color and font weight to tie each label visually to its series. Keep label text short, and remove any legend entries that direct labels have made redundant.
Dashboard Consistency
When a dashboard contains multiple charts drawing on the same underlying data, recurring entities must keep the same color everywhere they appear. If the revenue line is teal in the trend chart, it should remain teal in the regional breakdown, the forecast chart, and the summary table. Establishing global palette standards means defining this mapping once at the dashboard level so viewers can track a single series across multiple panels without re-reading legends.
Treat color as a property of the data rather than of an individual chart:
- Assign fixed, dedicated colors to categories that recur most often, such as primary metrics, comparison series, geographic regions, product lines, or performance bands.
- Draw secondary and one-off categories from a reserved extension range of the palette.
- Build these assignments into charting templates or theme configurations, document the palette, name color variables consistently in your codebase, and review new charts against the standard to prevent drift when analysts build views independently.
Frequently Asked Questions
Why do sequential palettes go from light to dark?
The human visual system processes luminance more rapidly and automatically than hue, so light-to-dark gradients are naturally interpreted as ordered, quantitative scales. Designers should keep the gradient monotonic in luminance to avoid perceptual reversals.
When should I use a diverging color palette?
Use a diverging palette when a dataset has a meaningful center from which values depart in two directions, such as variance from a sales target, profit-and-loss margins, or polar sentiment scores. Build it around a neutral midpoint and keep the number of steps symmetrical on both sides.
How many colors can I use for categorical data?
Six to eight categories is a comfortable ceiling for most categorical palettes; beyond that, colors become harder to distinguish, so group smaller categories together or switch to a different encoding. Hold luminance roughly constant so categories can be told apart without ranking them.
What contrast ratio do data marks need against the background?
The Web Content Accessibility Guidelines recommend a minimum 3:1 contrast ratio for data marks such as lines, bars, and points against the background. Normal text should aim for at least 4.5:1, and large text at least 3:1.
How can I make a chart accessible to people with color vision deficiency?
Choose engineered palettes such as Viridis for ordered values and Okabe-Ito for categorical series, and double-encode with marker shapes, dash patterns, textures, or direct labels. Apply a colorblindness simulator to the finished chart and check it in grayscale to confirm lightness differences carry the structure.
Do chart colors mean the same thing in different cultures?
No; color associations are not universal—red is tied to financial loss in many Western markets but signals good fortune and celebration in parts of East Asia, and white is linked to mourning in parts of Asia. Before finalizing a palette for an international or mixed audience, research how key colors are read in each target market and pair color with a second visual cue where ambiguity is likely.
Tony Astor
Tony writes about data visualization and the tools people use to build charts and dashboards. More about Data Illustrator