How to Annotate Charts So Readers Get the Point
 By Tony Astor ·
How to Annotate Charts So Readers Get the Point
Chart annotation is the practice of adding labels, titles, arrows, callout boxes, and highlighted zones directly to a chart so readers grasp the key insight quickly. Good annotations supply context, reduce ambiguity, and direct visual attention to the most important data points, cutting the cognitive effort needed to decode axes, scales, and raw values.
Table of Contents
Chart Annotation Basics
Every chart asks something of the person reading it. The viewer has to locate the axes, work out the scale, compare bar heights or trace the path of a line, and hold several values in mind at once while forming a conclusion. This cognitive load competes directly with the message the chart is meant to deliver. When a chart offers no guidance, the reader spends most of their attention on decoding the mechanics of the graphic and only a little on what it shows. Annotation changes that balance by supplying context at the moment it is needed, freeing working memory for interpretation rather than arithmetic.
A well-placed annotation works like a signpost. A short label beside the peak of a line chart, a note explaining a sudden dip, or a callout marking the one bar that matters all direct the eye to the point before the reader has to search for it. Visual attention is finite and follows whatever the chart emphasizes. When the emphasis is deliberate, the reader arrives at the key takeaway within seconds instead of scanning back and forth between legend, axis, and data points.
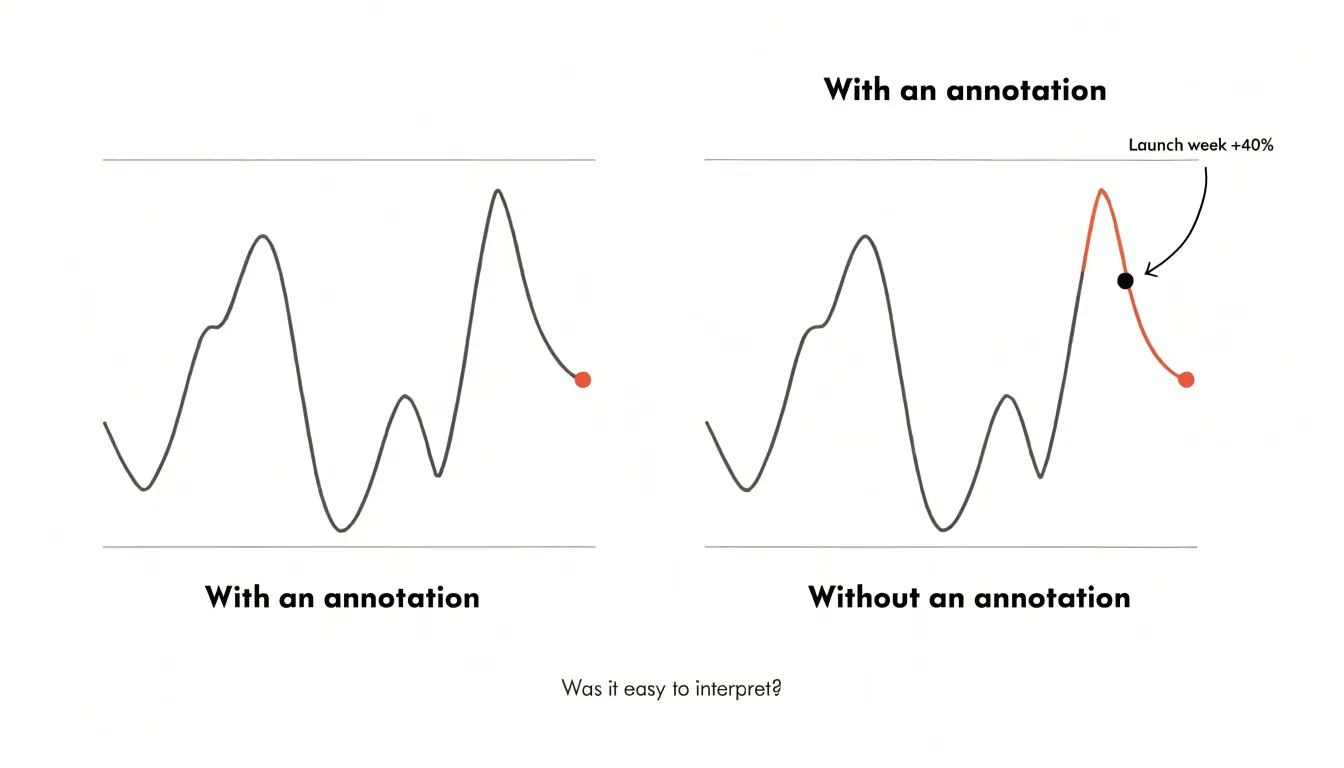
Context also reduces ambiguity. Raw numbers rarely explain themselves: a spike might reflect a product launch, a seasonal shift, or a data correction, and without a note the reader is left to guess, often guessing wrong. Annotations close that gap by pairing the visual with the reason behind it, so the chart communicates a finding rather than presenting an unexplained shape. The significance is attached to the exact spot where it lives, making annotated charts faster and clearer to read.
Clear Titles
A chart title is the first thing a reader notices, setting the expectation for everything that follows. Generic titles like “Monthly Sales by Region” or “Survey Responses” merely describe what the chart contains, leaving the reader to interpret the data on their own. An insight-driven headline, by contrast, states the main takeaway directly. Instead of “Monthly Sales by Region,” a title like “Western Region Sales Surged 40% in Q3, Outpacing All Other Regions” tells the reader what to look for and why it matters, guiding interpretation and reducing the risk of misreading.
To craft conclusion-oriented titles, ask: What is the single most important insight this chart reveals? Phrase that insight in plain, active language. Avoid vague terms and technical jargon; use strong verbs and specific numbers when possible. Place the headline prominently above the chart, using a larger font or bold styling to distinguish it from labels and captions, and keep it concise—ideally one line—so it remains scannable.
Direct Data Labels
Traditional legends force readers to glance back and forth between a separate key and the plotted lines, which creates visual fatigue and slows comprehension. Each color or marker must be matched to its label, and as the number of series grows, this cognitive load multiplies. Direct data labels solve this by placing the series name right next to the line it represents. In a multi-line chart showing revenue by product, instead of a legend listing “Product A,” “Product B,” and “Product C,” place each label at the end of its corresponding line so the eye travels along the line and immediately finds the name.
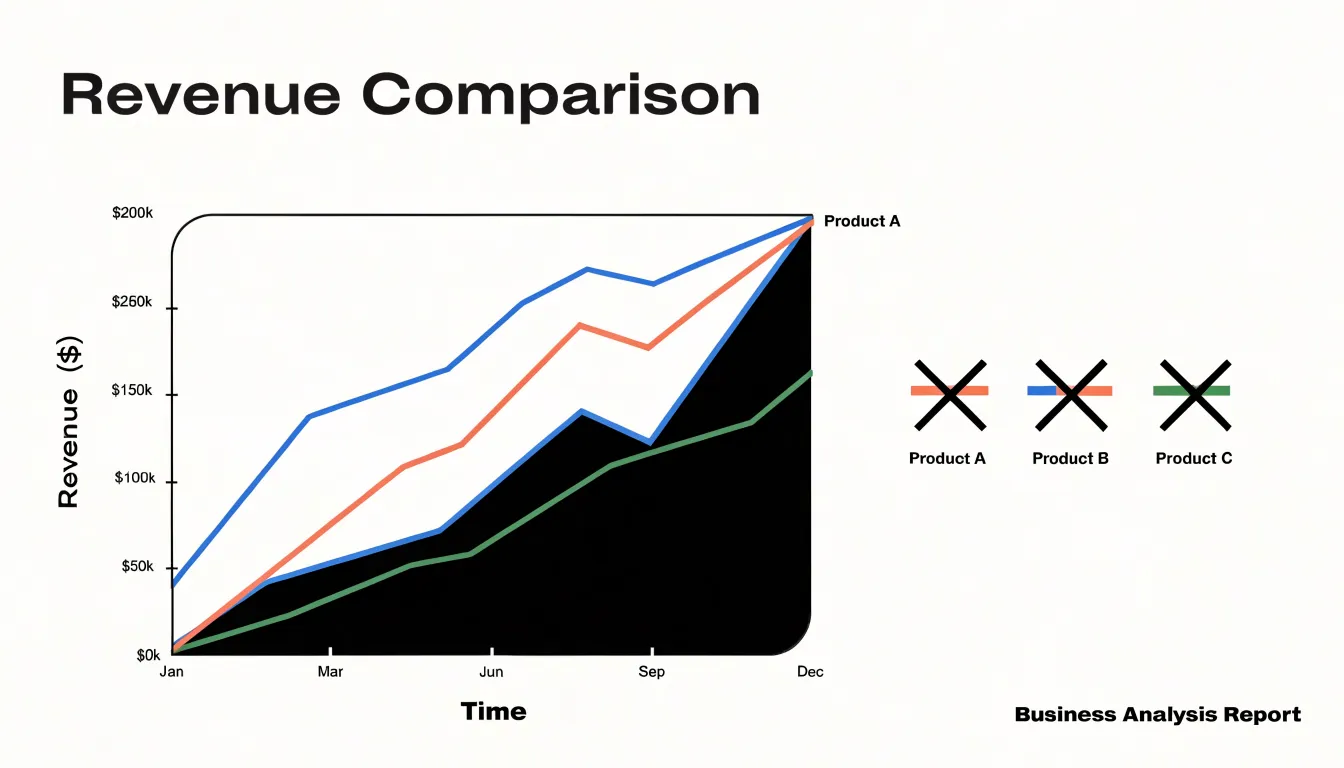
This approach is especially effective when lines cross and overlap. Align labels with the line’s final point or place them at a strategic midpoint where there is ample space. When lines are close together, adjust label positions slightly to avoid overlap, using leader lines if necessary so each label stays unmistakably tied to its series.
Direct data labels also save space. Legends often occupy a separate area of the chart, whereas integrating labels into the plot area leaves more room for the data itself—a clear advantage in small multiples or dashboards where space is limited. In addition, direct labels reduce the need for color matching, making the color secondary and the chart easier to read for people with color vision deficiencies.
Strategic Color
Contrast creates hierarchy. When every element in a chart competes for attention with equal visual weight, the reader’s eye has no clear entry point. The solution is to establish a muted baseline—gray lines, pale gridlines, and softly toned bars—and reserve one bold accent color for the numbers that matter most. Against a quiet backdrop, a single saturated hue, whether crimson, teal, or amber, registers almost before conscious thought begins.
Start by desaturating everything that provides context: historical trends, comparison categories, benchmark values, and axis furniture all shift toward neutral tones. Then apply one accent color only to the data point, label, or callout that carries the central message. If a revenue spike is the story, the spike gets the accent while the surrounding trend line stays gray; if one product outperforms its peers, that bar stands out in color while the rest recede. Limit the accent to a single focal element per chart—a second bold color dilutes the first and reintroduces ambiguity.
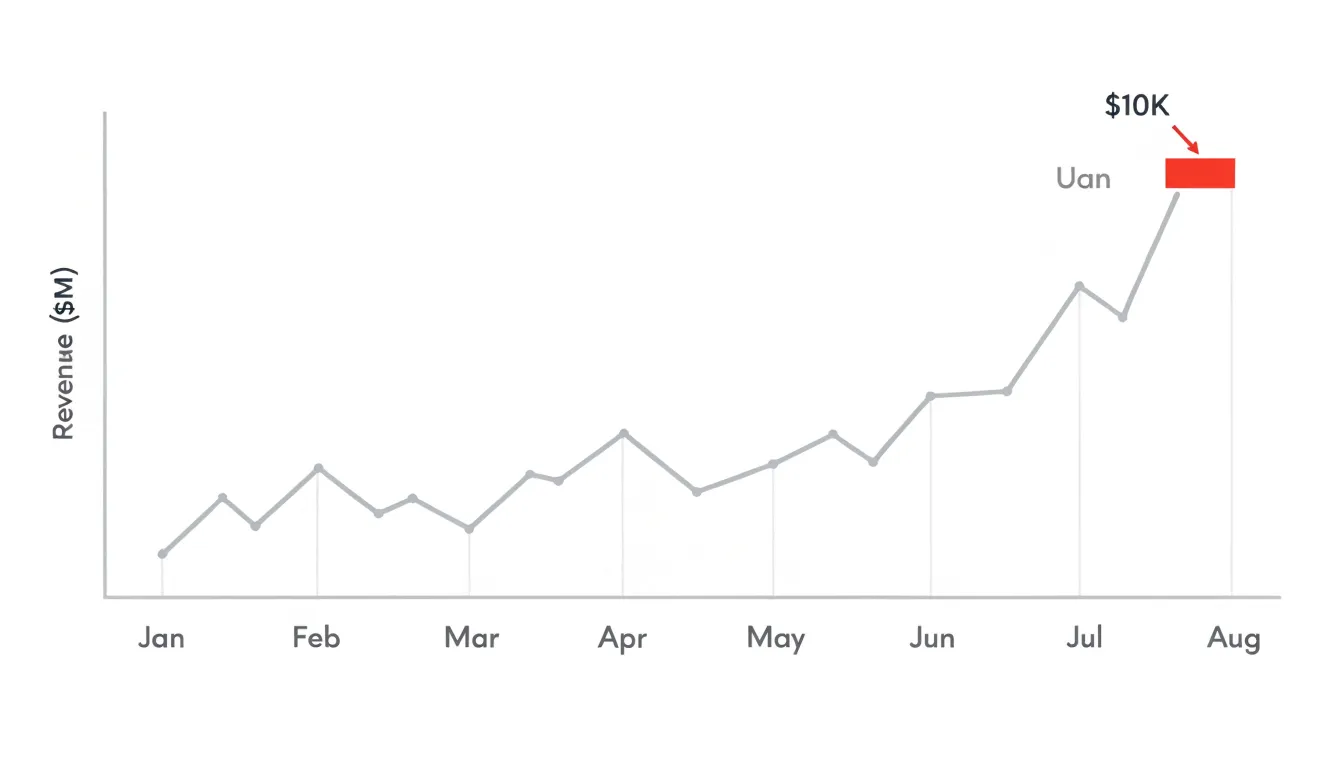
Accent color also encodes meaning across a document. Keeping the same accent across multiple charts in an article teaches the audience to track the key metric from figure to figure. Pairing that accent with a short label or arrow pointing to the highlighted value reinforces the connection between color and commentary.
Arrows and Lines
When a chart contains an inflection point—a sudden dip, a sharp climb, a crossover between two series—a clean geometric arrow gives the reader’s eye a direct path from the explanatory note to that exact spot. Keep the arrowhead simple and modest in size, use a consistent line weight that is visible without becoming heavy, and let the shaft run directly from the edge of the text block to the point being described. Avoid curves and flourishes unless they genuinely help the arrow navigate around crowded regions.
Connector lines work well when several notes need to reach different parts of the same chart. Where multiple thin connectors converge, stagger their endpoints slightly so the reader can trace each one individually.
Point the arrowhead at the precise inflection point rather than the general region around it. A short, direct arrow carries more authority than a long, meandering one. When the text sits close to the target, a simple leader line without an arrowhead can suffice; when the target is farther away, the arrowhead removes doubt about where to look. Use a muted neutral tone so the pointer does not compete with the data, or, if the chart uses several colors, match the arrow to the series it describes.
Callout Boxes
Callout boxes explain anomalies—a sudden peak or a sharp drop—without overwhelming the page. A small, distinct box of one or two sentences placed near the anomaly can supply external context that the data alone cannot convey: a mention on a popular blog behind a website traffic spike, a supply chain issue behind a sales dip, a product launch, a policy change, or a seasonal event.
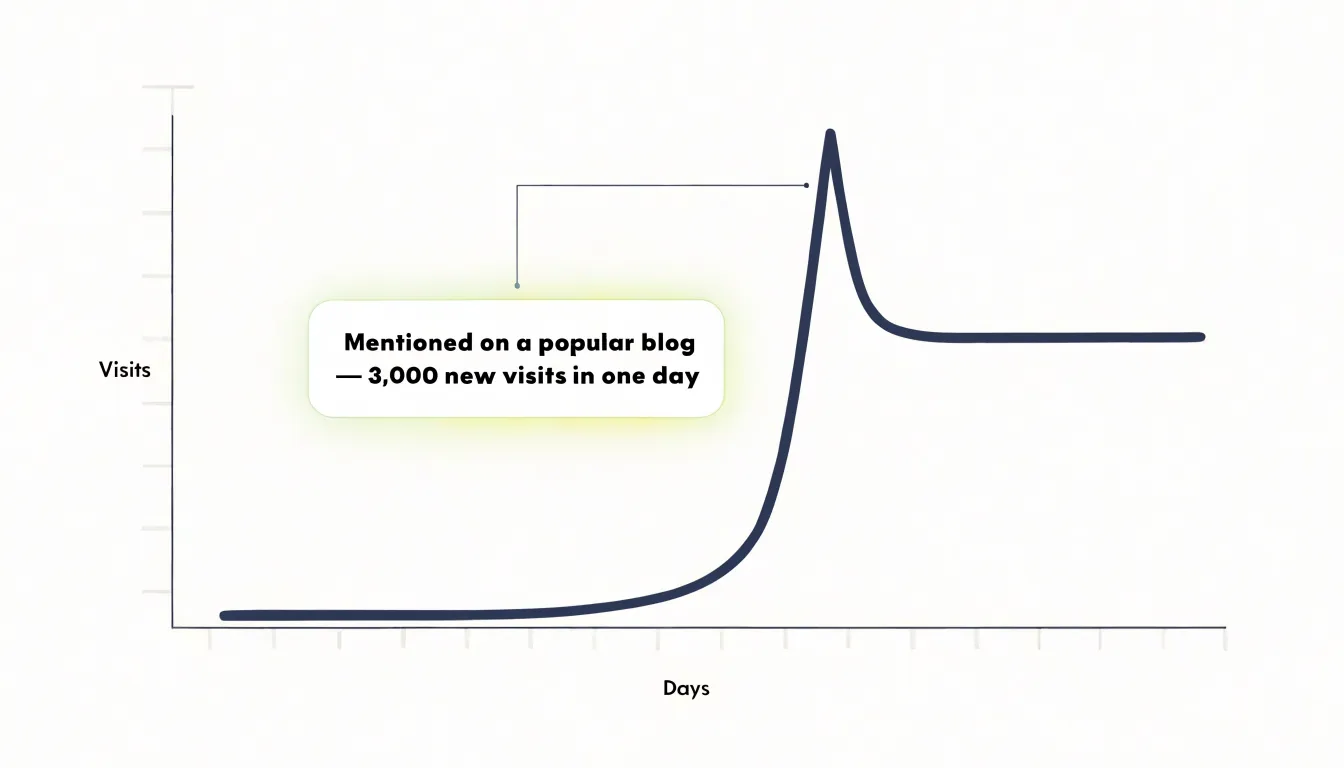
Place callout boxes in available white space close to the data point they reference, or connect them with a thin line, so the layout stays airy and the connection to the data is immediate.
Highlighted Zones
Highlighted zones use a translucent color block behind the data series to group points within a defined period—such as campaign runs, historical events, or economic shifts—without obscuring the underlying trend. For example, on a year-long website traffic chart, shading the weeks of a marketing campaign in light blue visually links the campaign window to the spike in visits.
Choose a subtle color that recedes into the background, such as a light gray or pastel tone, rather than saturated colors that compete with the data lines. Apply the shading uniformly across the full vertical height of the chart area to mark the timeframe clearly from start to end, and add a brief label directly above the shaded zone to name the event or period.
Shaded zones are especially effective for comparing multiple periods or showing before-and-after effects, replacing multiple arrows or text boxes with a single visual container.
Comparison Annotations
When two data points matter more than the rest of the series, an explicit bracket line spanning the vertical or horizontal distance between them gives readers a visual shortcut to the change. Pair the bracket with a percentage delta label at its midpoint or just beside it so the magnitude is legible without mental arithmetic. On a revenue chart, a bracket stretching from Q1 to Q4 with a +38% label alongside it lands the growth story in under a second.
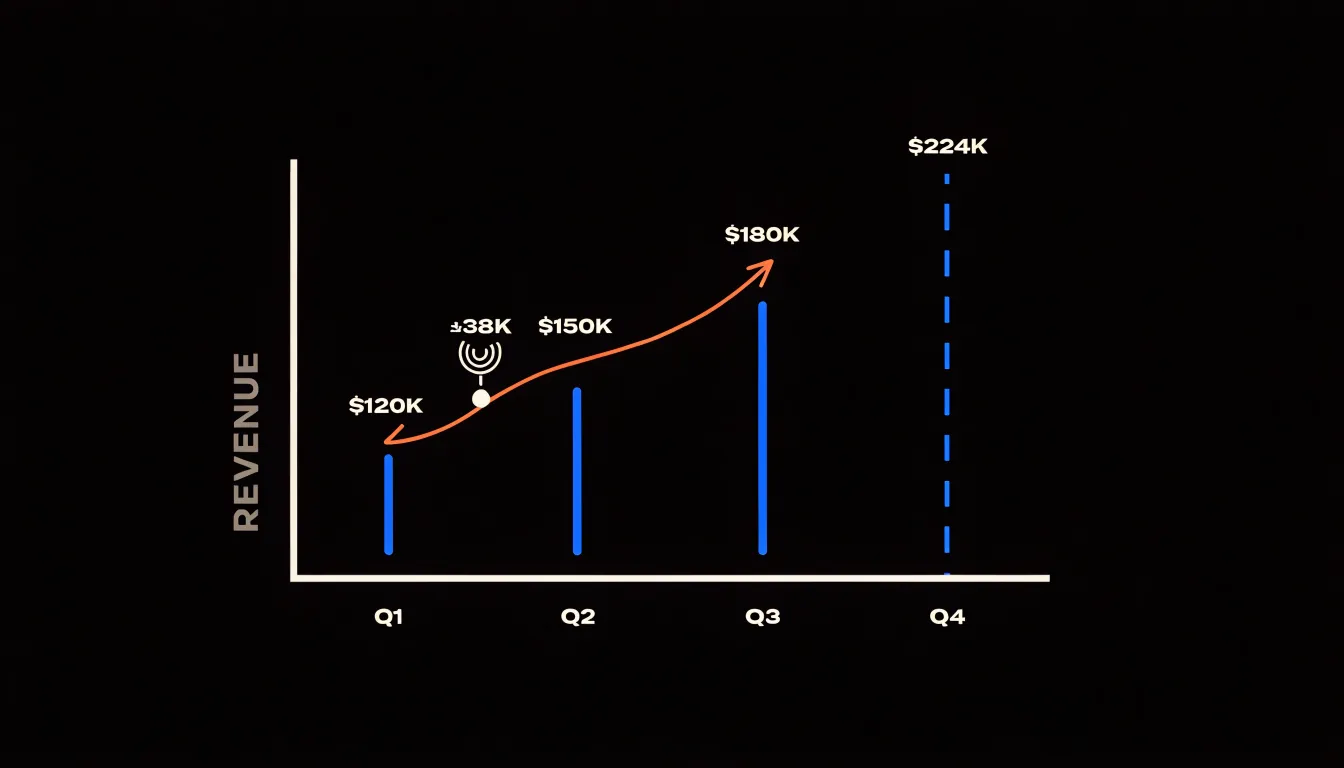
The technique works equally well for drops—connecting a declining metric to its earlier peak with a negative percentage—and for variance between comparable items. Two side-by-side categories, such as region A and region B, can be joined by a horizontal bracket and delta label when the raw values are close enough that the difference is hard to judge by eye.
Keep the bracket line thin and visually distinct from the data marks, using a neutral or accent color that separates it from the plotted series. Position the label so it never overlaps the line or the data points, round delta labels to at most one decimal place, and state the direction explicitly with a plus or minus sign. When several comparisons appear in one chart, limit yourself to the two or three that carry the narrative.
Visual Hierarchy
Visual hierarchy relies on contrast in font weight, scale, and color opacity so that annotations establish a clear reading order rather than shouting all at once.
- Font weight and scale: Use a bold, heavy typeface and the largest text size on the chart for your primary callout or critical number. Render secondary notes and supporting details in lighter weights and smaller sizes to create a natural progression from the headline insight down to the finer points.
- Color opacity: Give high-priority annotations full-opacity, saturated colors (such as a bright red callout for a key data point), and soften supporting elements—axis labels, source notes, gridlines, and contextual comments—with reduced opacity or muted tones.
- Consistency: Apply the same weight, size, and color rules to similar types of annotations throughout the chart so readers can categorize information quickly.
Test the hierarchy by squinting or viewing the chart from a distance: the elements that remain visible should be the ones you want to emphasize. If background elements compete, reduce their opacity or weight until the foreground dominates.
Decluttering
Dense gridlines, excessive tick marks, and repeated axis values create visual noise that competes with your annotations. Stripping away these non-essential elements leaves a clean canvas where callouts, arrows, and text boxes stand out right after the data itself.
- Gridlines: Keep only a few light horizontal lines to guide the eye, and remove vertical gridlines entirely unless they are critical for reading specific values.
- Tick marks: Reduce ticks to only those needed for approximate reading—major intervals alone usually suffice.
- Axis labels: Eliminate redundant labels; if the axis title clearly states the unit, do not repeat it on every tick.
Text Placement
A label that collides with a data point, a neighboring label, or the chart edge forces the reader to untangle which text belongs to which element. Give every text block roughly 4 to 8 pixels of padding on all sides. Treating each label as slightly larger than its visible glyphs absorbs small rendering differences across fonts and screen densities and keeps text from crowding markers or axis lines.
In tight data clusters, labels stacked directly above their points will overlap. Use dynamic alignment instead: position labels relative to surrounding free space by shifting them to the left or right of an anchor when the opposing side is occupied, or alternating above and below across a series of points to maximize separation.
Along steep trend lines, horizontal labels will cross the line or run off the plot area. Anchor labels at the line’s endpoint where space is typically open, or rotate the label to match the slope of a steep segment and add padding perpendicular to the line so the text floats clear of the stroke. In dense regions, cap the number of labels and rely on callouts, leader lines, or direct labeling at natural break points.
Accessible Contrast
Roughly one in twelve men and one in two hundred women experience some form of color blindness, most commonly red-green deficiencies that collapse distinctions between hues like crimson and forest green. Select palettes that vary in lightness as well as hue—such as sequential or diverging schemes with strong luminance steps—so lighter and darker tones separate cleanly even when hue information is lost. Preview palettes with tools that simulate deuteranopia and protanopia.
Reinforce color with a second cue: pair each series with a direct label, a distinct marker shape, or a fill pattern such as hatching or dots. Where space is tight, numbered or lettered markers keyed to a short list keep the chart unambiguous without adding clutter.
WCAG 2.1 requires a contrast ratio of at least 4.5:1 for normal text and 3:1 for large text and graphical elements. Check label colors against their backgrounds with a contrast calculator to catch combinations that look fine on a desktop monitor but vanish on a projector or a phone screen in daylight.
Mobile Formatting
On a phone screen, the available canvas shrinks dramatically, and desktop annotations can turn into an unreadable overlay. Adapt annotations for narrow viewports in three ways:
- Shorten the text: Truncate full explanatory sentences to an essential noun and value, such as
'Peak: 42k'. - Adjust scale and stroke: Set a minimum font size of about 11 to 12 pixels for secondary labels so text stays legible without zooming. Use thicker strokes and shorter paths for leader and connector lines so they do not disappear against dense data, and increase padding inside callout boxes proportionally.
- Reposition or disclose on tap: Because labels to the right of a data point may clip outside a narrow viewport, move callouts above or below their target, or convert fixed-position labels into a numbered key or legend-style list beneath the chart. Alternatively, use interactive disclosure so tapping a data point reveals its annotation while the default view stays clean.
Test each chart at common phone widths to verify that no labels overlap or clip.
Common Annotation Mistakes
Two frequent mistakes undermine chart annotations: over-annotation and vague phrasing.
- Over-annotation: Labeling every minor data point buries the main takeaway. Reserve annotations for the most significant points—as a rule of thumb, limit yourself to three or four per chart. For secondary points, use a single summary label or let the visual carry the information; if a chart needs more than four annotations, reconsider whether it is trying to do too much.
- Ambiguous phrasing: Labeling a spike with
'Increase'or using vague words like'significant'or'notable'leaves readers guessing at the cause and magnitude. Use concrete, specific language instead:'Sales rose 25% after the March campaign'or'Error rates doubled in Q2.'
Review each annotation before publishing and ask: Does this add necessary context? Is the wording unambiguous to someone unfamiliar with the data? If not, revise or remove it.
Final Editing Checklist
Before publishing an annotated chart, review four areas:
- Visual clarity: View the chart at thumbnail size to confirm the main trends and annotations remain discernible. Verify that annotations sit close to their target data points, leader lines appear only where necessary, and no text overlaps with data or other elements.
- Text readability: Confirm that font sizes are comfortable to read at the intended display size and across devices, using concise copy in clean (not thin or decorative) fonts with strong dark-on-light or light-on-dark contrast.
- Data accuracy: Double-check every number, label, comparison, and calculation against the underlying data, and verify that axes, scales, and units are accurately labeled and consistent with the trend descriptions.
- Contrast and color: Confirm that annotation colors stand out from the chart palette, remain distinguishable for readers with color vision deficiencies (using patterns or labels alongside color where needed), and stay interpretable in grayscale.
Frequently Asked Questions
What should a chart title say?
An insight-driven headline should state the main takeaway directly in plain, active language rather than merely describing what the chart contains. Keep it concise—ideally one line—and place it prominently above the chart.
Should I use a legend or label each line directly?
Direct data labels place each series name next to its line, so readers do not have to glance back and forth between the plotted lines and a separate key. This is especially useful when lines cross or overlap, and it can save space and reduce reliance on color matching.
How can I use color to make the key data point stand out?
Establish a muted baseline with gray lines, pale gridlines, and softly toned bars, then reserve one bold accent color for the data point, label, or callout carrying the central message. Limit the accent to a single focal element per chart, because a second bold color dilutes the first.
When should I use a callout box on a chart?
Use a callout box to explain an anomaly—such as a sudden peak or sharp drop—without overwhelming the page, placing a small box of one or two sentences near the anomaly or connecting it with a thin line. It can supply external context such as a product launch, policy change, or seasonal event.
How do I make chart annotations accessible for colorblind readers?
Choose palettes that vary in lightness as well as hue, preview them with deuteranopia and protanopia simulations, and reinforce color with a second cue such as direct labels, distinct marker shapes, or fill patterns. WCAG 2.1 requires a contrast ratio of at least 4.5:1 for normal text and 3:1 for large text and graphical elements.
How should I adapt chart annotations for mobile screens?
Shorten explanatory sentences to essentials like “Peak: 42k,” set a minimum font size of about 11 to 12 pixels for secondary labels, and use thicker strokes and shorter paths for leader and connector lines. Move callouts above or below their target or use tap-to-reveal annotations, and test charts at common phone widths to check for overlap or clipping.
Tony Astor
Tony writes about data visualization and the tools people use to build charts and dashboards. More about Data Illustrator