Horizontal Bar Chart: When to Turn Your Bars Sideways
 By Tony Astor ·

Horizontal Bar Chart
A horizontal bar chart runs bars left to right along a vertical category axis, placing each label directly beside its bar for natural left-to-right reading. It suits long or numerous category names, ranked comparisons, and mobile screens, accommodating 10–15 rows comfortably. Bars sorted largest to smallest form an immediately readable ranked list without rotated or truncated labels.
Table of Contents
Horizontal Bar Chart
Horizontal bar charts become the right choice when the category labels are long, numerous, or when readers need to compare values quickly across a ranked list. The orientation itself changes how the eye moves through the chart. With vertical bars, the eye travels up and down between the category labels and the bar heights, and labels must often be rotated or truncated to fit beneath narrow columns. Sideways bars place each label directly beside its bar on a single horizontal line, so the reader reads the category name and its length in one continuous left-to-right sweep. This alignment reduces eye travel and eliminates the tilted text that makes vertical charts slow to scan.
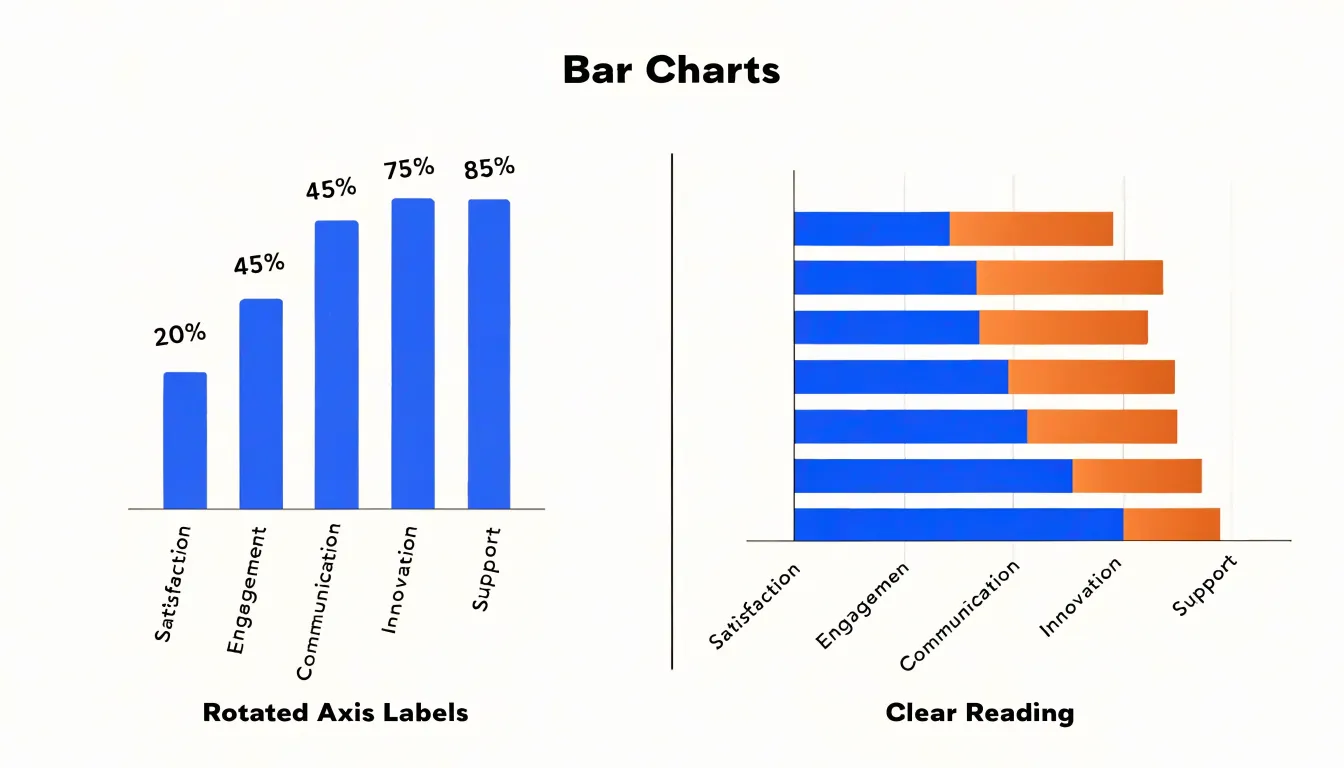
Ranking is another UX factor that favors the sideways layout. When bars are sorted from largest to smallest, the descending staircase reads naturally down the page, and the longest bars at the top anchor attention. Readers can compare adjacent rows without tracking a baseline across the full width of the chart, and the ordering itself communicates priority. Many categories also become easier to handle: a horizontal chart can accommodate twenty or thirty rows in a scrollable list, whereas vertical bars crowd together and force the reader to decipher cramped columns.
Label length matters equally. Survey responses, department names, product titles, and geographic regions rarely fit under a thin vertical column. In a horizontal chart, the label column widens to the length of the longest name without distorting the bars, and the bars remain a consistent height. Readers with varying visual acuity also benefit from the left-aligned starting point, which gives every bar the same origin and makes differences in length easier to judge. Time-based or ordinal data still works best vertically, since readers expect time to run left to right, but for ranked comparisons of named items the sideways bar keeps comprehension direct and immediate.
Horizontal Bar Chart
A horizontal bar chart turns the conventional bar chart onto its side, running bars left to right along a vertical category axis. This sideways orientation solves a persistent layout problem in categorical charts: the space required to display long category labels legibly. When categories carry descriptive names, such as survey responses, department titles, product lines, or geographic regions, those labels often run to several words. In a vertical bar chart, each label must fit beneath a bar whose width is fixed by the number of categories, so long text is forced to wrap across multiple lines, shrink to an unreadable size, or rotate at a steep angle. Angled labels in particular impose a physical tilt on the reader, slow scanning, and consume vertical space that could otherwise display data.
The horizontal format removes this constraint by giving each label its own full row along the vertical axis. Text reads naturally from left to right at a comfortable size, with the label occupying the space immediately beside the bar’s baseline. Because the axis is vertical, there is ample room to accommodate extended phrasing without truncation, ellipsis, or rotation. Labels remain aligned in a clean column, which supports rapid comparison as the eye travels down the list. This matters in reports and dashboards where the category names themselves convey essential meaning and cannot be abbreviated without losing context.
Readers scanning a horizontal bar chart encounter each label in its complete form at the point where they evaluate the bar’s length. The result is a chart that stays legible under real-world data conditions, where categories are descriptive rather than short codes, and where clarity of naming matters as much as the precision of the values being compared.
Horizontal Bar Chart
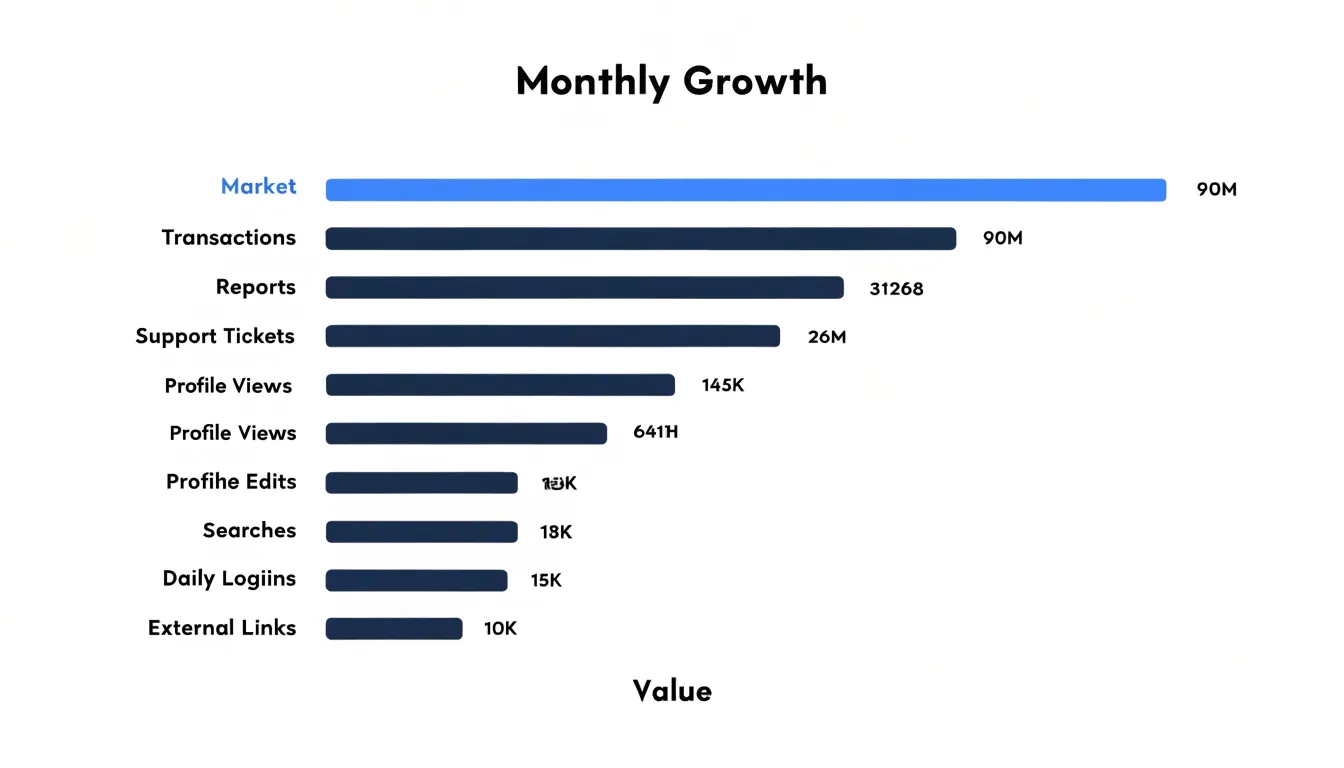
Sorting a horizontal bar chart from highest to lowest transforms a simple collection of bars into a ranked list that viewers can read at a glance. When the bars are ordered by value, the eye moves naturally from the longest bar at the top down to the shortest at the bottom, and the chart’s structure itself communicates the ranking. This arrangement removes the mental work of comparing bar lengths one by one across an unordered chart, letting the audience focus on interpretation rather than measurement.
The top of the chart becomes a natural focal point. Readers looking for the leading category, the standout product, or the strongest region will find it immediately in the first row. Likewise, the bottom of the chart surfaces the weakest performers and the outliers that trail the rest of the group. This symmetry is valuable in reporting contexts, where both success and underperformance matter and where a viewer’s first question is often simply who is winning and who is lagging.
Descending order also makes the distribution of values visible. Long bars clustered near the top followed by a gradual taper show a smooth spread, while a sharp drop after the first few rows reveals a small group of leaders separated from the pack. These shapes carry meaning that a sorted list preserves and an unsorted one obscures. When ties occur, order them alphabetically or by a secondary criterion so the sequence stays stable across updates.
Keep the sort consistent across related charts and over time. If a chart is refreshed each month, sorting anew by the current values keeps the ranking honest, while a fixed order suits comparisons where category positions should remain familiar. Label the axis clearly and consider adding value annotations so precise figures accompany the visual ranking. A thoughtful descending sort turns a chart into a clear statement about relative performance.
Horizontal Bar Chart
Survey data often arrives as Likert scale responses, where participants choose among ordered options such as strongly disagree, disagree, neutral, agree, and strongly agree. A horizontal bar chart handles this structure well because the category labels, which can be long phrases, sit comfortably along the vertical axis and read left to right without rotation or truncation. Each response option becomes its own bar, and the bar length shows how many respondents selected it. Ordering the bars from the most negative option at the bottom to the most positive at the top mirrors the natural progression of the scale, so readers can follow the distribution intuitively.
A diverging stacked bar chart takes this approach further by centering the neutral category on a zero baseline. Negative responses extend to the left and positive responses extend to the right, producing a visual midpoint that separates agreement from disagreement. This layout makes it easy to compare sentiment across multiple survey questions or demographic groups, since each row can represent one item and the overall lean of each row is immediately visible. The centered baseline also emphasizes the balance of opinion rather than raw counts alone.
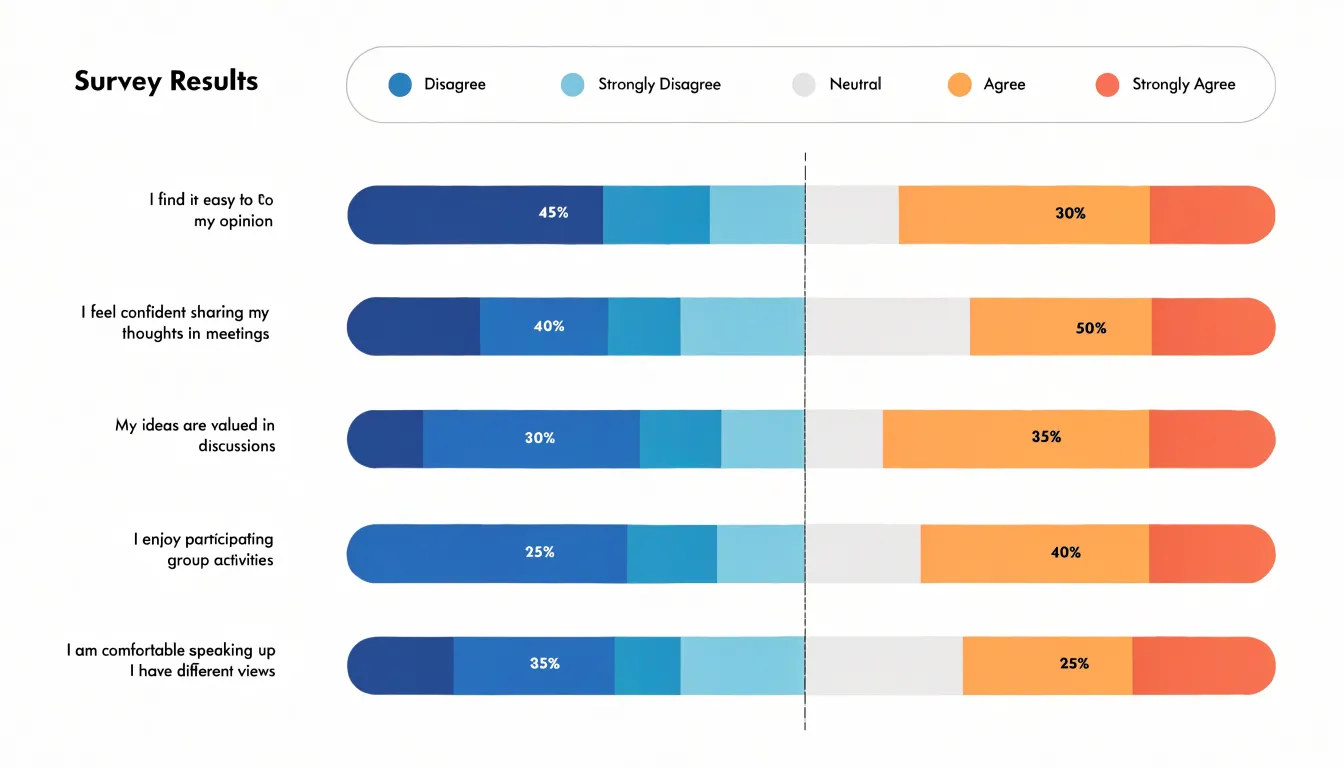
Color choices reinforce the scale’s direction. A sequential palette that runs from a cool tone for negative responses through a neutral gray to a warm tone for positive responses helps readers decode the chart without consulting the legend repeatedly. Consistent spacing between bars and clear percentage labels inside or beside each segment improve readability, particularly when the chart includes many questions.
When preparing these charts, aggregate small response categories if necessary to avoid slivers that are too thin to label. Include the sample size for each row so readers can judge reliability, and place the legend in a consistent position. With careful ordering, centering, and color design, horizontal and diverging stacked bar charts turn complex survey distributions into clear, comparable summaries.
Horizontal Bar Chart
A horizontal bar chart places categories along the vertical axis and stretches each bar from left to right, so that the eye encounters the label first and then follows the bar toward its value. This arrangement mirrors the natural left-to-right reading flow that most Western audiences acquire from early childhood. When a chart follows the same directional pattern as written language, viewers do not need to pause, reorient, or translate the spatial layout into a familiar sequence. The result is a smoother first pass across the graphic and a faster grasp of what the data shows.
The benefit shows up in how cognitive load is distributed. Reading a chart involves locating a category, finding its corresponding mark, and estimating the length or endpoint of that mark. In a horizontal layout, the category labels sit at the starting edge of each bar, directly in the path of the viewer’s gaze. The brain moves from the name to the bar without a detour, and the bar’s length extends in the same direction the eyes already travel. Because the decoding steps follow an established habit, fewer mental resources are spent on navigating the chart’s structure. Those resources remain available for interpreting the data itself, such as comparing magnitudes or noticing which categories stand out.
Speed of visual processing improves as well. Familiar spatial conventions allow the visual system to recognize patterns quickly, and a left-to-right bar invites an immediate read of quantity as distance traveled. Longer bars register as larger values almost automatically. The layout therefore supports rapid scanning, which matters when a chart must communicate in presentations, dashboards, or reports where attention is brief.
Horizontal Bar Chart
Horizontal bar charts offer a practical advantage when a visualization has to live on a narrow mobile screen. Because each category is drawn as a horizontal bar, the labels can sit to the left of the bars and read naturally from left to right, which removes the need to rotate text or truncate long category names. On a phone, a vertical column chart with many categories forces either cramped, tilted labels or a chart that spills sideways, requiring horizontal panning or zooming that disrupts reading. A horizontal layout sidesteps this by aligning the full label with its bar along a single line, so the reader takes in name and value in one glance.
The more consequential benefit is how horizontal charts fit into vertical scrolling, the primary interaction pattern on mobile devices. Large datasets commonly contain dozens or even hundreds of categories, and a horizontal bar chart can extend downward within the page, with the user simply scrolling to reveal more rows. Each bar occupies a consistent height, producing a steady rhythm as the reader moves through the data, and the ordering remains visible as they go. This arrangement treats the chart as an extension of the page’s natural flow rather than a separate viewport to be manipulated. The reader never has to switch between scrolling the page and panning inside a chart, which keeps attention on the data itself.
This structure also supports progressive disclosure. A long horizontal chart can be paired with sticky headers or repeated axis markers so the reader retains context while scrolling, and categories can be grouped or sorted to make scanning easier. Combined with generous row spacing sized for touch, horizontal bars remain legible and tappable even on the smallest screens, making them a reliable choice for dense mobile datasets.
Vertical Bar Chart
Time series data carries an inherent structure that shapes how it should be displayed. Each observation is tied to a specific moment or interval, and those moments unfold along a single continuum. A vertical bar chart mirrors this structure directly: the horizontal axis becomes the timeline, with earlier dates positioned on the left and later dates progressing to the right, while the vertical axis measures the value at each point. This layout matches the reading habits most audiences already bring to charts, since time flows left to right just as text flows across a page.
When columns rise from a shared baseline along a chronological axis, the eye can trace patterns with very little effort. Rising and falling sequences along the bottom edge form a visible silhouette that reveals growth, decline, seasonality, and cyclical movement. A sudden spike stands out immediately because it breaks the rhythm of neighboring columns, and a gradual downward drift is equally apparent as the bar heights step lower from left to right. These trend cues depend on spacing and adjacency, both of which vertical bars preserve naturally when dates are ordered correctly.
Vertical columns also make comparison across periods intuitive. Because every bar shares the same baseline, differences in height translate directly into differences in magnitude, so a reader can judge that one quarter outpaced another without consulting the axis labels. Grouping or stacking multiple series within each time period extends this advantage, allowing several categories to be compared period by period while the chronological progression remains intact.
Labeling is another practical benefit. Date labels can run beneath the columns at regular intervals, and shorter formats fit comfortably along the horizontal axis, keeping the chart compact and readable. For these reasons, vertical bars remain the natural default whenever the story is about how values change through time.
Horizontal Bar Chart
A horizontal bar chart becomes especially useful when the data includes both positive and negative values. In this configuration, the chart establishes a central baseline, typically a vertical line at zero, and extends bars to the right for positive values and to the left for negative values. The result is a bi-directional layout that lets readers instantly see which items are above or below the reference point, and by how much. This mirrored structure turns the chart into a visual ledger of gains and losses, making the direction of each value as meaningful as its magnitude.
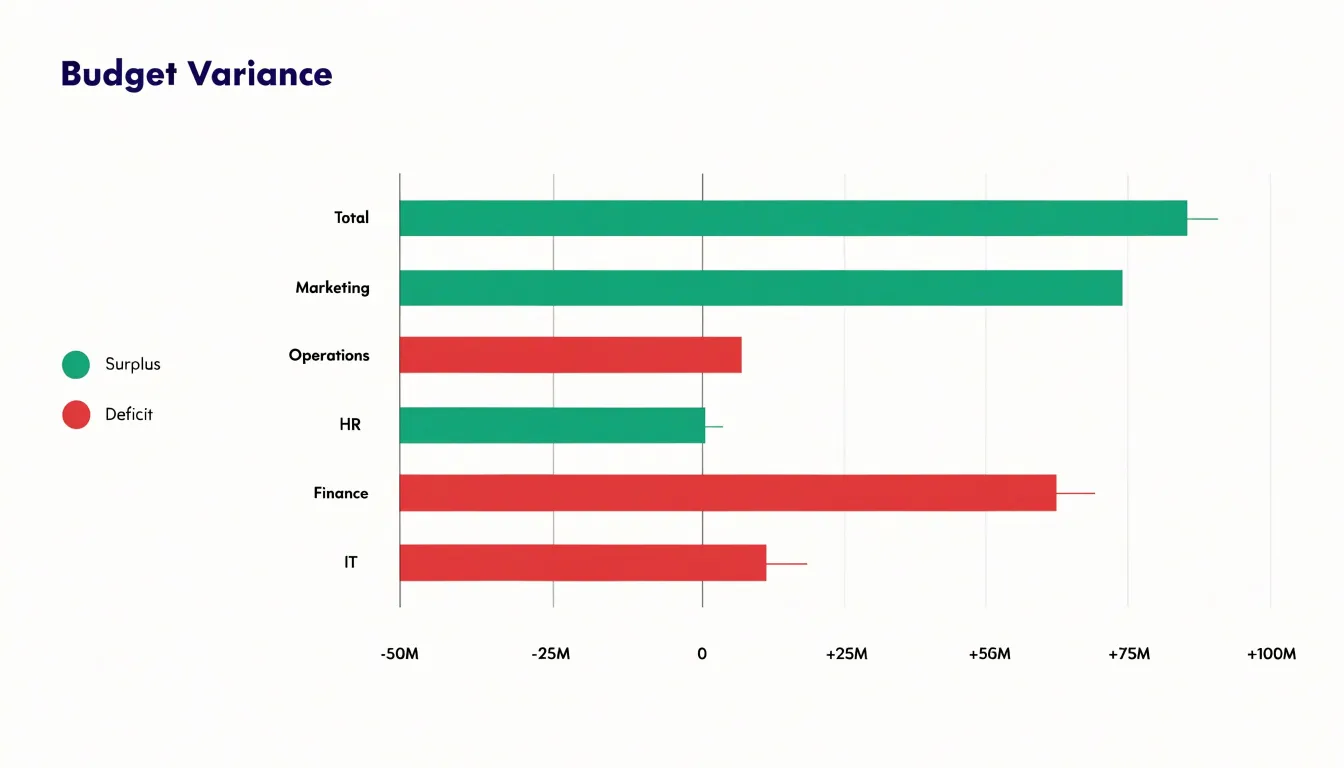
The central baseline serves as the anchor for every comparison. Because all bars share the same zero point, differences between positive and negative values remain proportionate and easy to judge. A bar extending far to the left reads as a substantial deficit, while a shorter bar to the right reads as a modest surplus. Readers can scan down the category axis and compare the relative lengths of bars on both sides without mentally converting values or tracking multiple scales. This is particularly valuable in financial contexts, where line items such as profit and loss, budget variance, or cash flow frequently straddle zero.
Grouping related positive and negative values along the same axis also supports direct paired comparisons. When a category has both an inflow and an outflow, or a gain and a corresponding loss, placing them on opposite sides of the baseline makes the relationship visible at a glance. The diverging bars show the balance between the two, and the eye can quickly estimate which side dominates. Color choices reinforce this reading, with one hue for positive values and another for negative values, while the shared baseline keeps the encoding consistent across the entire chart.
Horizontal orientation adds further practical benefits. Long category labels sit comfortably along the vertical axis without rotation, and the horizontal direction gives bars ample room to extend on both sides of the baseline. For datasets containing mixed signs, this combination of readable labels, a clear zero reference, and mirrored bars produces a chart that communicates gains and losses with clarity and precision.
Horizontal Bar Chart
A horizontal bar chart earns its clarity from what the designer chooses to leave out. Gridlines deserve the first pass of editing. Vertical gridlines that trace through the bars add visual weight without helping anyone read a value, since the bars themselves already extend from a common baseline and the eye can compare their lengths directly. Removing them is usually the fastest improvement available, and any remaining axis lines can be lightened to a pale grey so they recede behind the data. Where gridlines are still useful for reading precise values, keep them thin, low-contrast, and spaced at round intervals, and never let them sit on top of the bars.
Bar spacing carries much of the chart’s rhythm. Each bar should be noticeably thicker than the gap that separates it from its neighbor, so the bars group visually as data objects rather than dissolving into a set of stripes. A gap of roughly a fifth to a quarter of the bar thickness works well in most cases. Consistent spacing throughout the chart preserves the ordering logic, while uneven gaps invite readers to hunt for a meaning that isn’t there. If the bars carry a single color, spacing alone provides enough separation, and heavy borders around each bar become unnecessary clutter.
Label placement is the third pillar. Category labels belong close to their bars so the eye never has to travel across the chart to match a name to a value. Putting labels in the left margin, right-aligned against the bars, keeps the reading path short and steady. Value labels can sit at the end of each bar in a muted tone, or be dropped where the axis is clearly marked and the numbers are less important than the pattern. Trimming tick marks, borders, and background fills completes the job, leaving a layout where every mark carries information and the data itself dominates the frame.
Horizontal Bar Chart
Strategic use of color in a horizontal bar chart transforms a neutral display of values into a guided reading experience. A restrained, neutral base palette applied to most bars establishes visual quiet, so that viewers can scan category labels and bar lengths without distraction. Against this calm foundation, a focal accent color can be reserved for the specific categories or benchmark values that deserve immediate attention. Because the eye is naturally drawn to contrast, a single saturated bar among muted neighbors becomes an instant anchor point, allowing the chart to communicate its central message before a reader has consciously parsed a single label or number.
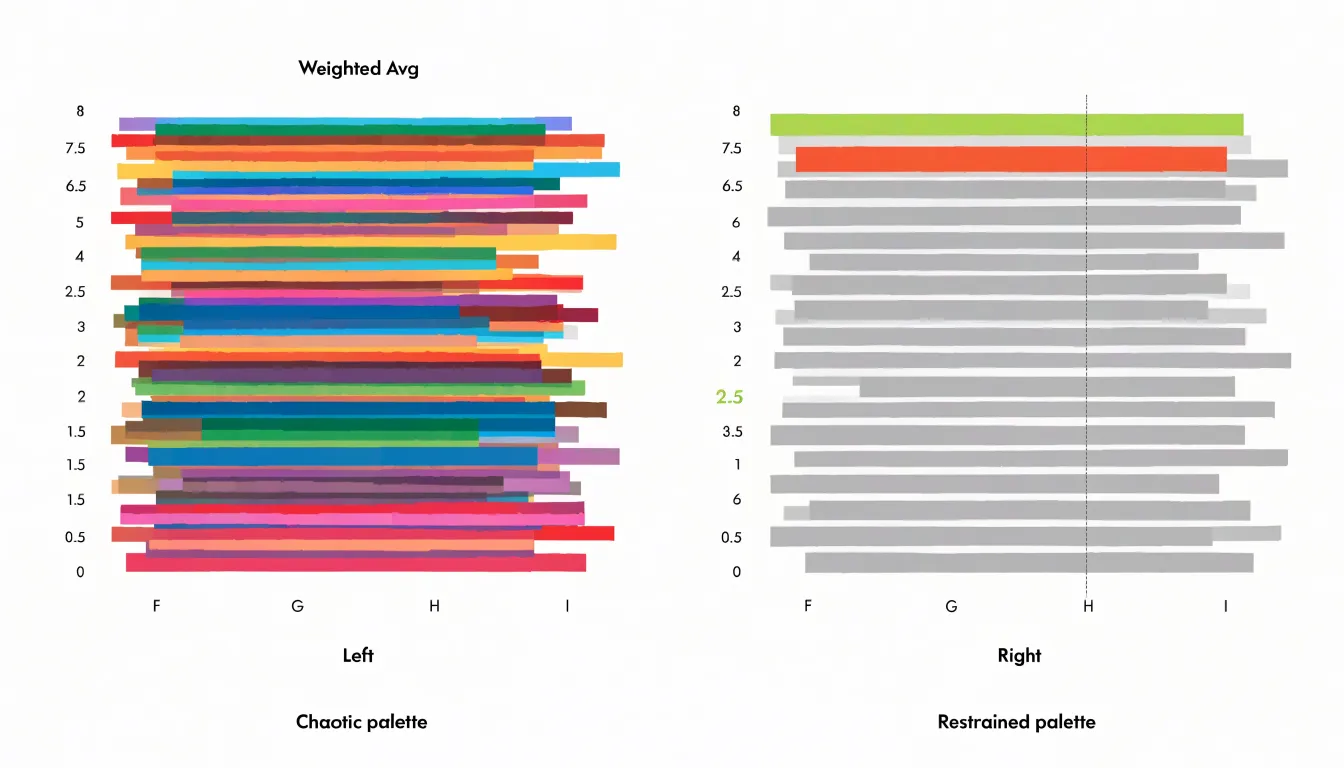
Color choices should follow the logic of the comparison being made. When the goal is to show which categories exceed or fall below a target, a two-tone scheme — one hue for values above the benchmark and a second for values below — encodes that relationship directly into the visual field. When the goal is to single out a particular category, such as a current year, a client segment, or a regional total, one accent color applied only to that bar achieves emphasis without requiring annotation. Benchmark values themselves can be marked with a vertical reference line or with a distinctly colored bar representing the target, giving readers a fixed standard against which every category is measured.
Accessibility considerations matter throughout. Palettes should maintain sufficient luminance contrast against the background and remain distinguishable for viewers with color vision deficiencies, which often means pairing hue differences with lightness differences or direct labels. Limiting the total number of distinct colors keeps the chart legible and reinforces the hierarchy of information.
Applied with discipline, color turns the horizontal bar chart into a focused argument rather than a raw data inventory, directing attention precisely where the comparison matters most.
Horizontal Bar Chart
When building a horizontal bar chart, the number of bars you include shapes how easily a reader can scan the chart and extract meaning. A chart with three or four bars reads almost instantly, while one with forty bars becomes a striped wall that forces the eye to travel and re-trace. The practical threshold for most business and editorial contexts sits somewhere between ten and fifteen bars. Within that range, a reader can compare lengths, track ranking order, and read category labels without zooming, scrolling, or losing their place. Beyond roughly twenty bars, label collisions, shrinking row heights, and the sheer volume of visual marks begin to compete with the data itself.
Data density interacts with display size. A large-format dashboard panel or a printed report page can absorb more bars than a mobile card or a narrow sidebar. As a rule of thumb, each bar needs enough vertical room for a legible label and a clear gap from its neighbor. When that room disappears, the chart stops being a comparison tool and becomes a texture.
The standard remedy is top-N grouping. Rank categories by the measure that matters, keep the top ten or so individually, and aggregate the remainder into a single ‘Other’ bar. This preserves the total, keeps the chart honest, and directs attention to the categories that carry the most weight. The ‘Other’ bar belongs at the bottom of a sorted chart, visually distinct enough that readers understand it is a rollup rather than a single entity. Where the tail matters, a note or companion table can carry the detail.
Sorting by value also supports density decisions, since a descending rank makes both the leading categories and the drop-off point visible at a glance. Together, a sensible bar count and thoughtful grouping keep the chart readable while still telling the full story of the data.
Horizontal Bar Chart
Tooltips turn a static horizontal bar chart into an exploration surface. When a reader moves the pointer over a bar, a small floating panel appears next to the cursor and reports the exact value that bar encodes, along with any supporting context the chart designer chooses to include, such as the category name, the percentage share of the total, the change from a previous period, or a short annotation describing an outlier. Because this information lives in a layered element that appears only on demand, the chart itself can stay clean: axis labels remain sparse, bars carry no embedded numbers, and the primary visual encoding continues to do its job of showing relative magnitude at a glance.
Implementation in a web context typically builds on SVG or Canvas rendering combined with pointer event listeners. A common pattern attaches a mouseenter or pointermove handler to each bar rectangle, reads a data attribute holding the metric, and positions a styled div or SVG group near the event coordinates. For horizontal bars, tooltips usually appear to the right of the bar end or follow the cursor vertically, which keeps the panel from covering the bar being inspected. Charts built with libraries such as D3, Chart.js, or Recharts expose tooltip callbacks that make this straightforward, while custom builds require care with positioning so the panel does not overflow the container near the edges. HTML tooltips offer richer content than native title attributes, allowing formatted numbers, small sparklines, or colored swatches.
Accessibility deserves attention. Keyboard users should be able to focus each bar and trigger the same information through focus events, and touch devices need a tap equivalent, since hover is unavailable. Smooth fade transitions and sensible delays reduce flicker as the pointer travels across bars, and the tooltip content should mirror the underlying data source so the chart and its labels never disagree.
Frequently Asked Questions
When should I use a horizontal bar chart instead of a vertical bar chart?
Horizontal bar charts are best when category labels are long, numerous, or when readers need to compare values quickly across a ranked list. Time-based or ordinal data still works best vertically because readers expect time to run left to right.
How should I sort a horizontal bar chart?
Sort bars from highest to lowest so the chart becomes a ranked list with the longest bar at the top and the shortest at the bottom. Keep the sort consistent across related charts and over time, and order ties alphabetically or by a secondary criterion.
How many bars should a horizontal bar chart include?
The practical threshold for most business and editorial contexts is about ten to fifteen bars. Beyond roughly twenty bars, label collisions and shrinking row heights compete with the data, so rank categories, keep the top ten or so, and aggregate the remainder into an “Other” bar at the bottom.
How do horizontal bar charts work for survey or Likert scale data?
Horizontal bar charts handle Likert data well because long response labels sit along the vertical axis without rotation or truncation. Each response option becomes its own bar, and ordering from most negative at the bottom to most positive at the top mirrors the scale; a diverging stacked bar chart centers the neutral category on a zero baseline.
Are horizontal bar charts good for mobile screens?
Horizontal bar charts are well suited to mobile screens because labels can sit to the left of the bars and read naturally from left to right without rotation or truncation. A long chart can extend downward within the page as the user scrolls, and sticky headers or repeated axis markers can help retain context.
How can I make a horizontal bar chart accessible?
Tooltips should report the exact value and supporting context, and keyboard users should be able to focus each bar to trigger the same information while touch devices need a tap equivalent. Color palettes should maintain sufficient luminance contrast, remain distinguishable for viewers with color vision deficiencies, and limit the total number of distinct colors.
Tony Astor
Tony writes about data visualization and the tools people use to build charts and dashboards. More about Data Illustrator