Heatmap: How to Visualize Data With Color Intensity
 By Tony Astor ·

Heatmap
A heatmap maps numeric values onto a color scale so each cell in a matrix carries its own hue or intensity, letting viewers spot clusters, gradients, and outliers at a glance instead of reading rows of numbers. Axes organize two variables, a color gradient encodes magnitude, and a legend anchors interpretation.
Table of Contents
- Heatmap Basics
- Core Components
- Choosing Color Palettes
- Color Contrast and Accessibility
- Data Preparation
- Avoiding Visual Distortions
- Website User Tracking
- Geographic Density Maps
- Financial Matrix Views
- Healthcare Heatmaps
- Retail Planning
- Combining Chart Types
- Common Beginner Mistakes
- Heatmap Dashboard
Heatmap Basics
A heatmap maps numeric values onto a color scale so that every cell in a matrix carries its own hue or intensity. Each data point is compared against a defined range and assigned a color from a continuous or stepped palette. Low values might appear as pale blues, mid-range values as greens or yellows, and high values as deep reds. Patterns of color replace rows of numbers, allowing the eye to scan the entire surface in a fraction of a second.
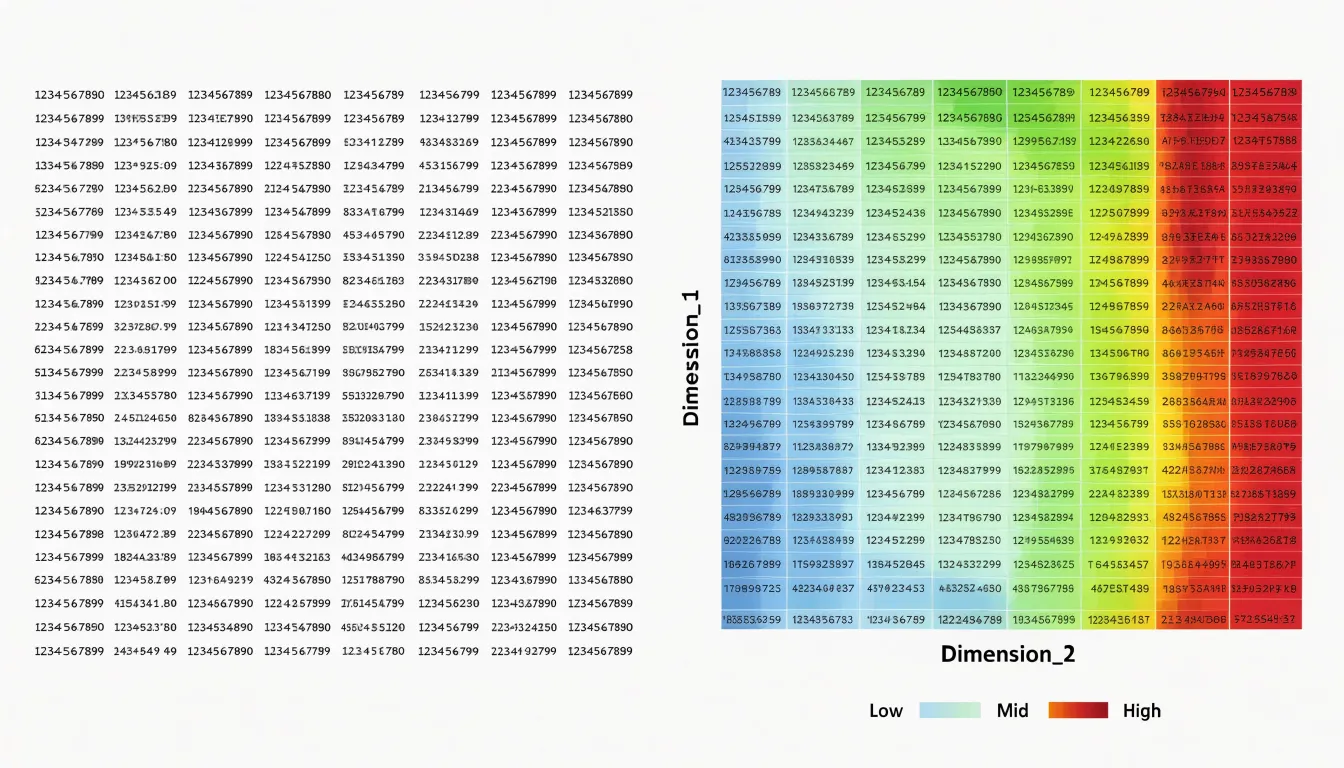
This translation from quantity to color makes dense matrix data accessible at a glance. While a table with thousands of entries demands careful reading and mental arithmetic, a heatmap reveals clusters, gradients, and outliers immediately because human vision is highly attuned to differences in color and brightness across a field. When constructed well, the heatmap becomes a compact visual summary, letting viewers spot hot spots, cold zones, and structural patterns without consulting the raw figures.
Core Components
A heatmap is built on a rectangular grid in which each cell corresponds to a pairing of two categorical or ordered variables, one arranged along the x-axis and the other along the y-axis. The axes provide the frame of reference: their labels and tick marks tell the reader which categories, time periods, or value ranges are being compared, and their ordering—alphabetical, chronological, or ranked—shapes how patterns emerge visually. Within that grid, every cell carries a data value, typically a magnitude such as a count, correlation coefficient, or intensity measurement. These matrix values are the substance of the chart; the grid simply organizes them into a readable structure.
Those raw values are translated into visual form through a color gradient. Continuous gradients flow smoothly from one end of the scale to the other, making them well suited to variables like temperature or density where values shift gradually. Discrete (stepped or banded) gradients use a fixed set of distinct colors assigned to value bands, which can make thresholds and categories easier to distinguish at a glance.
A scale legend accompanies the gradient, showing how specific colors correspond to specific values and anchoring the reader’s interpretation of the grid. Together, the axes, cell values, gradient, and legend form an integrated system. Adjustments to one element—such as changing the gradient or reordering the axes—ripple through the whole visualization, altering which patterns stand out and how confidently viewers can read the chart.
Choosing Color Palettes
Selecting a color palette is one of the most consequential decisions in heatmap design, because the color scale carries the quantitative message.
Sequential palettes are built around a single hue that increases in saturation or darkness as values rise, moving from a pale tint through progressively richer shades toward a deep, dense endpoint. This gradual progression suits data that runs from low to high in one direction, letting readers perceive small differences among low values while still recognizing the direction of increase. A well-constructed sequential scale, often anchored in a light neutral at the low end, keeps attention on the pattern of intensity across the grid rather than on decorative color variation. Designers frequently pair these palettes with lightness ramps, since human vision is particularly sensitive to changes in luminance and can rank shades reliably even when hue shifts are subtle.
Diverging palettes place two contrasting hues at opposite ends of the scale, joined through a muted or pale midpoint that represents a central baseline. These schemes suit data organized around a meaningful reference value, such as an average, zero, or target, where the story lies in departures above and below that anchor. By assigning warm and cool families to the two directions, a diverging scale enables viewers to immediately separate positive deviations from negative ones, while the neutral center visually recedes. Careful choice of midpoint color is essential, since it should read as an absence of signal rather than as a distinct category of its own.
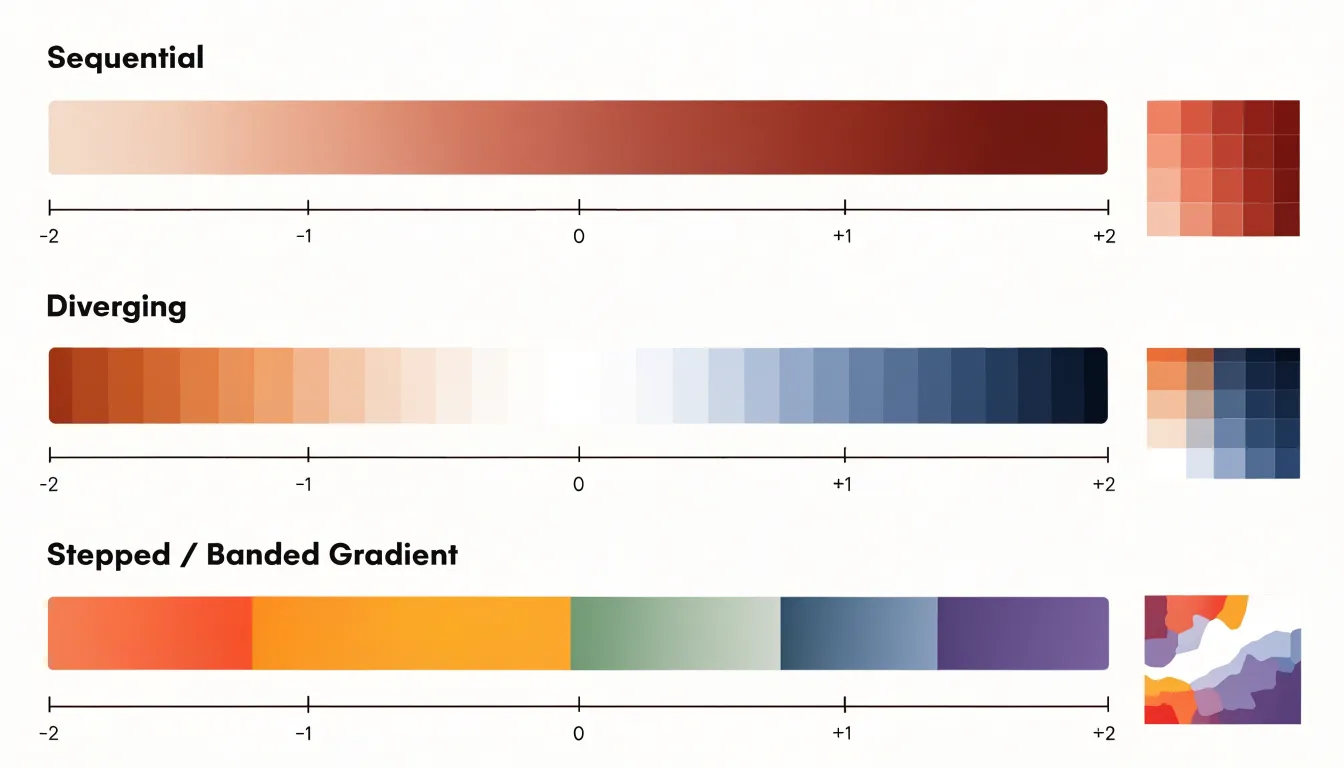
Matching the palette to the structure of the data—ordered magnitude for sequential schemes and baseline deviation for diverging schemes—ensures the heatmap communicates its underlying pattern clearly and honestly.
Color Contrast and Accessibility
Because heatmaps rely on color to convey information, they can easily exclude users with color vision deficiencies or low vision. Approximately 8% of men and 0.5% of women have some form of color blindness, making it essential to choose palettes that are distinguishable for all. Colorblind-friendly palettes such as Viridis or Magma are designed to be perceptually uniform and intuitive, with colors that remain distinct even to individuals with common types of color blindness.
Ensuring sufficient contrast ratios between adjacent colors is equally crucial. The Web Content Accessibility Guidelines (WCAG) recommend a contrast ratio of at least 4.5:1 for normal text; for heatmaps, the goal is to maintain a minimum contrast between color steps so that patterns remain discernible. This is best achieved using palettes with a wide luminance range, as luminance differences are more reliably perceived than hue differences. Tools like ColorBrewer, online contrast checkers, grayscale views, or colorblind simulators can help validate palette choices before publication.
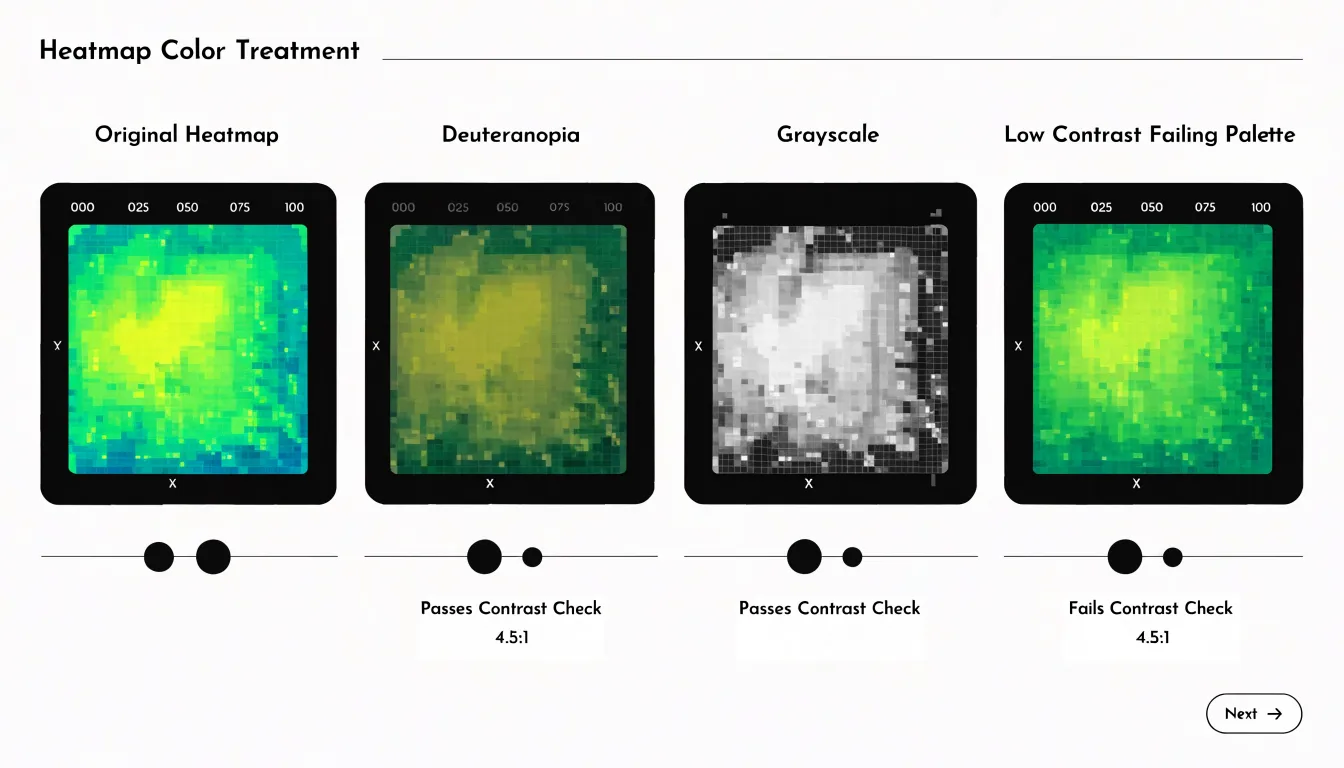
Designers must also consider background colors and overlays, as a heatmap on a dark background requires different contrast considerations than one on a light background. Finally, providing alternative representations—such as direct text labels, numeric callouts on key cells, or distinct patterns—enhances accessibility so viewers who cannot perceive color differences still receive the underlying values.
Data Preparation
Raw numbers rarely arrive in a form that maps cleanly onto a color scale. Data preparation focuses on three related tasks: normalizing skewed distributions, handling missing values, and scaling outliers so extreme numbers do not dominate the color distribution.
- Normalizing skewed data: When a metric contains a long tail of large values, a linear color mapping compresses the majority of observations into the low end of the palette, leaving most cells visually indistinguishable. Applying a normalization step, such as a logarithmic or square-root transform, spreads the dense lower range across more color steps while keeping the overall ordering intact. This gives readers a clearer sense of variation among typical values without sacrificing awareness of the larger ones.
- Handling missing values: An empty cell rendered in the same hue as valid data invites misreading. Common approaches include assigning missing entries a neutral color outside the main gradient, marking them with a distinct texture, or excluding them entirely when the underlying grid supports gaps. The choice should reflect what the absence actually means in context: unrecorded, inapplicable, or zero are different conditions that deserve different visual signals.
- Scaling outliers: A single value orders of magnitude above the rest can stretch the color scale until every other cell collapses into a single shade. Winsorizing, log scaling, or capping the scale at a robust percentile preserves the visibility of normal variation while flagging the extreme values separately, often through annotation or an overflow color.
Avoiding Visual Distortions
Poor color choices can introduce visual distortions that mislead viewers. A common pitfall is the use of non-uniform color steps, where the perceptual distance between adjacent colors does not match the numerical difference between the values they represent. For instance, a palette that jumps from light yellow to dark red may make a moderate increase in value appear as a dramatic shift, artificially exaggerating minor variations. This distortion occurs because the human visual system does not perceive all color transitions equally; some hues appear more distinct than others even when the underlying data differences are the same.
Similarly, rainbow palettes, which cycle through multiple hues, are notorious for creating false boundaries and implying order where none exists (and are often indistinguishable to colorblind readers). The abrupt transitions between hues, such as from green to yellow or blue to cyan, can draw attention to trivial fluctuations while obscuring broader trends. Moreover, rainbow palettes lack a natural perceptual ordering, making it difficult to accurately compare values across the map.
To avoid these distortions, choose a perceptually uniform color palette where equal steps in data value look like equal steps in color perception. Sequential palettes with consistent lightness steps or diverging palettes with a neutral midpoint prevent misleading interpretations and ensure the heatmap communicates true patterns in the data.
Website User Tracking
Website user tracking turns anonymous sessions into visible behavioral patterns using three main heatmap views:
- Click maps record where visitors press, tap, or follow links, showing which elements attract attention and which sit ignored. Repeated clicks on non-interactive areas often reveal a mismatch between what a page looks like and what users expect it to do, giving UX researchers a direct signal that a layout is misleading or that an element should become a real control.
- Mouse-movement tracking sketches the routes people take between headlines, imagery, navigation, and calls to action. Aggregated across thousands of sessions, these tracks expose the reading order visitors actually follow, the zones where the cursor stalls in hesitation, and the corridors that lead toward a form or checkout button.
- Scroll-depth heatmaps show how far down a page people travel before they stop, which paragraphs hold attention, and which sections below the fold are rarely reached.
Marketers use these three views together to test whether a hero section earns the scroll, whether key benefits appear before the drop-off line, and whether a conversion funnel loses momentum at a specific step. UX researchers combine the same data with session replays and usability tests to distinguish genuine confusion from idle cursor drift. The practical output is a set of layout revisions: moving a call to action above the fold, enlarging a click target, shortening a paragraph that interrupts flow, or repositioning social proof where scroll data shows attention is still active.
Geographic Density Maps
Geographic density maps apply the heatmap concept to physical space, layering color gradients over maps of cities, regions, or countries. Each point of activity—a delivery, resident, transaction, or event—is plotted at its coordinates, building color intensity wherever observations cluster. This provides an immediate sense of where events happen without requiring the viewer to interpret tables of coordinates or postal codes.
Common applications include:
- Population density: Shading reveals the contrast between crowded urban cores and sparsely settled hinterlands.
- Logistics operations: Tracking shipment volumes, warehouse throughput, or last-mile delivery patterns exposes corridors that carry heavy traffic and zones that generate steady, dispersed demand.
- Event frequency mapping: Plotting incident reports, service calls, maintenance requests, or public gatherings allows planners to see recurring hotspots and seasonal shifts across a territory.
As color ramps move from cool, low-intensity tones to saturated peaks, the map beneath supplies geographic context such as roads, boundaries, and landmarks. Kernel density estimation or grid-based aggregation smooths raw points into continuous surfaces, and adjustable radius or cell size settings let analysts zoom from neighborhood detail to regional overview. Interactivity adds further depth, with hover tooltips revealing exact counts and filters that isolate time periods or categories to support site selection, resource allocation, and strategic planning.
Financial Matrix Views
Stock market indexes, asset correlation matrices, and risk exposure dashboards involve large tables of numbers whose meaning becomes apparent only when compared across rows and columns.
Applied to a broad stock market index, a heatmap typically shows every constituent sector or holding colored by daily return, so clusters of green or red immediately reveal which parts of the market are driving performance and which are lagging. The same treatment works for international indexes, where a single view can show regional strength or weakness across dozens of markets.
In asset correlation matrices, each cell represents the correlation between two assets, and the color scale highlights high positive correlations, near-zero relationships, and negative correlations. In a portfolio context, this makes diversification visible: large blocks of dark color indicate holdings that move together, while contrasting bands show pairs that offset each other. Analysts can spot concentration risk that simple position weights would hide, and see how correlation structure shifts during periods of market stress.
Risk exposure dashboards apply the same logic to factors such as sector, geography, currency, and duration. Coloring each exposure by its contribution to overall risk allows a portfolio manager to identify where risk is concentrated and where it is well spread, giving teams a shared reference point for discussing allocation changes.
Healthcare Heatmaps
Public health agencies use heatmaps to plot confirmed cases, vaccination coverage, and outbreak clusters onto geographic maps, with color intensity encoding case counts or rates. This provides an immediate read on hot spots, corridors of transmission, and areas where reporting may be lagging. Analysts often layer infection rates with population density, mobility patterns, or environmental factors to explore which conditions coincide with surges, supporting decisions about where to allocate testing kits, mobile clinics, or public messaging campaigns.
In hospital administration, heatmaps track patient admission trends by charting emergency department visits, ICU occupancy, or readmission rates across departments and seasons. Administrators can see which wards are filling fastest and where staffing gaps are likely to emerge. Resource utilization heatmaps track ventilator use, bed turnover, or supply consumption, helping supply chain teams anticipate shortages before they become critical.
Updated regularly, healthcare heatmaps also serve as a communication and coordination tool between hospitals, local health departments, policymakers, and regional planners, allowing teams to compare conditions across facilities and align responses.
Retail Planning
Heatmaps give retail planners a visual record of how customers physically move through a store. Movement data is captured through overhead sensors, video analytics, or Wi-Fi and Bluetooth signal tracking, then aggregated into density maps. These maps show which entrances draw the most traffic, which aisles become congested at peak hours, and which corners remain untouched, often revealing that the natural pathways shoppers follow diverge sharply from the intended store layout.
Aisle dwell time adds a second layer of insight by measuring where customers linger, helping planners distinguish between genuine engagement and common transit routes. A display near the entrance may register heavy footfall while holding attention for only a few seconds, whereas a quieter endcap deeper in the store might hold shoppers for minutes. Combining movement volume with dwell time identifies high-value locations for promoted products, checkout bottlenecks, and dead ends that discourage exploration.
Armed with these patterns, planners can reposition fixtures, widen busy aisles, relocate impulse items, and adjust signage to guide flow toward underperforming sections. Heatmap analysis also supports seasonal resets, category reviews, and staffing decisions by showing how layout changes shift traffic over time.
Combining Chart Types
Merging a heatmap with complementary chart types lets analysts display several dimensions of a dataset at once, turning a static matrix into a compact analytical dashboard:
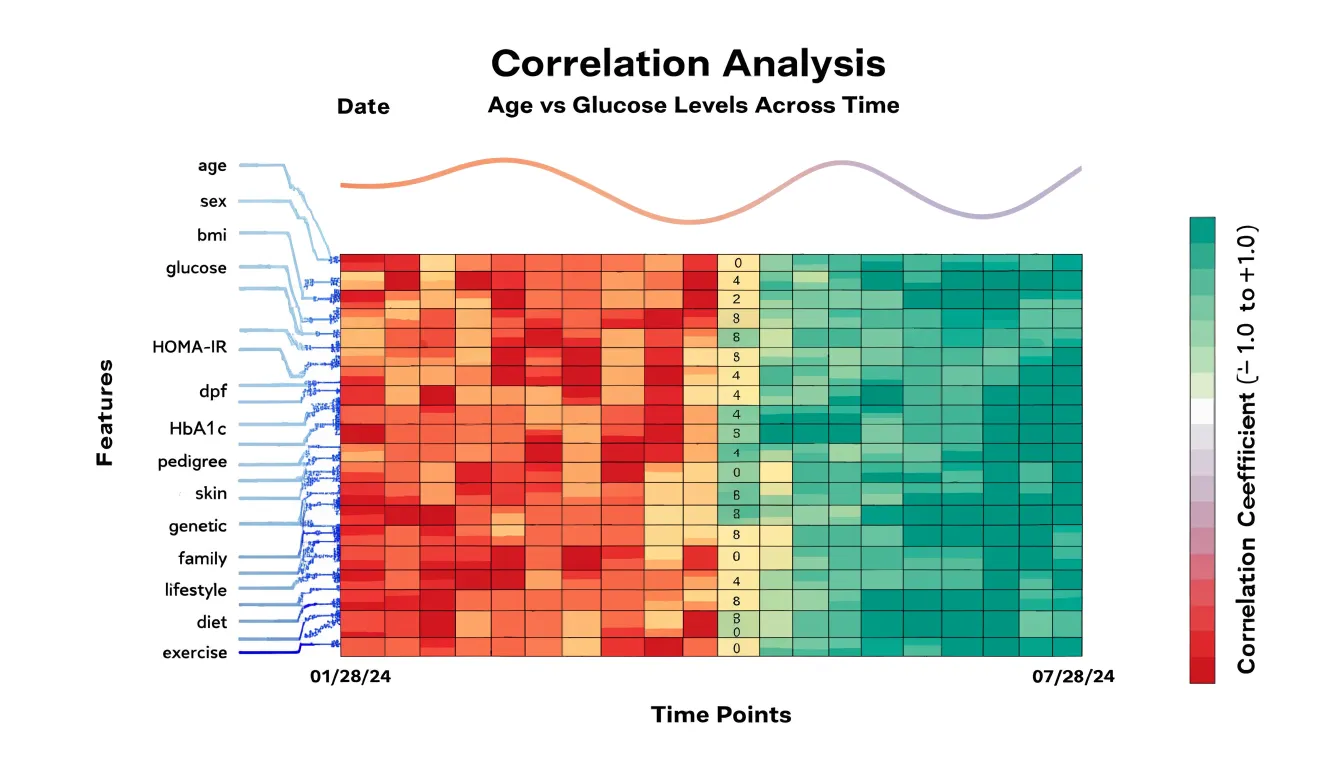
- Hierarchical clustering dendrograms: Placing dendrograms along the rows and columns of a heatmap groups similar values together and shows the tree structure that produced those groupings. The dendrogram supplies the lineage, allowing viewers to trace how clusters form and where boundaries fall, while the heatmap supplies the density of values within each branch.
- Marginal line graphs: A line chart running beside the top, bottom, or side edge of a heatmap can show a running total, average, or trend across the same columns or rows. These marginal panels connect variation inside the grid to changes in an aggregate series outside it, grounding the chart when the heatmap alone would leave the overall trajectory ambiguous.
- Scatter overlays: Plotting individual points directly on top of colored cells is useful when underlying observations are sparse or unevenly distributed. In genomic, financial, and sensor datasets, scatter overlays reveal sample density and outliers that uniform cell shading can obscure, showing both the smoothed aggregate surface and the raw records within a single frame.
Common Beginner Mistakes
Newcomers to heatmaps often make a few predictable mistakes outside of palette selection:
- Overcrowding the grid: When a matrix contains hundreds of rows and columns, cells shrink until labels become unreadable and color differences blur. Reduce the data before plotting: aggregate values into coarser categories, filter to the most important rows and columns, or split one large heatmap into smaller panels. Sorting rows and columns by magnitude or clustering similar values also helps viewers spot structure without inspecting individual cells. Avoid labeling every tick mark; showing every second or fifth label keeps the axis legible.
- Omitting a legend or scale context: Without a colorbar, the reader cannot translate shade into value. Always include a legend showing the scale, its units, and the direction of the gradient. If the data are normalized or log-transformed, state that clearly next to the legend so the numbers are not misread.
Heatmap Dashboard
Integrating heatmaps into an executive or operational dashboard requires balancing high-level patterns with deeper context. Raw color intensity rarely explains why a region draws attention, so a dashboard heatmap gains meaning when placed alongside complementary KPIs such as conversion rate or session duration, allowing readers to connect visual patterns to business outcomes.
Executives typically need a compact view that highlights the few zones worth acting on, with drill-down paths available for analysts who want detail. To keep the dashboard legible and trustworthy:
- Limit each dashboard to one or two heatmaps to avoid visual overload.
- Reserve the widest palette range for the primary view and maintain consistent color scales across related views.
- Use sensible aggregation windows and explicitly document refresh cadence and data provenance.
Frequently Asked Questions
What is a heatmap used for?
A heatmap maps numeric values onto a color scale so that every cell in a matrix carries its own hue or intensity, allowing viewers to spot clusters, gradients, and outliers at a glance. It provides a compact visual summary of dense matrix data.
What is the difference between sequential and diverging color palettes?
Sequential palettes are built around a single hue that increases in saturation or darkness as values rise, suiting data that runs from low to high in one direction. Diverging palettes place two contrasting hues at opposite ends of the scale, joined through a muted or pale midpoint that represents a central baseline.
How can I make a heatmap accessible for colorblind users?
Use colorblind-friendly palettes such as Viridis or Magma and maintain sufficient contrast between adjacent color steps, since approximately 8% of men and 0.5% of women have some form of color blindness. Also provide alternative representations such as direct text labels, numeric callouts on key cells, or distinct patterns.
How should I handle missing values in a heatmap?
Common approaches include assigning missing entries a neutral color outside the main gradient, marking them with a distinct texture, or excluding them entirely when the underlying grid supports gaps. The choice should reflect whether the absence means unrecorded, inapplicable, or zero.
What do click maps, mouse-movement tracking, and scroll-depth heatmaps show?
Click maps record where visitors press, tap, or follow links, mouse-movement tracking shows the routes people take between page elements, and scroll-depth heatmaps show how far down a page people travel before they stop. Together these views help marketers and UX researchers understand attention, hesitation, and drop-off patterns.

How are heatmaps used in healthcare?
Public health agencies use heatmaps to plot confirmed cases, vaccination coverage, and outbreak clusters onto geographic maps, while hospital administrators use them to track admission trends, ICU occupancy, readmission rates, and resource utilization. Updated regularly, healthcare heatmaps can also support communication and coordination among hospitals, local health departments, policymakers, and regional planners.
Tony Astor
Tony writes about data visualization and the tools people use to build charts and dashboards. More about Data Illustrator