Grouped Bar Chart: How to Compare Categories Side by Side
 By Tony Astor ·

Grouped Bar Chart
A grouped bar chart displays bars for related sub-categories side by side within a shared category slot, forming clusters along the axis. Each bar represents a different series, distinguished by consistent color, so viewers can compare sub-categories within a group and track one series across all groups. Bars start at a zero baseline to keep lengths proportional to values.
Table of Contents
Grouped Bar Chart
A grouped bar chart places bars for related sub-categories next to one another, forming a small cluster for each main category along the axis. The defining feature of this layout is adjacency: because the bars within a cluster sit side by side, the eye can move quickly from one bar to the next and compare their lengths without searching across the chart. This makes grouped bar charts well suited to situations where the primary question is how several sub-categories perform relative to each other within the same category, such as sales figures for different product lines in each region, or test results for several student cohorts across terms.
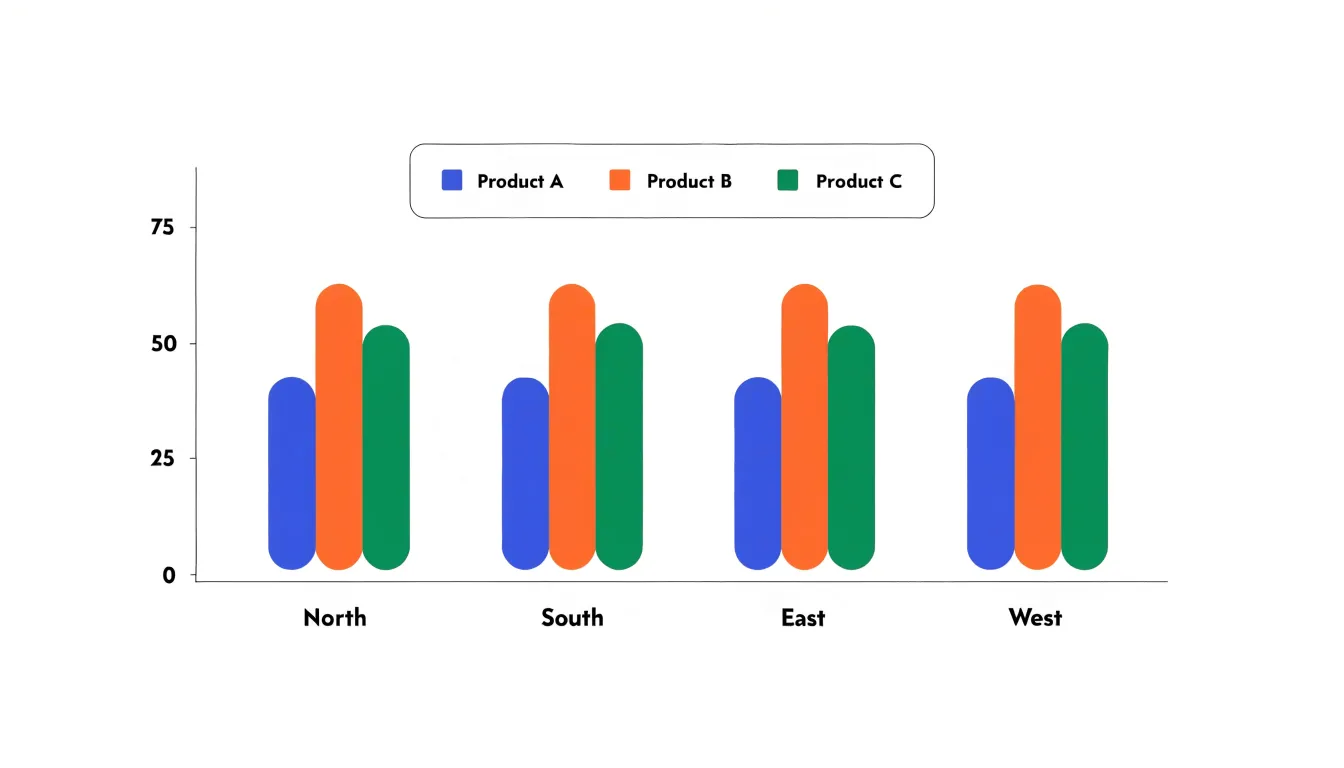
Evaluating relative values in this format depends on a few practical principles. Consistent ordering matters greatly; if the red bar always appears leftmost within each cluster and the blue bar second, readers learn the pattern once and apply it to every group, which speeds comparison considerably. Consistent colour coding across all clusters reinforces this, since a reader tracking one sub-category can follow its position from cluster to cluster. The spacing within a cluster should be tight enough that the bars read as a unit, while the gap between clusters should be noticeably larger, so the grouping structure is immediately apparent.
Scale and baseline choices also shape how easily relative values can be judged. A zero baseline keeps bar lengths proportional to the values they represent, which supports honest visual comparison. When clusters contain many bars, the chart can become crowded, and the individual bars grow thin; in these cases limiting the number of sub-categories per cluster or switching to a different display may preserve legibility. Adding value labels at the bar ends can help where precise figures matter more than quick impressions.
Used with these conventions, grouped bar charts let a reader scan a page and grasp both the pattern within each category and the broader pattern across categories in a single view.
Grouped Bar Chart
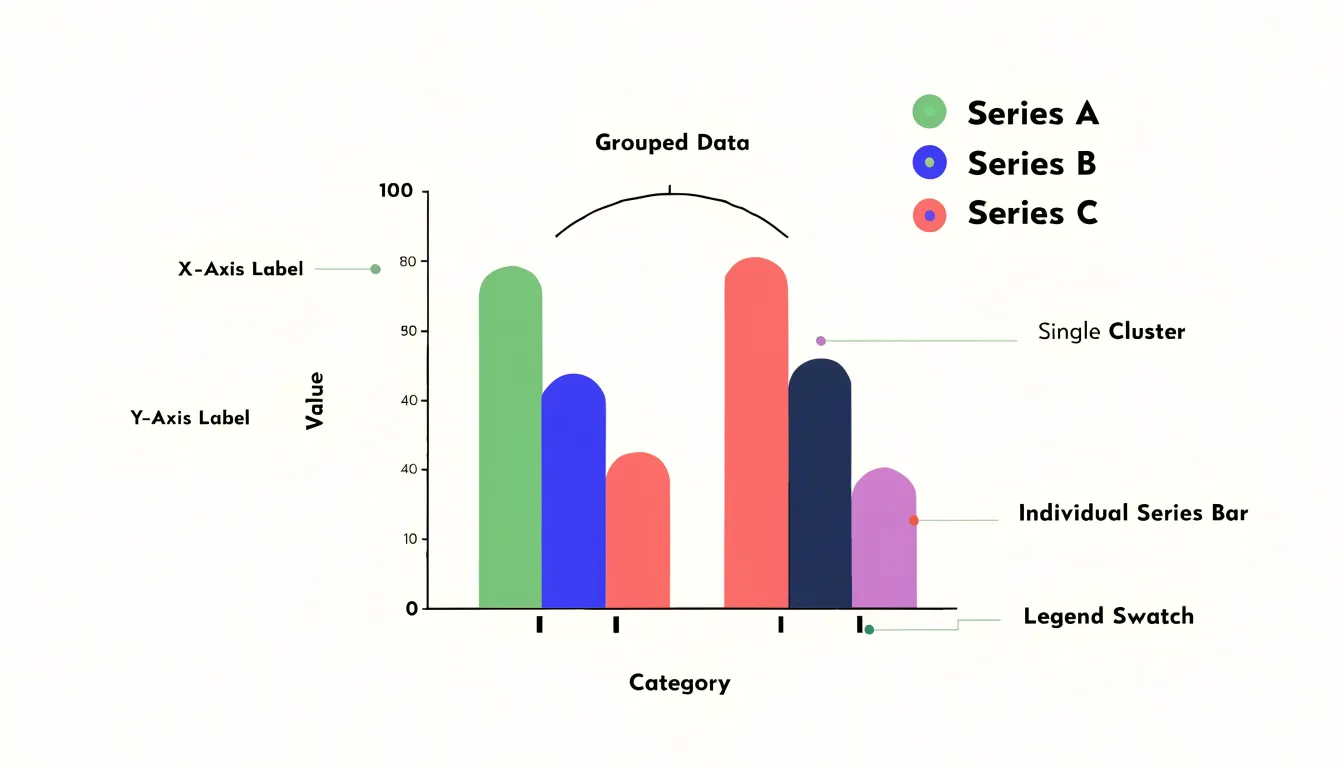
A grouped bar chart arranges its information through several interlocking components, each of which carries a distinct layer of meaning. The category axis, usually running horizontally, establishes the primary divisions in the data. These are the broad subjects under comparison, such as regions, product lines, or time periods. Alongside it, the value axis supplies the measurement scale against which every bar is read, giving viewers a shared reference for judging magnitude. Within each category position, bars are drawn side by side in tight clusters. The cluster is the organizing unit that signals to viewers that these bars belong together and describe the same subject from different angles. The spacing between clusters is deliberately wider than the spacing within them, and this visual rhythm guides the eye so that comparisons happen naturally both inside a cluster and across clusters.
Series colors distinguish the individual bars within each cluster. A consistent color assigned to a series allows viewers to track that series across every category on the chart, following its performance from one group to the next. This color coding transforms a dense field of bars into a set of recognizable strands that can be traced through the whole chart.
The legend keys translate those colors into names. Positioned near the chart, the legend pairs each color swatch with its series label, closing the loop between visual encoding and actual meaning. Without it, colors would be arbitrary; with it, viewers can decode the chart at a glance and confirm which bar represents which data series.
Together these elements let viewers parse a chart that holds many values at once. The axes provide orientation, the clusters establish comparison groups, the colors maintain continuity across categories, and the legend supplies identification. Each component reduces the cognitive effort required, so that patterns, differences, and relative magnitudes emerge clearly even when the underlying dataset is large and multi-dimensional.
Grouped Bar Chart
A grouped bar chart suits data where a categorical dimension and a sub-category dimension intersect with a measurable value. Picture quarterly product sales broken out by region: region forms the primary axis, each quarter becomes a cluster of bars within that region, and bar height encodes sales volume. The structure lets a reader compare bars inside a cluster to see how each quarter performs within a region, then sweep across clusters to compare regions against one another. That two-level comparison is the defining strength of the format, and it is the reason the grouped bar chart appears so often in business reporting and research write-ups.
Common business scenarios include tracking several product lines across store locations, departments, or customer segments in the same period. Marketing teams use grouped bars to compare campaign performance across channels, and finance groups use them to show budget versus actual spending per cost center. In research settings, the format handles experimental designs with a between-subjects factor and repeated measurements, such as average test scores by treatment condition across multiple time points, and survey analysts use it to display response distributions across demographic groups.
The format earns its place when the data has two categorical dimensions plus a numeric measure and the audience needs to compare sub-categories within each primary category. When the goal is simply to show one series across categories, a single-series bar chart keeps the visual cleaner. When the x-axis is a continuous variable such as time and the emphasis is on trend rather than discrete comparison, a line chart communicates the movement more directly. Grouped bars work best with a modest number of sub-categories, typically two to five per cluster, because too many bars within a group make individual comparisons difficult. Limiting the sub-categories and ordering them consistently across clusters lets readers form accurate judgments about relative magnitudes at a glance.
Grouped vs Stacked Bar Chart
Grouped and stacked bar charts each answer a different analytical question, and choosing between them begins with identifying what the chart needs to communicate. A grouped bar chart places bars for each category side by side within a shared category slot, giving every sub-category its own visible baseline. This arrangement supports direct comparison across sub-categories: the eye can trace a single series along the axis, measure one bar against its neighbor, and judge relative magnitudes without any arithmetic. When the analytical goal is to ask which region performed best, which product line grew fastest, or how sub-groups rank against one another, the grouped format keeps each value legible and independent.
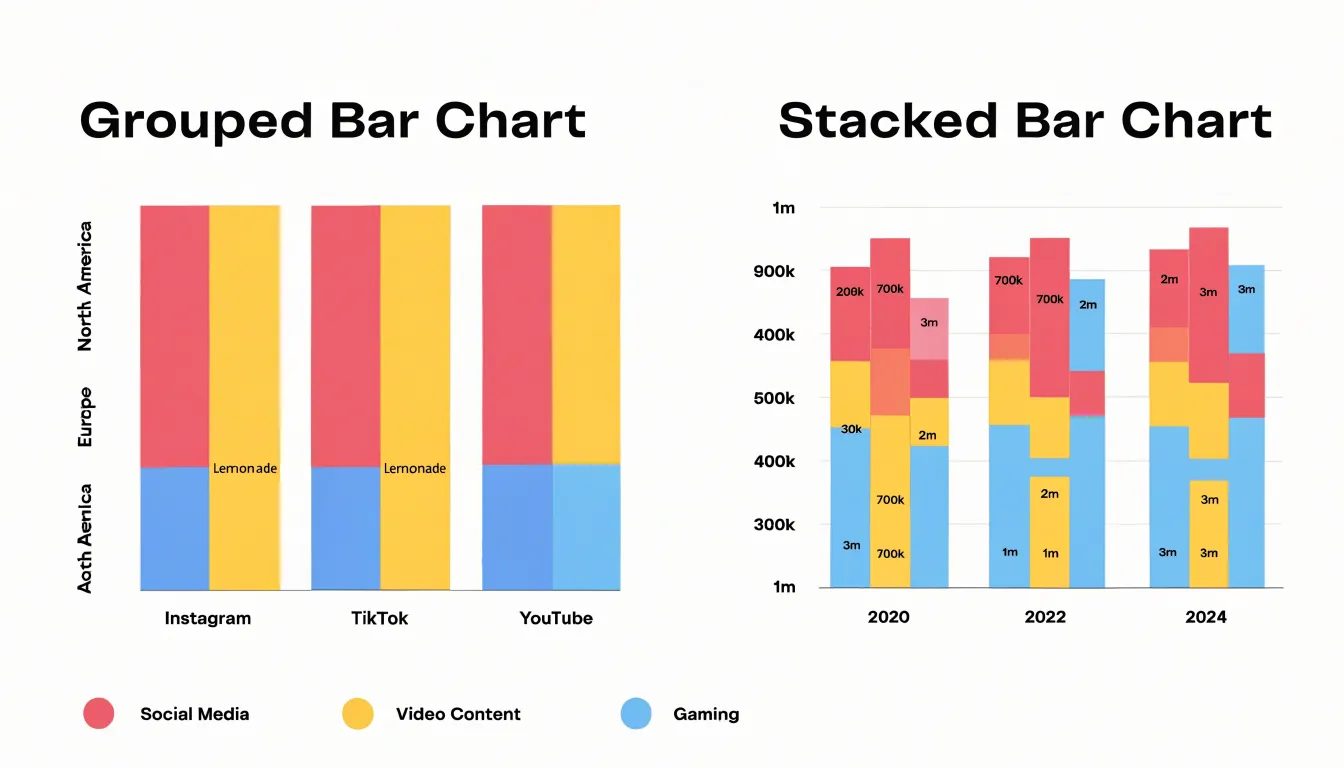
A stacked bar chart instead combines sub-category values into a single bar per category, so the total height represents the aggregate. The format directs attention to the whole and to the composition of that whole. Readers can see how a total divides among its parts, observe shifts in the mix over time, and spot dominant contributors at a glance. Stacked charts suit part-to-whole questions: what share of revenue came from each channel, how the composition of a customer base changed across quarters, or which segment drives the largest portion of a total. The trade-off is that only the bottom segment shares a common baseline, so precise comparison of interior segments becomes harder as stacks grow.
Deciding between the two formats therefore comes down to the specific question being asked. If sub-category comparison is central, grouped bars preserve the clarity needed for side-by-side evaluation. If the total and its internal division matter most, stacked bars communicate composition more efficiently. Practical considerations reinforce the choice: the number of sub-categories, the range of values, and whether totals themselves are meaningful all influence readability. Matching the chart format to the analytical goal ensures the visualization highlights the patterns the audience needs to see.
Grouped Bar Chart
Structuring your data correctly is the foundation of any effective grouped bar chart. Before opening your visualization software, take time to organize the raw spreadsheet data into a clean format that the charting tool can interpret without ambiguity. Most tools accept two layout conventions: wide format and tall format. In wide format, each row represents a category, and each column holds the values for a separate series. For example, a row might list a product name, followed by columns for quarterly sales figures. This layout reads naturally on a spreadsheet and works well when each series appears as its own column. Tall format, by contrast, stacks observations vertically, with one column for the category, one for the series name, and one for the numeric value. This structure suits tools that expect long-form data and makes it easy to add new series without restructuring the sheet.
Whichever format you choose, keep categorical rows consistent. Every category label should appear exactly once per group and match the labels used elsewhere in your dataset. Avoid merged cells, blank rows, and stray notes inside the data range, since these confuse parsing logic. Numerical series columns should contain only numbers, with no units or symbols mixed into the cells; place units in the column header instead. Give each series column a clear, descriptive header, and keep headers on a single row so the software can detect them reliably. Check that each row has a value for every series, or deliberately leave cells empty where data is missing so the chart reflects genuine gaps rather than zeros. A quick review of these details before charting saves considerable troubleshooting later and ensures your grouped bars render accurately.
Grouped Bar Chart
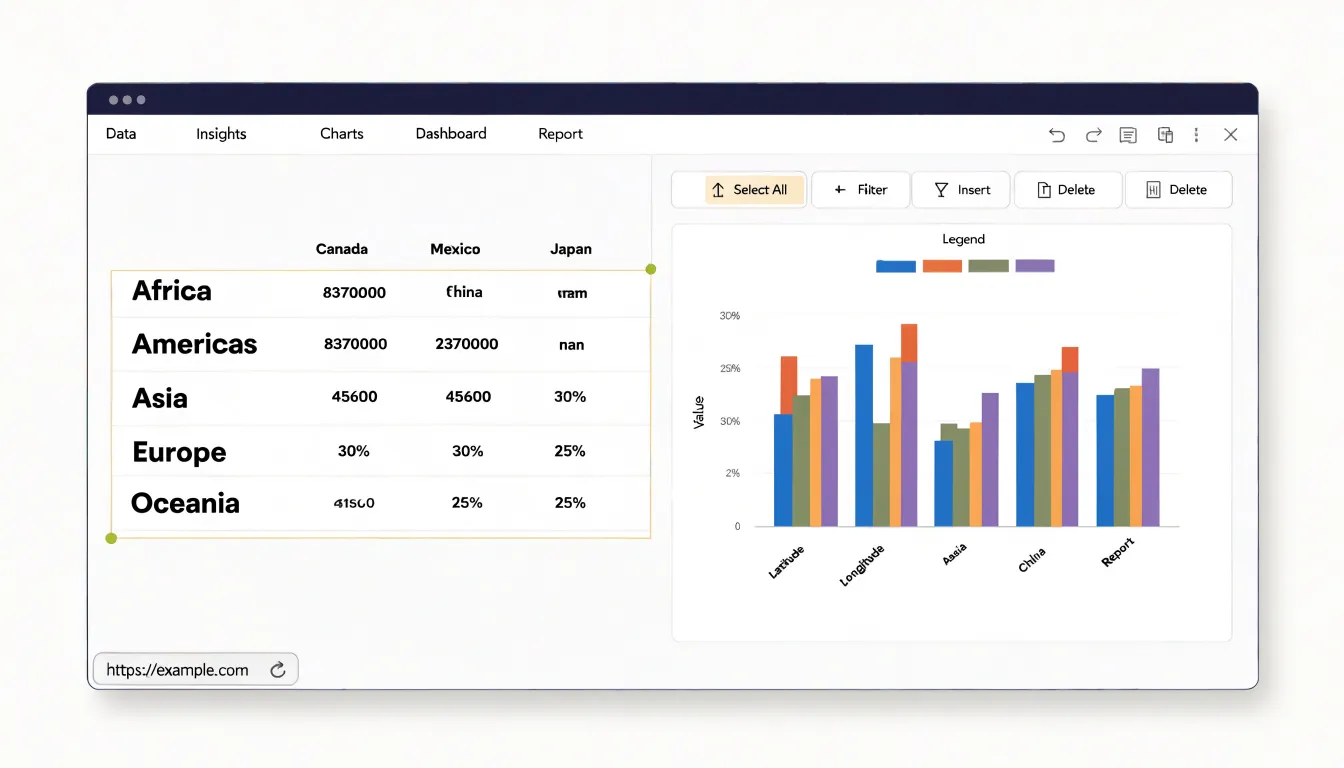
Creating a grouped bar chart in a spreadsheet platform begins with preparing your data in the right structure. You want your categories arranged in the first column or row, with each group represented by its own adjacent column or row of values. For example, if you are comparing quarterly sales across three regions, list the quarters down the first column and place each region’s figures in separate columns beside them. Once the data is laid out cleanly, highlight the entire range, including the category labels and the header row, so the software can identify both your series and your axis labels.
With the range selected, move to the Insert menu and locate the chart options. In Excel, click the chart icon or navigate to Insert > Chart and choose the Clustered Bar or Clustered Column type from the bar chart family; the clustered variant is the one that places bars side by side within each category. In Google Sheets, select Insert > Chart, then open the Chart editor and pick the Bar chart type, switching the chart subtype to Clustered. Both platforms usually detect your groupings automatically when the data is structured properly, but you should confirm that the series appear as separate colored bars rather than a single stacked column.
After the chart appears, take a few minutes to adjust the initial layout. Add or edit the chart title so it describes the comparison being shown, and check that the legend labels each group correctly. In Excel, use the Chart Design and Format tabs to refine elements; in Sheets, the Customize panel offers similar controls. You can reposition the legend, adjust axis titles, tweak bar spacing, and modify colors to improve readability. Saving this adjusted version as a template can streamline future reports that use the same structure.
Grouped Bar Chart
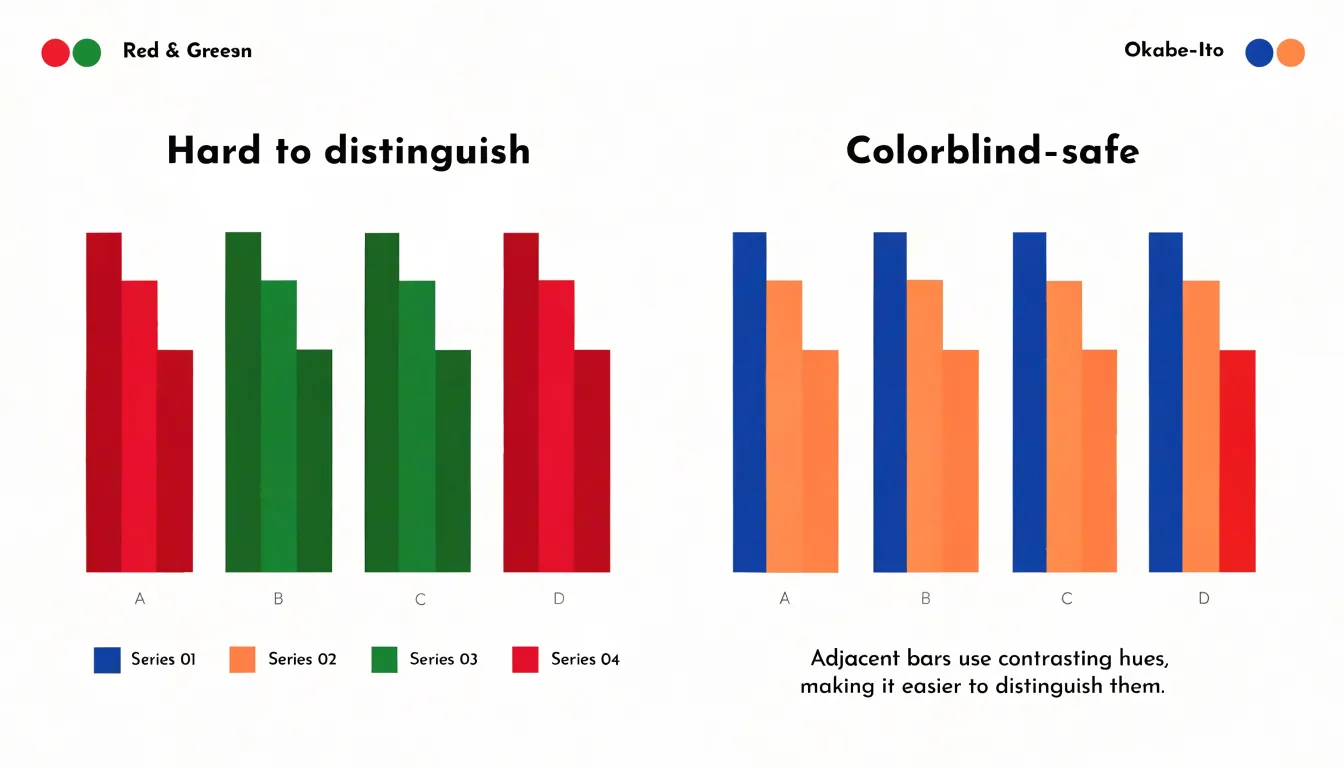
Color in a grouped bar chart carries the primary burden of distinguishing one data series from another, so palette selection deserves deliberate attention rather than a default choice. The first tactic is to assign colors that differ meaningfully in hue rather than merely in shade, because adjacent bars of similar lightness read as a single block when viewed at a glance or from a distance. A palette built around well-spaced hues—say a deep blue, an orange, and a green—lets each series claim a distinct visual identity. The second tactic is to balance saturation and lightness across the palette so that no single series dominates the chart purely through visual weight; series of equal importance should feel equally prominent. Roughly nine percent of viewers experience some form of color vision deficiency, and red-green combinations in particular collapse into near-identical tones for them, so selecting pairs from opposite ends of a colorblind-safe spectrum, such as blue and orange, keeps every series legible. Tools like the Okabe-Ito palette offer tested starting points that hold up under deuteranopia and protanopia simulation. Contrast also matters against the background and between bars: a light gray gridline should never compete with a saturated fill, and fills should reach at least a 3:1 contrast ratio with the chart surface. A practical check is to render the chart in grayscale; if two series merge into the same value, the palette needs revision, and redundant encoding through a legend, direct labels, or varied pattern fills can carry the distinction when color alone falls short. Limiting the palette to five or six distinct hues keeps the chart readable without overwhelming the viewer.
Grouped Bar Chart
Clear labeling transforms a grouped bar chart from a puzzle into an immediately readable comparison. Begin with category labels on the horizontal axis. Each label should be short enough to sit comfortably beneath its cluster without rotation where possible; two or three words usually suffice. Where category names are long or technical, abbreviate consistently and define the abbreviations in a note or in the surrounding text. Avoid repeating words shared by every label, since the axis title can carry the common term while the tick labels show only the distinguishing part. Keep capitalization and formatting uniform across all labels so the reader’s eye glides down the axis without interruption.
Axis scales deserve equal care. Start numeric axes at zero for bar charts, since bar length encodes magnitude and a truncated baseline distorts perceived differences between groups. Choose tick intervals that produce a small number of readable values, typically four to six, and keep decimal precision consistent along the axis. Label each axis with a concise title that names the measure and its unit, such as revenue in thousands of dollars, so individual tick labels need not repeat units. For grouped bars representing counts or percentages, confirm the scale accommodates every series, including the tallest bar in each cluster.
Legend placement should follow the reading order of the chart. A horizontal legend directly above the plot keeps series colors visible before the reader scans the bars, while a vertical legend to the right works well when series names are longer. Position the legend close to the data it explains and align it with the plot edges. Limit the number of series so the legend stays compact, and order legend entries to match the order of bars within clusters. Remove redundant gridlines, heavy borders, and background fills that compete with the bars. Every element retained should help the reader decode the comparison quickly, leaving the data pattern as the most prominent feature of the chart.
Grouped Bar Chart
Bar width and spacing are the primary levers for controlling the visual rhythm of a grouped bar chart. Within each cluster, the width of the individual bars determines how much ink each category receives and how easily adjacent bars can be compared. When bars are too wide, they crowd each other, leaving thin slivers of white space that make the cluster feel dense and difficult to parse. When bars are too narrow, the eye struggles to register each bar as a distinct quantity, and the chart begins to read as a collection of scattered lines rather than solid comparative elements. A useful starting point is to allocate roughly seventy to eighty percent of each cluster’s horizontal band to the bars themselves, distributing that share evenly across the number of series in the group, and letting the remaining percentage form the internal gaps between bars.
The spacing between clusters carries equal weight. Gaps that are too tight cause neighboring groups to blur together, so the reader loses the categorical boundaries that give the chart its structure. Gaps that are too generous push the groups apart until the chart feels fragmented and airy, forcing the eye to travel long distances to make comparisons that should feel immediate. A common rule is to make the inter-cluster gap noticeably larger than the intra-cluster gap, often around one and a half to two times the width of a single bar, so the grouping is legible at a glance without wasting horizontal space.
These adjustments interact with the total chart dimensions and the number of categories. Adding series or categories shrinks the space available to each element, which may call for narrower bars or a wider canvas. Reading the chart at its final display size, rather than on a large editing screen, is the most reliable way to judge whether the balance holds, since spacing that looks comfortable at full resolution can collapse into clutter when the chart is scaled down for a report or dashboard.
Grouped Bar Chart
One of the most frequent problems in a grouped bar chart arises from plotting too many sub-groups within each category. When a chart carries five, six, or more bars per group, the visual comparison that bar charts are meant to support collapses. Readers cannot easily track which bar belongs to which sub-group across categories, and the legend becomes a memory test rather than a guide. A practical solution is to limit each group to a small number of sub-groups, typically three or four, and to consider splitting a crowded chart into several smaller charts or switching to a different form of display when the sub-group count keeps growing. Reducing the number of series often clarifies more than any amount of styling can.
Axis handling is another common source of distortion. Truncating a bar chart’s value axis so that it starts above zero exaggerates differences between bars, because the length of each bar no longer corresponds proportionally to the value it represents. Bars encode magnitude through length, so a non-zero baseline misleads readers about the relative size of the categories. The quick fix is to keep the axis anchored at zero for bar charts, reserving truncated scales for line charts where position, rather than length, carries the meaning. When small differences genuinely matter, annotating the values directly is a safer route than compressing the axis.
Clutter from redundant labels rounds out the list of frequent flaws. Repeated axis titles, duplicated legends, data labels on every bar, and decorative gridlines all compete for attention without adding information. A cleaner approach is to label only what readers need, remove legends when direct labeling of series is possible, and strip gridlines or background shading that do not help comparison. Each element should earn its place by aiding interpretation. Applying these fixes quickly produces a chart that is easier to read, more honest about its data, and better suited to the comparisons it was built to support.
Grouped Bar Chart
A grouped bar chart organizes survey data so that each category of respondents receives its own cluster of bars, with each bar inside the cluster representing a different response option. This structure suits polling data particularly well, since a single question usually produces several answer choices that need to be compared across multiple demographic cohorts such as age bands, regions, or income levels. Placing the cohorts along the horizontal axis and the response options as adjacent bars within each group lets readers trace two dimensions of variation at once: how opinions differ between cohorts, and how the distribution of answers shifts within each cohort.
Effective presentation begins with a consistent color scheme. Assigning one fixed color to each response option across every cluster allows the eye to follow, for example, the ‘strongly agree’ bar from the youngest cohort through to the oldest without consulting the legend repeatedly. Ordering the bars within each group in the same sequence, typically from most positive to most negative response, reinforces that consistency. Where the survey uses a Likert scale, keeping the natural progression of the scale intact preserves the logic of the data.
Demographic breakdowns often involve many cohorts, and crowding becomes a real risk. Rotating category labels, shortening response names to concise abbreviations, and limiting each chart to a manageable number of groups all help. When dozens of subgroups exist, it may be better to split the data across several smaller charts than to compress everything into one dense panel. Adding value labels directly above the bars can replace a separate data table, provided the numbers remain legible.
Finally, annotation supports interpretation. A short subtitle stating the sample size and fieldwork dates, a clear statement of the question asked, and an axis label giving percentages rather than raw counts all help readers judge the results accurately. Cross-tabulated survey metrics reward careful chart design, and the grouped bar chart remains one of the clearest ways to deliver them.
Grouped Bar Chart
When a grouped bar chart contains many categories, readability quickly deteriorates. Bars become thin, labels overlap, and the chart turns into a dense thicket that obscures patterns. To preserve clarity, several strategies can be employed. One effective approach is to switch to a horizontal orientation. By placing categories along the vertical axis, labels can be displayed horizontally, reducing the need for rotation and making them easier to read. Horizontal layouts also accommodate long category names without truncation and allow the chart to grow vertically as needed, which is often more natural for scrolling or printing.
Another strategy is to aggregate long-tail groups. In datasets with numerous categories, many often have small values that contribute little to the overall story but add visual clutter. Grouping these minor categories into an “Other” or “Miscellaneous” category can simplify the chart while preserving the main insights. This aggregation should be done thoughtfully, ensuring that the grouped category is clearly labeled and that the underlying data is still accessible if needed.
Additionally, techniques such as sorting bars by value, using consistent color schemes, and providing interactive elements like tooltips or filtering can further enhance readability. Sorting helps viewers quickly identify the largest and smallest groups, while a limited color palette reduces visual noise. Interactive features allow users to explore details without overwhelming the initial view.
Ultimately, the goal is to ensure that complex visual charts remain interpretable. By applying these strategies, analysts can present large datasets in a way that highlights key comparisons and trends without sacrificing the richness of the data. This balance between detail and clarity is essential for effective data communication.
Frequently Asked Questions
What is a grouped bar chart used for?
A grouped bar chart is well suited to showing how several sub-categories perform relative to each other within the same category. It lets a reader compare bars inside a cluster and then compare patterns across clusters in a single view.
How should I order and space the bars in a grouped bar chart?
Use consistent ordering and consistent color coding across all clusters so readers can learn the pattern once and follow each sub-category from cluster to cluster. Keep spacing within a cluster tight enough that the bars read as a unit, and make the gap between clusters noticeably larger.
Should a grouped bar chart start at zero?
Yes, numeric axes for bar charts should start at zero because bar length encodes magnitude and a zero baseline keeps bar lengths proportional to the values they represent. Truncating the value axis above zero exaggerates differences between bars.
How many bars should be in each cluster in a grouped bar chart?
Grouped bars work best with a modest number of sub-categories, typically two to five per cluster. When groups have five, six, or more bars, the chart can become crowded, and limiting each group to about three or four or switching to a different display may help.
How do I make a grouped bar chart in Excel or Google Sheets?
Lay out categories in the first column or row with each group in adjacent columns or rows, then highlight the range including category labels and the header row. In Excel, use Insert > Chart and choose Clustered Bar or Clustered Column; in Google Sheets, use Insert > Chart and set the Bar chart subtype to Clustered.
How can I keep a grouped bar chart readable when there are many categories?
For many categories, switch to a horizontal orientation so labels can be displayed horizontally, and consider aggregating long-tail groups into an “Other” or “Miscellaneous” category. Sorting bars by value, using consistent colors, and providing interactive elements like tooltips or filtering can further enhance readability.
Tony Astor
Tony writes about data visualization and the tools people use to build charts and dashboards. More about Data Illustrator