Gestalt Principles in Data Visualization
 By Tony Astor ·

Gestalt Principles in Data Visualization
Gestalt principles in data visualization are perceptual rules—proximity, similarity, enclosure, closure, continuity, figure-ground, focal point, symmetry, and common fate—that describe how viewers group and interpret visual elements. Designers apply them to organize charts so the brain reads hierarchy instantly, reducing cognitive load and guiding attention to the most important data without extra labels.
Table of Contents
- Visual Perception Basics
- The Law of Proximity
- The Principle of Similarity
- The Rule of Enclosure
- The Concept of Closure
- The Law of Continuity
- Figure and Ground
- The Principle of Focal Point
- The Law of Symmetry
- The Power of Common Fate
- Color Harmony in Charts
- Common Design Mistakes
- Practical Chart Audits
- Mastering Visual Storytelling
- Building Intuitive Dashboards
Visual Perception Basics
When a viewer encounters a busy chart, the brain begins sorting the scene before conscious attention engages. This early stage of vision, known as pre-attentive processing, operates in parallel across the entire visual field. Within a fraction of a second, the visual system registers fundamental attributes such as color, orientation, size, position, and shape. These features are detected rapidly and without deliberate effort, allowing the eye to pick out a red marker among gray ones or a steep line among shallow ones almost instantly. Pre-attentive vision functions as a first-pass filter, separating what stands out from what recedes into the background.
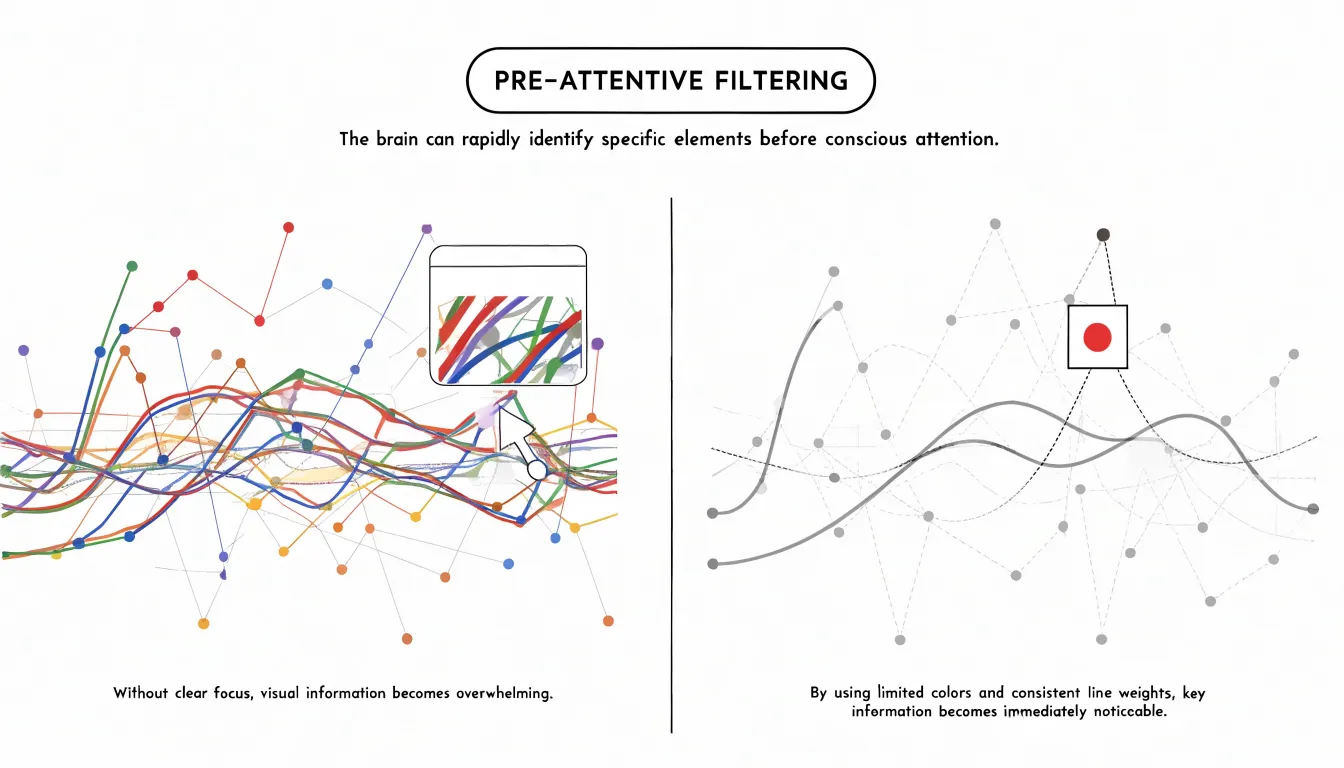
The limits of this filter matter for chart design. Pre-attentive processing handles a small number of distinct features efficiently, yet it falters when many attributes compete for the same visual channel. A chart crowded with dozens of colors, varied line weights, and clashing shapes forces the brain to switch from parallel scanning to slow, serial inspection. At that point, working memory takes over, and the viewer must consciously compare, hold, and discard elements one at a time. This shift explains the familiar sensation of information overload: the chart contains more distinctions than the early visual system can resolve at a glance.
Visual order counteracts this overload by organizing the display around a clear hierarchy. Consistent use of color, alignment, grouping, and spacing lets pre-attentive processing do its work on the attributes that carry meaning, while secondary details stay visually quiet. When related elements share a common visual treatment, the brain groups them automatically and treats them as a single unit, reducing the number of separate items competing for attention. The result is a chart that can be read in stages, with the overall pattern available immediately and the finer details accessible on closer inspection.
The Law of Proximity
The Law of Proximity describes a fundamental perceptual tendency: when elements sit close together in space, viewers instinctively read them as belonging to the same group. In data visualization, this principle governs how charts, dashboards, and infographics are parsed before any label is consciously read. A scatter plot with points bunched in one corner will be seen as a single cluster even if those points represent distinct categories, while points spread evenly across the plot read as an undifferentiated field. Designers can harness this habit by positioning related metrics, legend items, or data series near one another so that spatial arrangement communicates structure without extra text.
The practical leverage of proximity lies in spacing. Small gaps signal relationship; larger gaps signal separation. A dashboard that places revenue, cost, and profit tiles in tight horizontal alignment invites the viewer to compare them as one coherent financial story, whereas scattering those same tiles across the layout forces the eye to work harder to assemble the connection. Within a single chart, axis labels placed close to their tick marks belong to them, while an ambiguously positioned floating caption may be misattributed to the wrong element. White space is an active design material because the distance between elements carries as much meaning as the elements themselves.
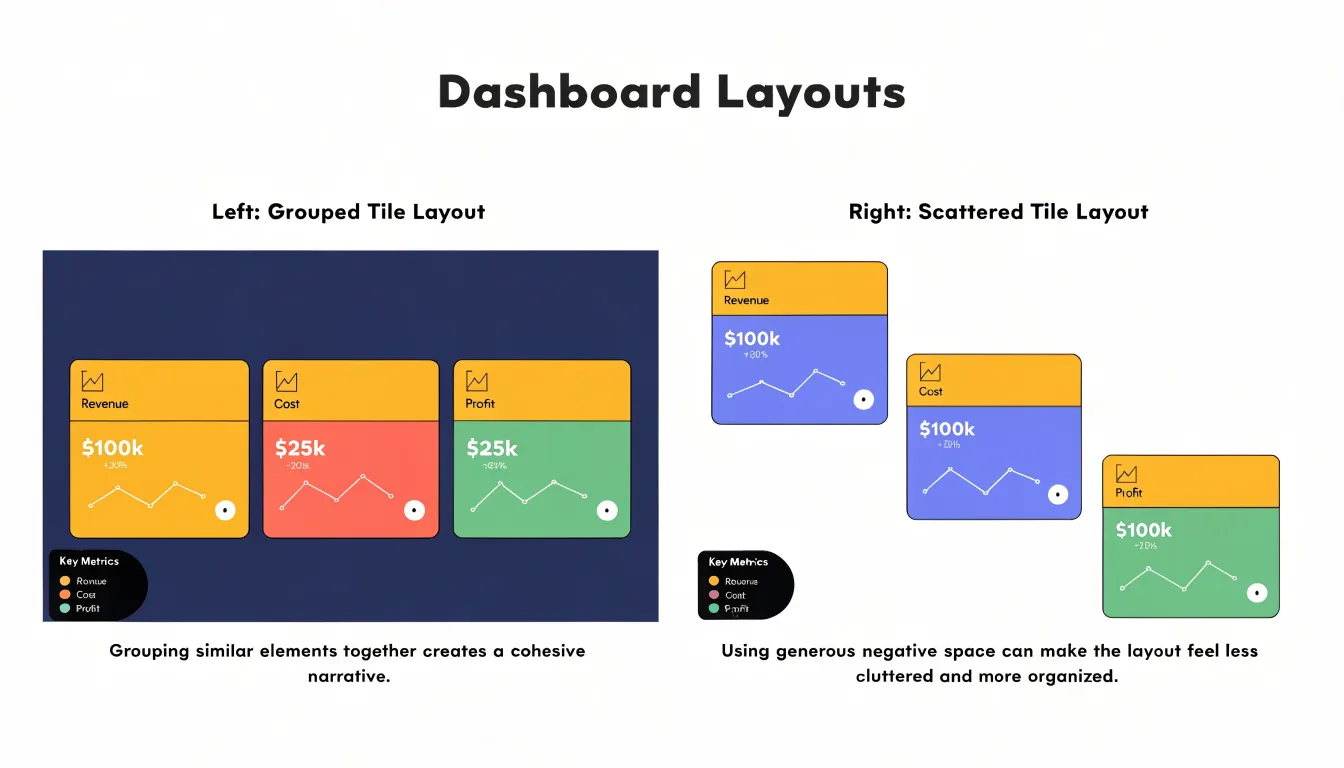
Proximity also shapes how viewers infer categories when explicit labels are absent. In a clustered bar chart, tight spacing within each cluster and wider spacing between clusters tell the reader which bars belong to the same period or condition. When designers space bars uniformly across a grouped comparison, the visual grouping dissolves and readers must fall back on color or legend lookup.
The Principle of Similarity
The Principle of Similarity states that elements sharing visual characteristics—such as color, shape, or size—are perceived as belonging to the same group, even when they are far apart on the screen.
Color is perhaps the most effective attribute for encoding similarity. In a multi-series line chart, using the same hue for a series’ line and markers makes it easy to trace across the plot. In a scatter plot, coloring points by category reveals clusters and patterns that transcend spatial location.
Shape offers another dimension when color is unavailable or when additional categories must be distinguished. Different symbols—such as circles, squares, or triangles—can represent distinct categories. Combining color and shape can reinforce groupings, though it must be done carefully to avoid visual clutter.
For similarity to work, the same visual attribute must be applied uniformly to all elements of a category, and distinct attributes must be sufficiently different to avoid confusion.
The Rule of Enclosure
The Rule of Enclosure describes our strong tendency to perceive elements that share a visible boundary as belonging to the same group. When a chart uses shaded regions, subtle cards, or bounding boxes to surround a set of data, the viewer reads that boundary as an assertion of relationship. The enclosed items form a perceptual unit, distinguished from neighboring elements even when color, shape, and position offer no other cue. This makes enclosure a powerful way to organize a crowded display without adding marks that compete with the data itself.
The Concept of Closure
The Gestalt principle of closure describes the human tendency to perceive incomplete shapes as complete forms. When a viewer encounters a partial outline, the visual system supplies the missing segments and perceives a whole object rather than a fragmented collection of lines. Because of this habit, designers can remove structural elements—such as heavy gridlines, borders, and enclosing frames—that add visual noise and compete with the data marks.
Consider a line chart bounded on all four sides by a heavy box and subdivided by a dense grid. Strip away the top and right borders, and the remaining axes still imply a complete frame; the mind extends the lines to close the figure. Fade the gridlines or remove all but a few reference lines, and the data points and line segments remain legible because the eye connects nearby marks into continuous paths on its own. Similarly, bars in a bar chart need no outline to be read as rectangles, and scatter plot clusters remain perceptible even when points are small and unenclosed.
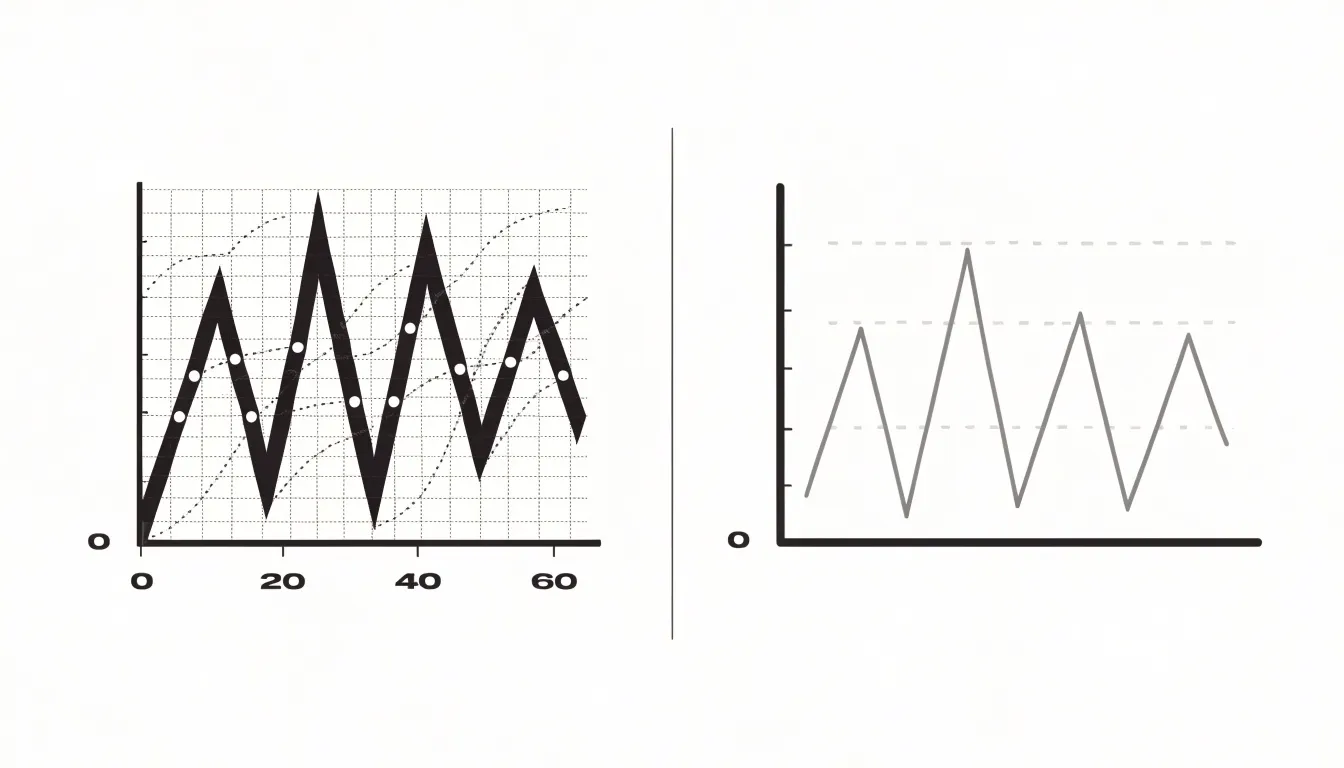
Working with closure encourages restraint. Each element kept on the canvas should earn its place by carrying information or aiding interpretation, providing just enough visual structure for the reader’s perceptual system to complete the picture.
The Law of Continuity
The Law of Continuity describes how people naturally perceive elements arranged along a continuous line or curve as belonging together. Aligning axes, labels, and trend lines along smooth, predictable paths creates visual highways that lead the eye from one insight to the next.
In a multi-series line chart, smooth lines following consistent directions allow viewers to quickly trace each series and compare their shapes. Abrupt changes in direction or breaks in the line disrupt this continuity, forcing the eye to jump. In a scatter plot, a gently curving trend line reinforces the relationship being shown. Axis labels and tick marks also benefit from continuity: aligning them along the axis line and spacing them evenly creates a natural reading path, whereas staggered or misaligned labels make the viewer work harder to connect values to positions.
Across a dashboard or infographic, positioning related charts along a shared visual axis, or using consistent colors and line styles that flow from one panel to the next, helps the audience follow the narrative. A time series that continues from one chart to the next without interruption allows seamless trend tracking, and a highlighted line curving toward a key data point acts as a visual arrow leading directly to the insight. Applying continuity in practice means avoiding unnecessary breaks, zigzags, and misalignments.
Figure and Ground
Figure and ground is the perceptual mechanism that separates an object of focus from the surface behind it. In a chart, the figure is the data itself (lines, bars, or points), while the ground is the supporting structure: plot background, gridlines, axes, borders, and legends. When this separation is weak, viewers expend extra effort to determine what deserves attention.
- Contrast: Data marks should carry the strongest visual weight through darker tones, saturated hues, or thicker strokes, while supporting elements recede through lighter grays and thinner lines. Pale gridlines guide the eye without competing with plotted series, and axes and labels work best when sitting quietly at the edges.
- Opacity: Translucent fills, such as confidence bands or highlighted regions, keep underlying structure visible while primary series remain legible on top. Ordering overlapping marks by transparency clarifies dense areas without obscuring individual observations.
- Layering: Elements drawn in front with crisp edges and full saturation read as foreground, while softened or muted elements settle into the background. Annotations, callouts, and emphasized data points can be lifted above the rest of the chart to direct attention where the narrative requires it.
The Principle of Focal Point
The Principle of Focal Point describes how a visual field organizes itself around a single element that stands apart from its surroundings. When one mark differs sharply from its neighbors in color, size, or position, viewers register it through pre-attentive processing before reading a single label.
Selective color is the most common way to establish a focal point: rendering a single bar in a saturated accent hue against muted grays tells the viewer where to look first while everything else recedes into supporting context. Size works similarly: enlarging a marker, thickening a line, or adding an annotation bubble around a specific value creates a hierarchy in which the emphasized element dominates. These techniques are especially valuable in dashboards, where several charts compete for attention and users need to locate the primary signal within seconds.
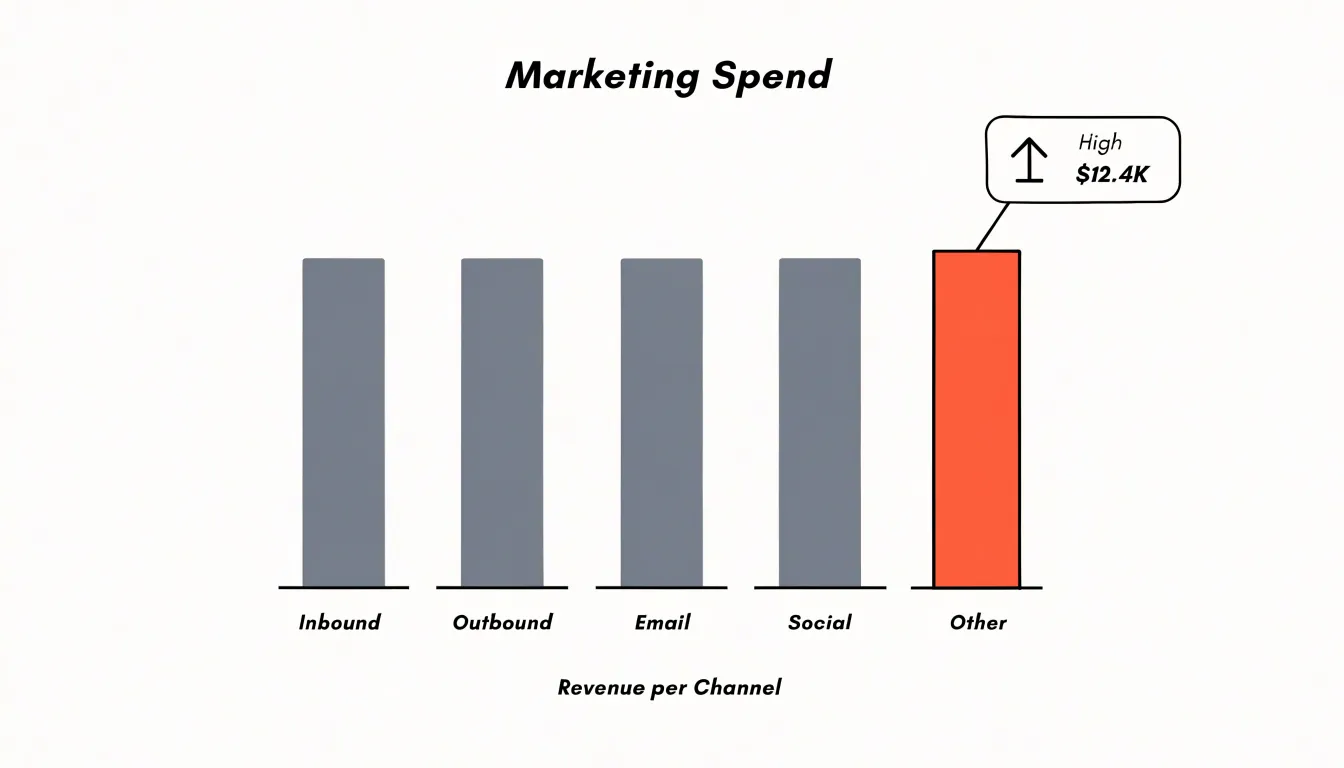
A focal point functions through contrast, so its effectiveness fades when many elements receive equal emphasis. Applying bright colors or large callouts to every series produces visual noise in which nothing stands out. Restricting emphasis to one or two elements per view keeps the rest of the composition quiet enough for the focal point to register.
The Law of Symmetry
The Law of Symmetry describes the tendency to perceive objects as organized around a central point or axis, with mirrored elements read as a unified, stable whole. Because the eye does not need to reconcile mismatched shapes or uneven distributions, symmetry reduces visual tension and frees cognitive resources for interpreting the data.
Symmetry also builds trust. Evenly weighted and consistently arranged elements signal deliberate organization, whereas uneven visual weight can suggest that certain information was prioritized arbitrarily. Furthermore, mirrored axes, paired categories, and evenly spaced elements make differences between data points stand out cleanly. A viewer can compare left against right or top against bottom without adjusting for an unbalanced frame—a structure particularly useful for side-by-side breakdowns, small multiples, and categorical charts where each group deserves equal footing. Designers apply this by centering axes meaningfully, matching the scale of opposing elements, and distributing visual weight evenly across the canvas.
The Power of Common Fate
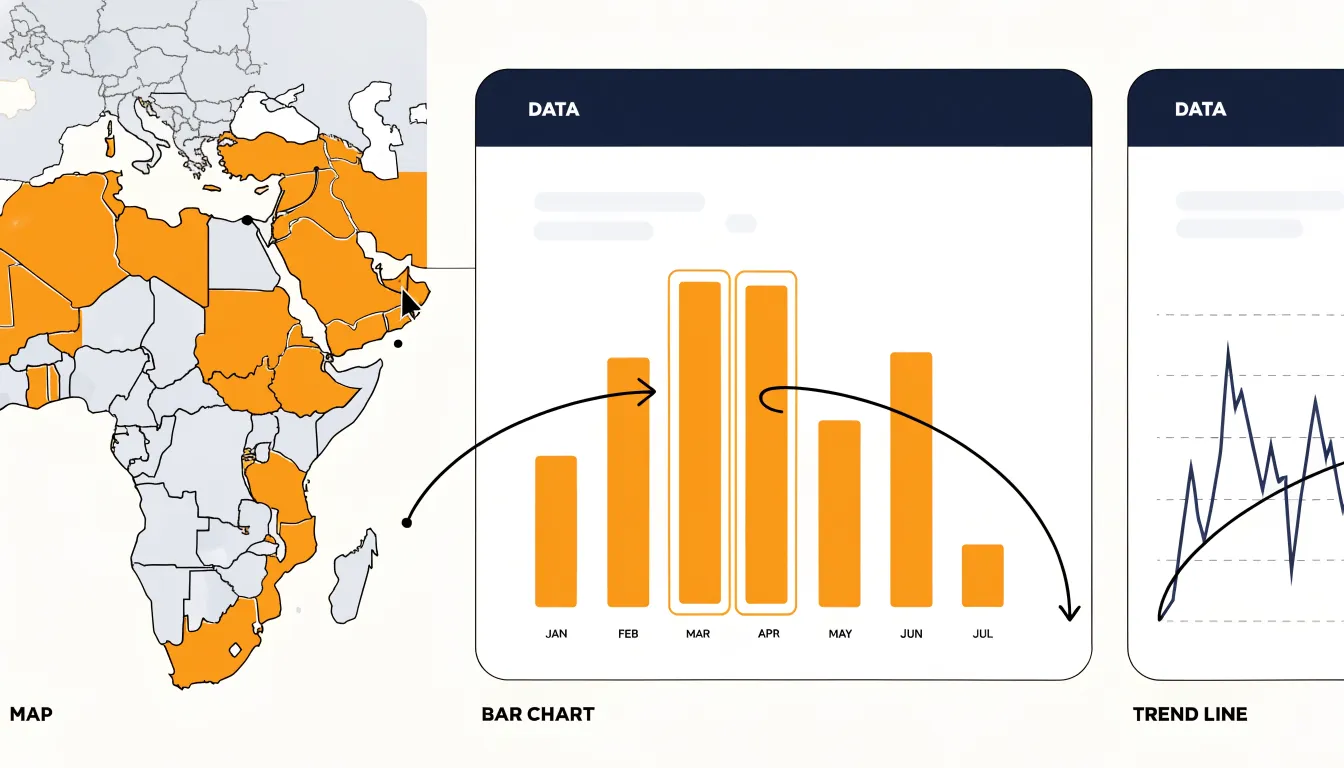
Common fate is the tendency to perceive elements that move together as belonging to the same group. In interactive dashboards, synchronized motion operates alongside color, shape, and proximity as an immediate grouping cue: when chart elements shift in the same direction at the same time, viewers read them as sharing a single data stream, category, or entity.
For example, when a user hovers over a map region and the matching bars in a companion chart and line in a trend view animate in unison—rising, sliding, or highlighting together—the user perceives all three as views of one underlying record. Because dashboard users scan, compare, and cross-reference across panels, a cursor sweep that triggers a shared sliding transition reinforces these links in working memory and builds a mental model of the data’s organization.
Direction carries meaning as well. If elements in a stream consistently enter from one side and exit toward another, that directional pattern becomes a recognizable signature. A filter change that sends related marks drifting leftward while unrelated elements stay still communicates grouping and change in a single gesture. Choreographing timing, easing, and travel paths so that only related elements move in step lets movement itself explain the structure of the data.
Color Harmony in Charts
A cohesive color palette should mirror the conceptual groupings in the data, letting the eye cluster related categories—such as regions within one market or steps in a single process—through the principle of similarity.
Nominal categories call for equally distinct hues, while ordered categories benefit from a graded sequence in which lightness or saturation shifts steadily. Keeping the number of hues modest prevents color fatigue, and pairing muted base colors with a few saturated accents keeps attention on the values that matter most.
Accessibility adds a critical constraint: roughly one in twelve men has some form of color vision deficiency, so relying on red and green alone leaves a large share of the audience unable to read the chart. Palettes that vary in lightness as well as hue remain distinguishable under most forms of color blindness, and pairing color with consistent shape, pattern, or direct labeling provides a redundant cue. Strong contrast against the background is also essential so fills do not vanish on projectors or printed pages. Establishing a fixed set of named colors, tested for contrast and colorblind simulation, keeps multi-chart reports visually coherent.
Common Design Mistakes
Many chart errors stem from a mismatch between how a graphic is built and how perception reads it:
- Conflicting visual cues: When a single element sends two different signals—such as a saturated color implying urgency while a separate shape encodes another dimension entirely—attention scatters and interpretation slows. Map a single visual property to a single data dimension to keep meaning anchored.
- Over-enclosure: Drawing heavy borders around every element, boxing each metric into its own frame, or stacking panels inside panels forces the eye to parse a maze of boundaries. Because strong contours create perceptually separate objects, excessive framing fragments a unified picture into structural noise. Reserve enclosure for genuine grouping, and let proximity and alignment do the rest.
- Ambiguous spatial spacing: Irregular label alignment, uneven margins, and inconsistent gutters trigger the proximity principle involuntarily, causing the eye to cluster unrelated items and separate related ones below conscious awareness. Use consistent gaps within a group, larger gaps between groups, and alignment that reflects the data’s structure.
Practical Chart Audits
Before publishing a chart, a structured audit confirms that the Gestalt cues you intended are the ones viewers actually perceive:
- Step back for the first-seconds impression: Ask what the graphic communicates immediately, since audiences in feeds or slide decks often encounter visuals only briefly.
- Run the squint test: Blur your vision or view the chart from a distance until fine detail dissolves. What remains reveals the dominant shapes, strongest clusters, and darkest marks. If a secondary element dominates your key message, or if unrelated elements blur into a single mass, adjust your spacing, similarity, or contrast cues.
- Perform a color removal check: Convert the chart to grayscale to see whether groupings survive. This exposes over-reliance on hue and tests whether luminance differences carry the structure on their own.
- Trace the reading path: Note where your eye lands first, second, and third. Verify that prominent titles, bold annotations, and high-contrast marks guide attention toward the primary comparison rather than scattered decoration.
- Test with a fresh pair of eyes: Show the chart to a colleague for five seconds, hide it, and ask what they remember. Document what you adjust across iterations to sharpen immediate clarity.
Mastering Visual Storytelling
Effective visual storytelling integrates multiple Gestalt laws so they reinforce one another rather than compete. In a sales performance dashboard, for instance, proximity can cluster regional data, similarity can color-code product lines, enclosure can highlight a critical subset, and continuity can show trends over time. As long as these cues point in the same direction—avoiding conflicts where proximity suggests one grouping and similarity suggests another—the visual hierarchy becomes self-evident and the narrative unfolds intuitively.
Building Intuitive Dashboards
At the macro scale of a dashboard, Gestalt principles organize individual charts into a single coordinated instrument:
- Proximity: Clustering related charts with tight, consistent spacing while placing unrelated modules further apart establishes functional zones before a single label is read.
- Similarity: Shared color palettes, typography, and chart styling unite related panels—such as all revenue metrics versus all operational metrics—into distinct visual families.
- Enclosure and Common Region: Subtle background cards wrap related content into navigable containers, and grouping panels that share filters or date selectors makes them read as one coordinated display.
- Figure-Ground: Neutral canvas backgrounds and whitespace recede so active data surfaces come forward.
- Symmetry and Continuity: Predictable vertical and horizontal grid anchors, aligned edges, and repeated chart positions create an implied reading path from summary tiles at the top to finer detail below.
Frequently Asked Questions
What is pre-attentive processing in data visualization?
Pre-attentive processing is the early stage of vision that operates in parallel across the entire visual field within a fraction of a second. It registers attributes such as color, orientation, size, position, and shape rapidly and without deliberate effort.
How does the Law of Proximity affect chart and dashboard design?
The Law of Proximity means viewers instinctively read elements that sit close together as belonging to the same group. Designers can use small gaps to signal relationship and larger gaps to signal separation, helping spatial arrangement communicate structure without extra text.
Why should charts not rely on red and green alone?
The article states that roughly one in twelve men has some form of color vision deficiency, so relying on red and green alone can leave a large share of the audience unable to read the chart. Palettes that vary in lightness as well as hue remain distinguishable under most forms of color blindness, and pairing color with shape, pattern, or direct labeling provides a redundant cue.
What is the Gestalt principle of closure and how can it reduce chart clutter?
Closure is the human tendency to perceive incomplete shapes as complete forms. Because of this, designers can remove heavy gridlines, borders, and enclosing frames that add visual noise while the eye still connects nearby marks into continuous paths.
How can I create a focal point in a data visualization?
Selective color can establish a focal point by rendering a single bar in a saturated accent hue against muted grays. Size also works, such as enlarging a marker, thickening a line, or adding an annotation bubble around a specific value to create hierarchy.
What is the squint test in a chart audit?
The squint test involves blurring your vision or viewing the chart from a distance until fine detail dissolves. What remains reveals the dominant shapes, strongest clusters, and darkest marks, helping you check whether a secondary element dominates the key message or unrelated elements blur into a single mass.
Tony Astor
Tony writes about data visualization and the tools people use to build charts and dashboards. More about Data Illustrator