Gauge Chart: Uses, Examples and Better Alternatives
 By Tony Astor ·

Gauge Chart
A gauge chart is a radial dial that displays a single value on a scale from minimum to maximum, with a needle pointing to the current reading and colored bands marking thresholds like healthy, cautionary, and critical. It suits values with a known range, such as CPU load, sales quota progress, or completion percentage, enabling quick status checks at a glance.
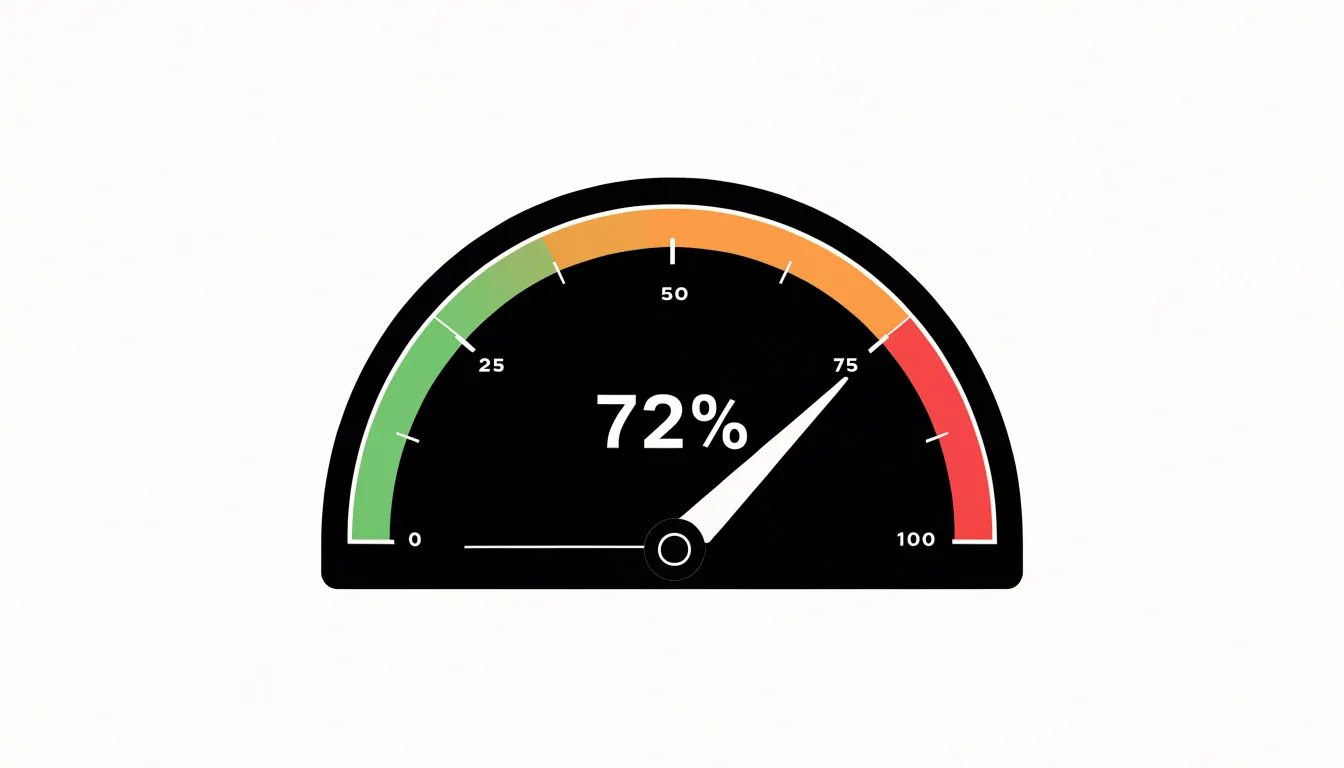
Table of Contents
Gauge Chart
A gauge chart, often called a speedometer chart or dial chart, presents a single numerical value on a radial scale that resembles the face of a measuring instrument. Borrowing its visual language from physical gauges on dashboards, control panels, and industrial equipment, a needle sweeps across a marked arc to display one key metric relative to a defined range of possible values.
An arc, typically a semicircle or partial circle, is divided into evenly spaced tick marks representing a quantitative scale from a minimum to a maximum value. A pointer or needle rotates from the center of the dial to indicate where the current value falls along that scale, while a numeric label usually gives the precise figure alongside the visual position. Many implementations add colored zones along the arc, such as green, yellow, and red bands, to signal healthy, cautionary, or critical performance ranges.
Mapping a value to the dial involves translating the metric onto the arc proportionally. If the scale spans 0 to 100 and the metric reads 72, the needle points roughly seven-tenths of the way around the arc. This direct correspondence between number and needle angle makes the chart intuitive, since viewers already understand how a physical dial behaves. The single-metric focus keeps attention on one reading without the distraction of comparisons across categories. Gauge charts work best for values with a known, meaningful range—such as a percentage, a performance score, or a capacity measure—where the needle’s position conveys standing relative to that range. Designers often pair the dial with a clear title, units, and target markers to anchor the reading in context.
Gauge Chart Anatomy
A gauge chart relies on a small set of visual components working together:
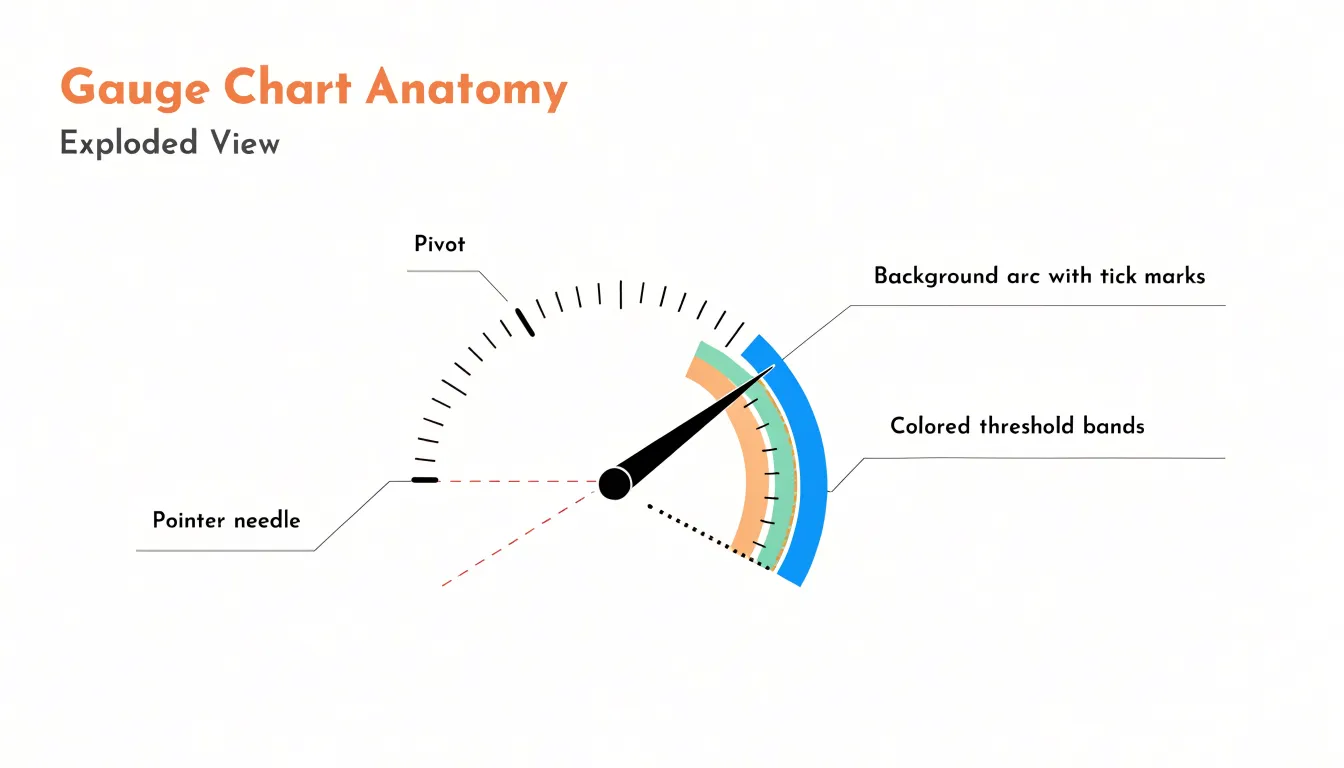
- Pivot: The fixed center point from which the pointer needle rotates, giving the viewer an immediate sense of where the measurement originates.
- Pointer needle: Extends from the pivot and sweeps across the dial to indicate the current value. Because the needle’s angle is the primary reading cue, its position against the scale must be precise and easy to interpret.
- Background arc and tick marks: The arc forms the outer boundary of the gauge and defines the full span of possible values. Tick marks break the range into readable increments, with labels at key points anchoring the scale in meaningful units.
- Threshold bands: Color-coded zones inside or beneath the arc divide the range into performance tiers, typically using green for healthy performance, yellow or amber for caution, and red for critical territory. These bands let the viewer interpret the needle’s position without reading exact numbers.
The value ranges themselves define what each zone means. Thresholds are usually set by business rules, service-level agreements, or operational limits, determining where each color band begins and ends. A well-designed gauge keeps the number of zones small, typically three to five, so the chart remains legible. Together, the arc frames the range, the colors encode judgment, and the needle delivers the current reading, making gauge charts effective for dashboards where quick assessment matters more than detailed trend analysis.
Gauge Chart Use Cases
Gauge charts excel when an audience needs to evaluate a single value against a known range or threshold at a glance.
In infrastructure monitoring, operations teams place gauges on dashboards to display server CPU load, memory consumption, or disk utilization. Clearly marked green, amber, and red zones let an on-call engineer instantly recognize whether a system is operating comfortably within limits, approaching a warning threshold, or sitting in a critical state without mentally comparing a raw number against a documented limit.
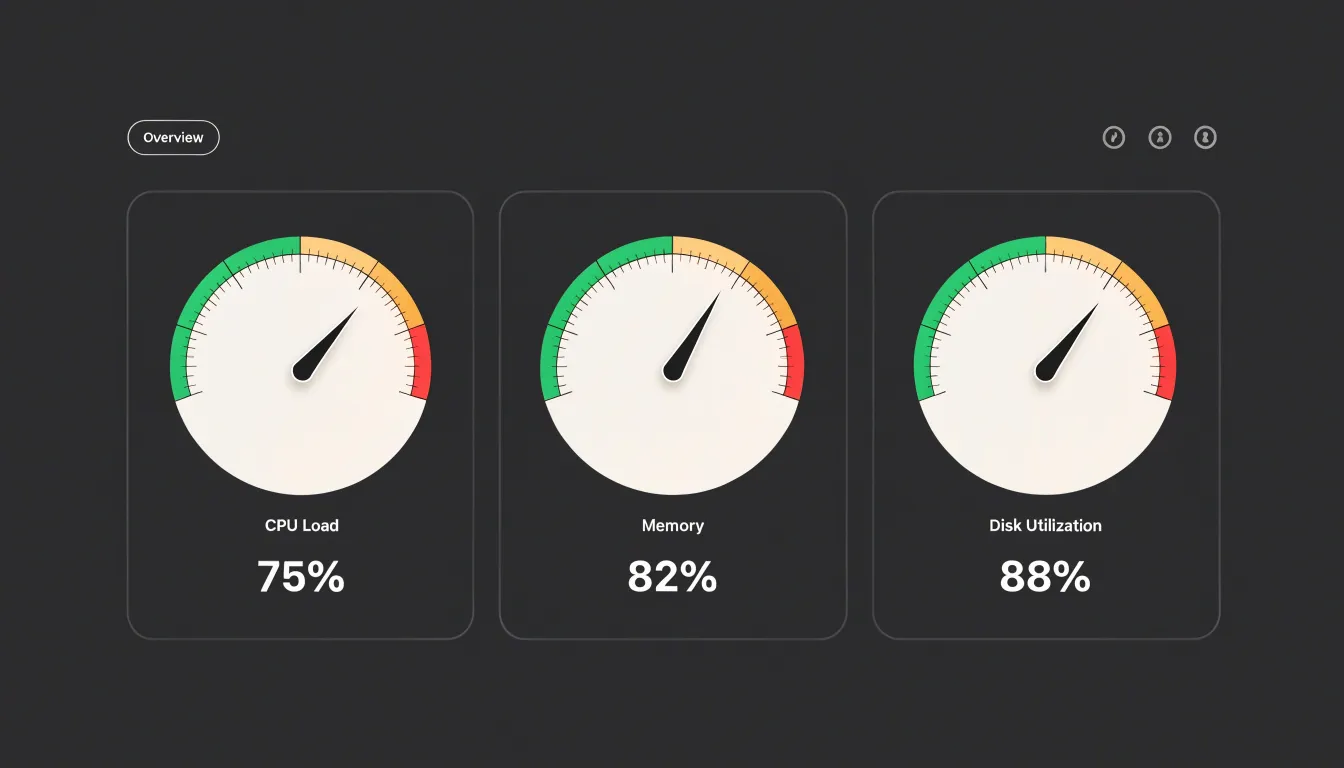
In sales and business performance tracking, organizations display individual or team sales quotas against targets. A sales representative might see a gauge showing revenue booked as a percentage of the quarterly quota, with the needle advancing as deals close, giving managers and representatives a shared reference point during reviews and stand-ups. The same pattern applies to customer support metrics such as tickets resolved within a service-level agreement, where the gauge communicates how much headroom remains before a breach.
In project management, completion percentages, budget consumption, and milestone progress map cleanly onto a gauge’s arc. A project dashboard might show one gauge for overall percent complete, another for hours burned against the allotted budget, and a third for open defects relative to an acceptable ceiling, letting stakeholders absorb project status across several dimensions in seconds.
Gauge Chart Examples
Studying real dashboard implementations reveals how radial meters function across different contexts.
In executive summary dashboards, radial gauges typically display a small set of headline indicators: overall revenue attainment against target, customer satisfaction scores, or progress toward quarterly goals. These implementations favor large, clearly labeled dials with minimal tick marks, letting a senior audience absorb status during a brief review meeting. The visual weight of a single prominent gauge communicates priority, while color bands translate raw numbers into thresholds such as on-track, at-risk, and behind.
Financial metric dashboards use gauges for profit margins, cash flow ratios, budget utilization, and debt-to-equity levels anchored to industry benchmarks or internal targets. Effective financial implementations pair the dial with a comparative reference marker so viewers see both the current value and the target on the same arc. Many financial dashboards place several compact gauges side by side as a KPI strip, giving analysts a quick scan of portfolio health before drilling into detailed tables and trend charts below.
Operational monitoring interfaces present the most dynamic use case. Server utilization, production line throughput, inventory levels, and queue depth benefit from radial meters that update in near real time, allowing an operator glancing at a wall display to spot an anomaly without reading exact figures. Circular progress-style gauges also appear in capacity planning tools to show how much of a resource pool has been consumed.
Across all three contexts, the strongest examples share a clear central value, restrained tick labeling, meaningful color bands tied to actual business thresholds, and placement within a layout where the gauge serves a specific decision rather than decorating the page.
Gauge Chart Color Coding
Color coding turns a gauge from a numeric readout into an instant status signal by drawing on learned associations: red communicates danger, failure, or values requiring immediate attention; yellow signals caution or a state that warrants monitoring; green indicates healthy, optimal, or on-target performance. Mapped onto the gauge arc, these zones answer whether a value is acceptable before the viewer consciously processes the number itself.
Strategic zoning begins with setting boundaries that reflect meaningful operational targets rather than convenient round numbers. If a service-level agreement specifies 95 percent uptime, the red zone should end at that figure so the color change coincides with genuine business risk. Zoning may also be weighted by severity: a narrow red band for critical failure, a broader yellow band for early warning, and a generous green band for normal operation. This proportional treatment reinforces the relative importance of each state and prevents alarm fatigue from an oversized warning zone.
Consistency across a dashboard matters as much as the palette itself. When every gauge assigns the same meaning to each color, users build a reliable mental model and scan multiple metrics without relearning the legend. Provide accessible alternatives for users with color vision deficiencies—such as distinct labels, patterns, or position-based cues—so status remains legible when hue perception differs.
Gauge Chart Drawbacks
Gauge charts often suffer from two major drawbacks that undermine their effectiveness: wasted space and the difficulty of reading curved scales.
A semicircular or circular gauge occupies a large area relative to the single number it conveys. Because much of the footprint is taken up by the frame, needle, and decorative elements rather than data, the chart has an inefficient aspect ratio and a poor data-to-ink ratio. Where dashboard space is limited, this inefficiency forces other, more informative charts to be compressed or omitted.
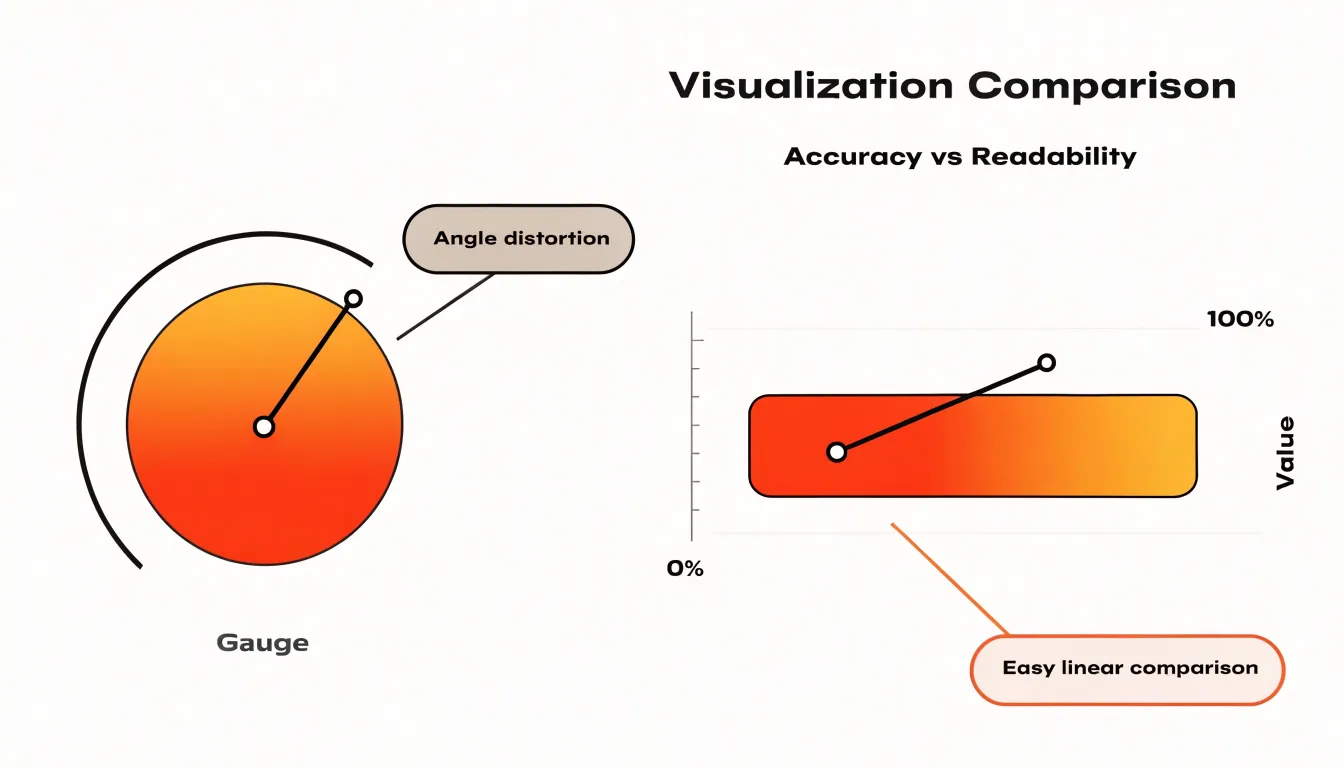
Furthermore, human perception judges distances much better along straight lines than along arcs. Mapping values to a radial scale makes it harder to compare lengths or positions accurately. A small difference in angle can correspond to a large difference in value, especially near the ends of the scale, or vice versa, and the curvature makes it challenging to interpolate between tick marks. Viewers often struggle to extract exact numbers, relying instead on rough estimates. For tasks requiring accuracy or comparisons across similar values, linear alternatives like bar charts or bullet charts use space more efficiently and are easier to read.
Bullet Chart
Introduced by Stephen Few, the bullet chart compresses several layers of quantitative information into a single horizontal bar, making it a space-saving replacement for clustered dials when dashboard space is limited. A central bar encodes the actual value being measured, while shaded bands behind it represent qualitative performance ranges such as poor, satisfactory, and good. A short vertical marker overlays the bar to indicate a target or comparative benchmark, making the distance between actual performance and the target immediately visible.
Unlike a circular gauge that devotes considerable area to a single number, a bullet chart reads linearly along a common axis. It aligns naturally with bar-based layouts, allowing several charts to stack vertically in a row. Each row can represent a different metric while sharing the same visual grammar, letting readers scan across categories without reorienting to a new chart type.
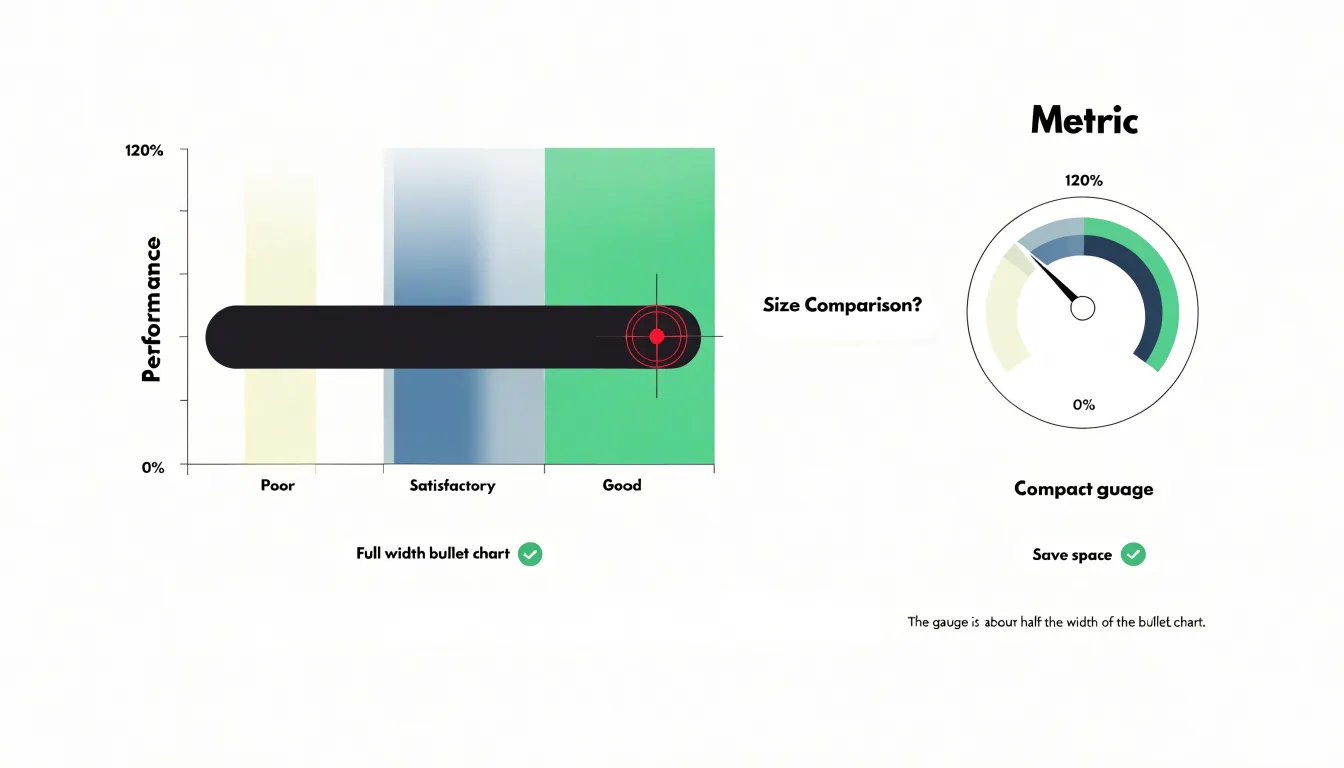
Reading a bullet chart follows a simple sequence: locate the dark bar to see current performance, note the target tick to judge whether expectations are met, and consult the background bands to see which qualitative zone the value falls into. Compact labeling, a clear axis, and restrained color keep the chart legible across a scorecard or operations dashboard.
Horizontal Bar Chart
When presenting several related metrics at once, the horizontal bar chart keeps every value legible and directly comparable. Each metric occupies its own row, extending left to right from a shared baseline along the left edge. A reader can scan down the column and compare quantities without mental rotation or estimation.
This layout offers a practical advantage for labeling: metric names sit at the start of each row in ordinary horizontal text, so long or descriptive labels fit comfortably without crowding the plot area, tilting text at an angle, or abbreviating names. Because the bars run in the same orientation as the labels, the eye travels naturally from name to value.
The underlying linear scale supports precise visual comparison. A bar twice as long as another represents twice its value, and small differences between similar metrics remain visible rather than being flattened by angle distortions. Additional metrics simply extend the chart downward without adding clutter, and ordering rows by magnitude or category further clarifies relationships across the dataset.
Thermometer Chart
A thermometer chart presents a value as a straight vertical column that fills from the bottom upward, mimicking liquid rising in a glass tube. The scale runs along the side, and the fill height shows how far the current value has advanced toward a defined target. This linear format suits metrics where progress accumulates along a single dimension, such as funds raised against a fundraising goal, units sold against a quota, signups toward a registration target, or storage consumed against a capacity limit.
Where a circular gauge leaves much of its square footprint empty, a vertical fill meter occupies a narrow rectangle, making it easy to place several side by side in a dashboard column. Labels can sit to the left of each column while the filled portion rises on the right.
Viewers interpret a thermometer chart quickly because the filled height maps onto physical intuition about rising levels. A marker line at the top fixes the target, showing exactly how much remains, while midpoint ticks let viewers estimate fractional progress. Color, texture, or gradients can reinforce thresholds and draw the eye upward. The chart works best when the quantity is unambiguous and the target is fixed, and multiple columns can share a common scale to compare volumes across categories.
Donut Chart
The donut chart presents fractional data as an arc wrapping around a circular track, eliminating the need for a needle, pivot, or radial tick marks. The filled portion of the ring grows or shrinks in direct proportion to the percentage represented—75 percent appears as three-quarters of the circle shaded in, with the remaining quarter left as empty track. Viewers estimate completion by comparing the filled span against the full circumference.
The open center creates a natural home for text callouts, such as the exact percentage, a short label, or a target threshold. The arc supplies the quick impression of fullness, while the central text resolves any ambiguity about the precise figure.
Without a needle or angle calculations from a center point, the ring itself carries the message and can be styled through thickness, color gradients, or rounded caps at the arc ends. Multiple donut charts can sit side by side to compare several proportions, and for data that changes over time, the arc animates smoothly as the value rises or falls without the mechanical swing of a pointer.
Line Chart
Where a gauge chart compresses performance into a single moment, a line chart plots a continuous series of points across a horizontal time axis (hours, days, weeks, or months) against a vertical value axis. Connecting the points reveals direction, pace, and rhythm—showing whether a figure is climbing steadily, declining, oscillating within a band, or holding flat.
This historical framing provides temporal context that a single-point snapshot cannot convey. A gauge reading of 70 percent looks identical whether the metric has been stable for months or has just recovered from a deep dip, yet those situations call for very different responses. By showing the path that led to the current value, a line chart turns peaks and troughs into identifiable events, reveals seasonal patterns, and uses slope to communicate momentum, helping viewers distinguish an anomaly from an established trajectory.
Line charts also support comparisons across time windows by overlaying the current period against an earlier one, or by plotting several related series in a single frame. Because the format preserves the full sequence of observations, designers can place annotations—such as launch dates, incidents, or policy changes—directly on the timeline to tie cause to effect.
Chart Selection
Before placing a gauge chart on a canvas, a designer should answer three questions:
- Who is the audience, and what is their data literacy? A viewer who works with metrics daily may read a dial with colored zones instantly, while an occasional visitor may need a more literal presentation that spells out the value and its meaning. How often they look at the display and under what time pressure shapes the level of abstraction the visual can carry.
- How much display area is available? A gauge occupies a compact, roughly square footprint suited to a KPI tile on a crowded dashboard or a small screen in an operations center. If space is generous, other visuals may communicate more per pixel; if space is tight, the gauge delivers a single figure with context in a glanceable form.
- Does the audience need a historical trend or current status? A gauge answers “where do we stand right now relative to a target or threshold.” When the question is “how did we get here,” a line or area chart carries the narrative of change over time far better, though pairing a summary gauge above a trend view can serve both needs.
Answering these questions avoids decorating a dashboard with attractive dials that fail to serve the user, while setting clear expectations for labeling, target markers, and color thresholds.
Gauge Chart Design
Because every extra mark, line, or label competes for attention on a single-value chart, gauge design should strip away non-essential elements:
- Limit tick marks: Show only major intervals. Minor ticks and dense subdivisions add visual noise; reserve detailed scales for contexts where precision is critical.
- Simplify the background: Remove unnecessary grid lines, borders, gradients, shadows, and decorative elements. A plain, neutral backdrop with surrounding white space lets the dial and needle stand out. If a range indicator is needed, use a subtle band of color rather than multiple overlapping arcs.
- Keep labels minimal and legible: Use a clear sans-serif font with strong background contrast, placed where text will not overlap the dial or busy areas. Label only key values—minimum, maximum, and thresholds—rather than every tick.
- Emphasize the indicator: Make the needle distinct and unadorned, using a single accent color for the current value and muted tones for the scale.
- Test at target size: Verify the chart at its actual display dimensions, as a layout that looks clean on a large monitor may become crowded on a small tile.
Dashboard Mistakes
Dashboards often fail not because of the underlying data, but because of three recurring presentation mistakes:
- Overcrowding: Squeezing every available widget onto a single screen leaves no clear entry point. Widgets compete for attention, labels get truncated, and the eye jumps from corner to corner without settling on the primary measure.
- Unrestrained color: Applying saturated reds, yellows, and blues to every chart and callout collapses the visual hierarchy. When readers cannot tell whether a bright hue signals urgency, a category distinction, or decoration, they learn to ignore the loudest elements. Restrained palettes with one or two accent colors guide attention far more reliably.
- Misaligned quantitative scales: Placing two charts side by side with different y-axis ranges, or letting a gauge’s zero point drift between panels, invites false comparisons. A bar that looks twice as tall may represent a 5 percent difference, and an axis starting above zero can exaggerate a minor fluctuation into an apparent crisis. Consistent scales, clearly labeled ranges, and aligned visuals keep comparisons honest.
Dashboard Overview
Interactive features determine how quickly a viewer moves from a high-level dashboard scan to deeper understanding.
Tooltips reveal precise values, labels, and supporting metrics when a user hovers over a chart segment or marker, keeping the primary display clean while rewarding exploration. Paired with clear highlighting and responsive hover states, tooltips add depth with almost no visual cost—though they depend on pointer interaction and can be missed on touch devices.
Dynamic chart selection adapts the visual format to the user’s task, switching from compact summary indicators in an overview to trend lines, comparative bars, or distribution plots in a drill-down view. While dynamic selection offers richer analytical range, it requires thoughtful defaults so the interface remains predictable. In some cases, simpler static alternatives like annotated charts or small multiples deliver the same insight with far less complexity. Weighing these options helps designers balance interactivity, guidance, and visual clarity for their audience.
Frequently Asked Questions
What is a gauge chart?
A gauge chart, also called a speedometer or dial chart, presents a single numerical value on a radial scale using a needle that sweeps across a marked arc. It works best for values with a known, meaningful range, such as a percentage, performance score, or capacity measure.
What are the key parts of a gauge chart?
A gauge chart relies on components such as a pivot, pointer needle, background arc and tick marks, and threshold bands. The arc frames the full range, the colors encode judgment, and the needle delivers the current reading.
What are common use cases for gauge charts?
Gauge charts are used in infrastructure monitoring, sales and business performance tracking, and project management. They help audiences evaluate a single value against a known range or threshold at a glance.
What do the colors on a gauge chart mean?
Color coding typically uses red for danger, failure, or values requiring immediate attention; yellow for caution or monitoring; and green for healthy, optimal, or on-target performance. The article also notes that designers should provide accessible alternatives for users with color vision deficiencies, such as distinct labels, patterns, or position-based cues.
What are the drawbacks of gauge charts?
Gauge charts often suffer from wasted space and the difficulty of reading curved scales. They can be inefficient relative to the single number they convey, and linear alternatives like bar charts or bullet charts are easier to read for accuracy or comparisons.
Should I use a gauge chart or a line chart?
A gauge chart answers “where do we stand right now relative to a target or threshold,” while a line chart is better for showing “how did we get here” through historical trend. Pairing a summary gauge above a trend view can serve both needs.
Tony Astor
Tony writes about data visualization and the tools people use to build charts and dashboards. More about Data Illustrator