Gantt Chart vs Timeline: Which Fits Your Project?
 By Tony Astor ·
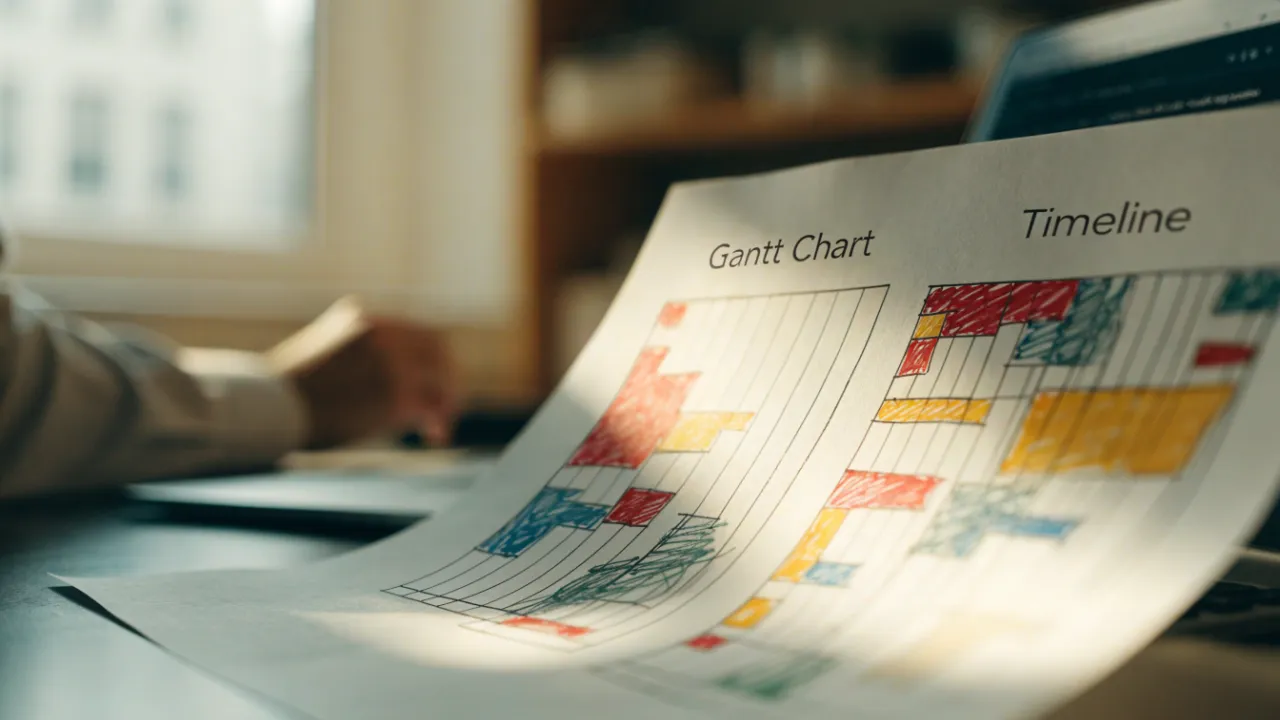
Gantt Chart vs Timeline
A Gantt chart is a detailed project schedule that shows tasks as horizontal bars on a two-dimensional grid, with durations, start and end dates, owners, progress, and dependency links. A timeline is a simpler single-axis view showing only milestones and phases in sequence. Use Gantt charts for complex, interdependent work and timelines for high-level communication.
Table of Contents
Timeline
A timeline presents a project as a single horizontal line marked with dates and key events, giving viewers an immediate sense of sequence and duration. The format strips a schedule down to its essentials: major phases, important milestones, and the order in which they occur. Because the line runs in one direction from start to finish, readers can trace the arc of a project in a few seconds and understand when each stage begins, how long it lasts, and what comes next. This chronological clarity makes timelines especially useful for executive summaries, client-facing presentations, and kickoff documents where the audience needs orientation rather than detail.
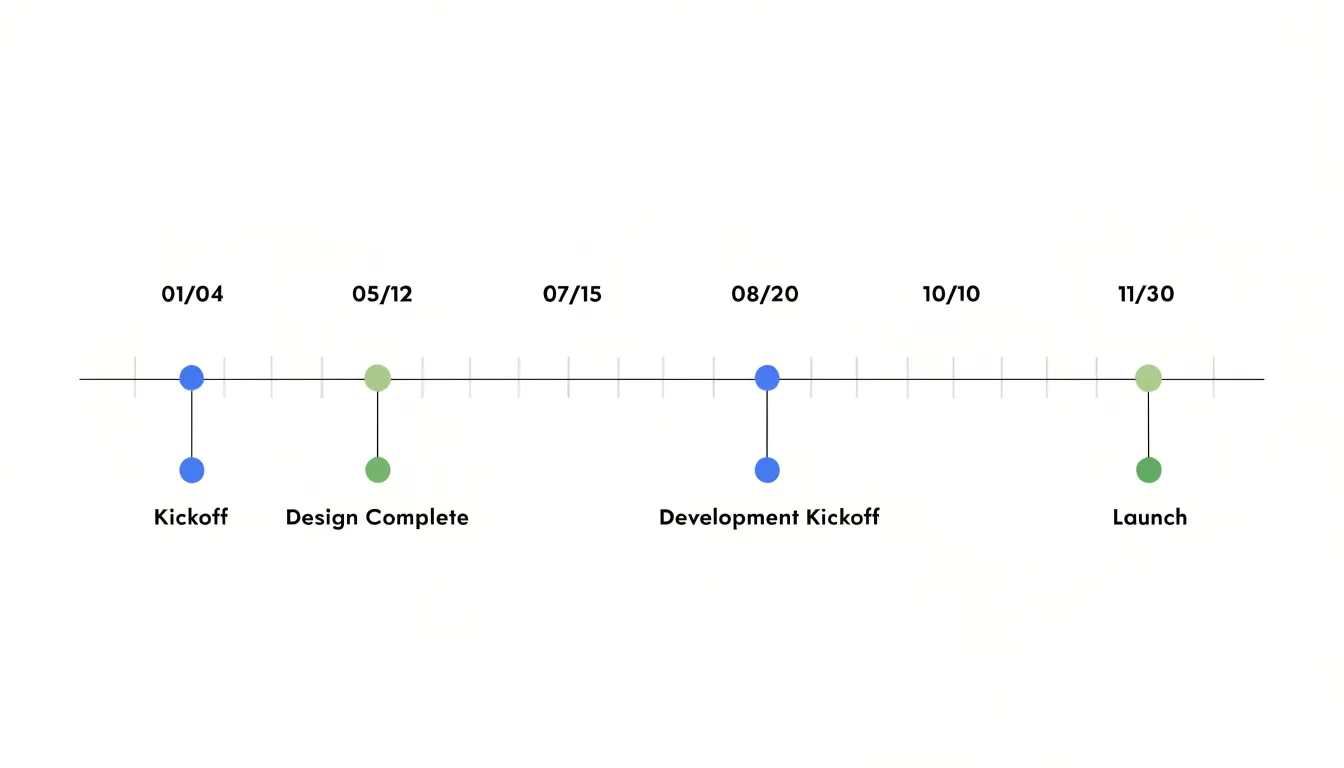
The strength of a linear timeline lies in what it leaves out. Granular task data, individual assignments, dependencies, and percentage-complete indicators all compete for attention, and at a glance they can obscure how a project unfolds. A timeline filters that noise away. Each entry on the line marks something consequential, such as the completion of design, the start of a testing phase, or a public launch date. Stakeholders who are not immersed in day-to-day execution can follow the progression without wading through rows of task bars.
This simplicity also supports communication across audiences. A timeline can be shared with clients, sponsors, or new team members who need a shared reference point for the project’s shape and pacing. It works as a narrative device, showing how phases build on one another and where review points or handoffs fall. When a project spans months or quarters, the line format compresses that span into something readable on a single page or slide.
The tradeoff is deliberate: a timeline sacrifices operational depth for communicative power. It answers when things happen and in what order, while leaving the question of who does what, and how tasks connect, to more detailed planning tools.
Gantt Chart
A Gantt chart presents project work as a two-dimensional grid, with tasks listed along one axis and time plotted along the other. Each task appears as a horizontal bar whose length corresponds to its duration, and whose position along the time axis marks its scheduled start and end dates. This layout lets anyone reading the chart see what happens when, how long each activity is expected to take, and where work overlaps across the calendar. For complex operations involving many moving parts, this visual density turns a long list of activities into a structured, readable plan.
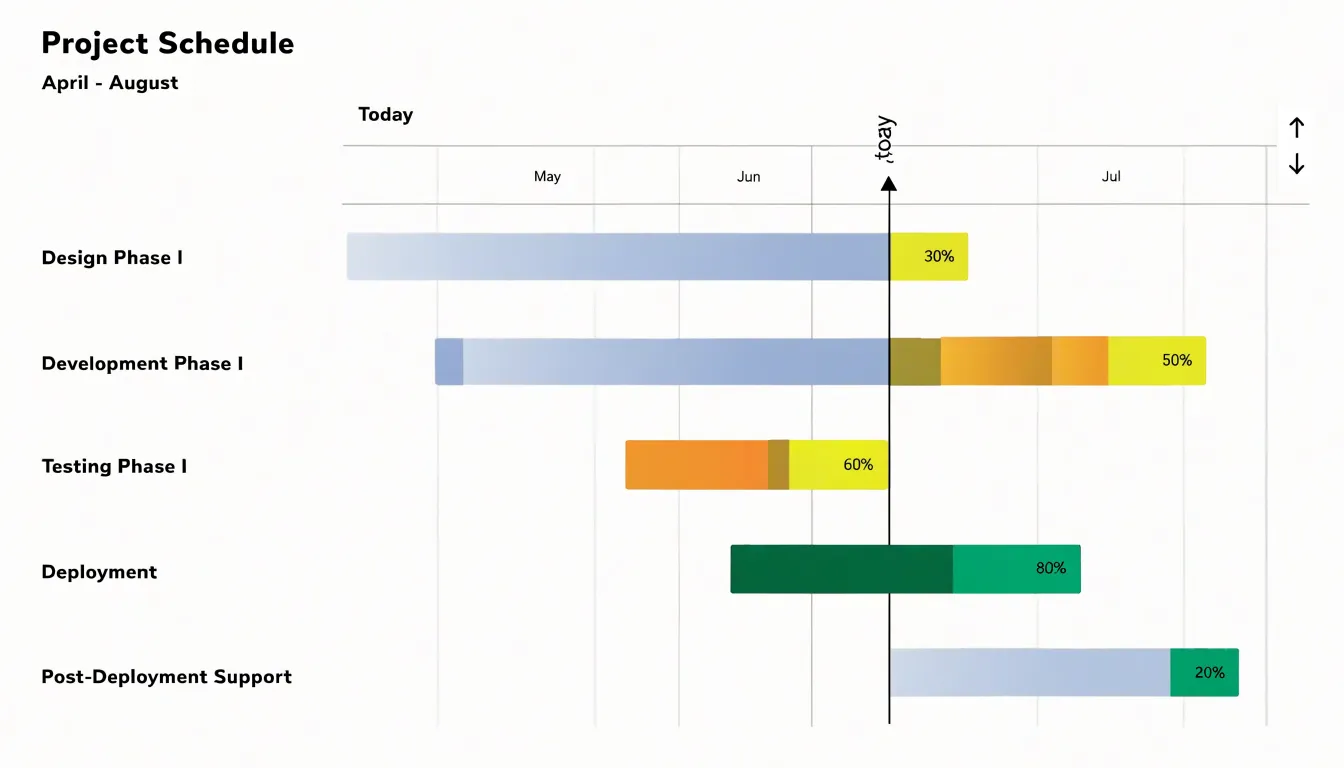
The real strength of the Gantt format lies in how it captures dependencies. Bars can be linked with connector lines or arrows that show which tasks must finish before others can begin. A testing phase, for example, can be tied to the completion of development, and a launch can be tied to sign-off on testing. When a predecessor slips, the chart makes the ripple effect visible, so managers can trace how a delay in one area pushes back downstream work. These links support different relationship types, including finish-to-start, start-to-start, and finish-to-finish sequencing, which reflect the way real operations flow.
Gantt charts also carry the detail needed to manage day-to-day execution. Rows can include owners, milestones, percent-complete shading, resource assignments, and notes on constraints or deadlines. Milestones appear as distinct markers, giving the team clear checkpoints. Because every bar is tied to dates, the chart doubles as a scheduling instrument and a progress record: completed portions can be filled in, and the current date line shows how actual work compares with the plan.
For complex operations, this combination of duration, timing, and interdependency in one view gives managers a practical control surface, supporting forecasting, resource balancing, and early identification of bottlenecks before they affect delivery.
Structural Differences
The structural layout of a planning tool shapes how a team works through the day. Because a timeline arranges work along a single linear axis—typically moving left to right—its visual field stays uncluttered, allowing anyone on the team to locate themselves without training. Daily updates follow the same simple logic: you move a bar, extend it, or shift a milestone, and the change reads instantly to everyone else. This low visual complexity encourages quick, frequent interaction, and stand-up conversations tend to reference the timeline as a shared anchor.
A Gantt chart’s second dimension organizes tasks into vertical rows—often grouped by workstream, owner, or dependency chain—while the horizontal axis tracks time. This matrix structure lets a planner express relationships that a linear view cannot hold, such as parallel tracks, predecessors, and resource overlaps. The cost is higher visual density. Readers need more time to parse the chart, and casual glances give way to focused study. Teams using Gantt charts often schedule dedicated review moments rather than expecting constant self-service updates, and daily status changes may pass through a coordinator who maintains the integrity of the dependencies. The richer structure supports coordination across complex projects, while the simpler linear view supports fast, decentralized daily interaction.
Simple Projects
For many teams, the work at hand is straightforward enough that a simple timeline delivers everything needed to keep everyone aligned. Consider a marketing campaign built around a single product launch: there is a content calendar, a sequence of social posts, a handful of email sends, and a press outreach window. The dependencies are minimal and the sequence is largely linear, so plotting these activities along a horizontal timeline gives the whole team an immediate, shared picture of what happens when. Nobody needs to see critical-path calculations or resource leveling to understand that the social teasers go out before the launch day announcement.
Event planning follows a similar pattern. A conference, a company anniversary party, or a trade show booth involves dozens of tasks, yet most of them live comfortably on a calendar-style timeline. Venue booking, speaker invitations, catering confirmations, and promotional mailers each occupy a slot, and the team can glance at the timeline to see how far along preparations sit. The visual simplicity encourages quick updates during stand-ups and makes it easy for outside stakeholders to follow progress without a tutorial.
In these situations, building a full Gantt chart with task hierarchies, percentage-complete tracking, and dependency arrows would add administrative weight without adding meaningful insight. A timeline keeps the focus on dates and deliverables, which is where the real coordination happens. Teams can update it in minutes and share it widely. When speed of communication matters more than granular control, the timeline is the right instrument.
Complex Workflows
Complex workflows involve many interdependent activities running at the same time, and Gantt charts are built to make that complexity visible and manageable. In software development, a single release cycle can span design, backend and frontend engineering, quality assurance, documentation, and deployment. These streams overlap constantly: testers begin writing cases while developers are still building features, and API work must finish before integration testing starts. A Gantt chart lays each stream out along a shared calendar, so dependencies appear as connecting lines and the team can see immediately which tasks block others. When a backend task slips by three days, everyone can trace the downstream effect on QA and the release date without guesswork.
Construction projects show the same pattern at a larger scale. Site preparation, foundation work, framing, electrical installation, plumbing, and finishing trades interleave over months, and many of them can only begin once a predecessor is signed off. Gantt charts capture these sequences clearly, mapping milestones such as inspections and material deliveries against the tasks that depend on them. Multiple subcontractors can be scheduled against one master view, which reduces idle time and helps coordinators spot clashes before crews arrive on site.
The critical path is where Gantt charts add the most analytical value. By highlighting the longest chain of dependent tasks, the chart shows which delays directly threaten the final deadline and which ones carry slack. Project managers can then focus attention and resources where they matter most. Combined with progress shading and baseline comparisons, this gives teams in both software and construction a detailed, shared record of who is doing what, when, and what happens if something moves.
Task Dependencies
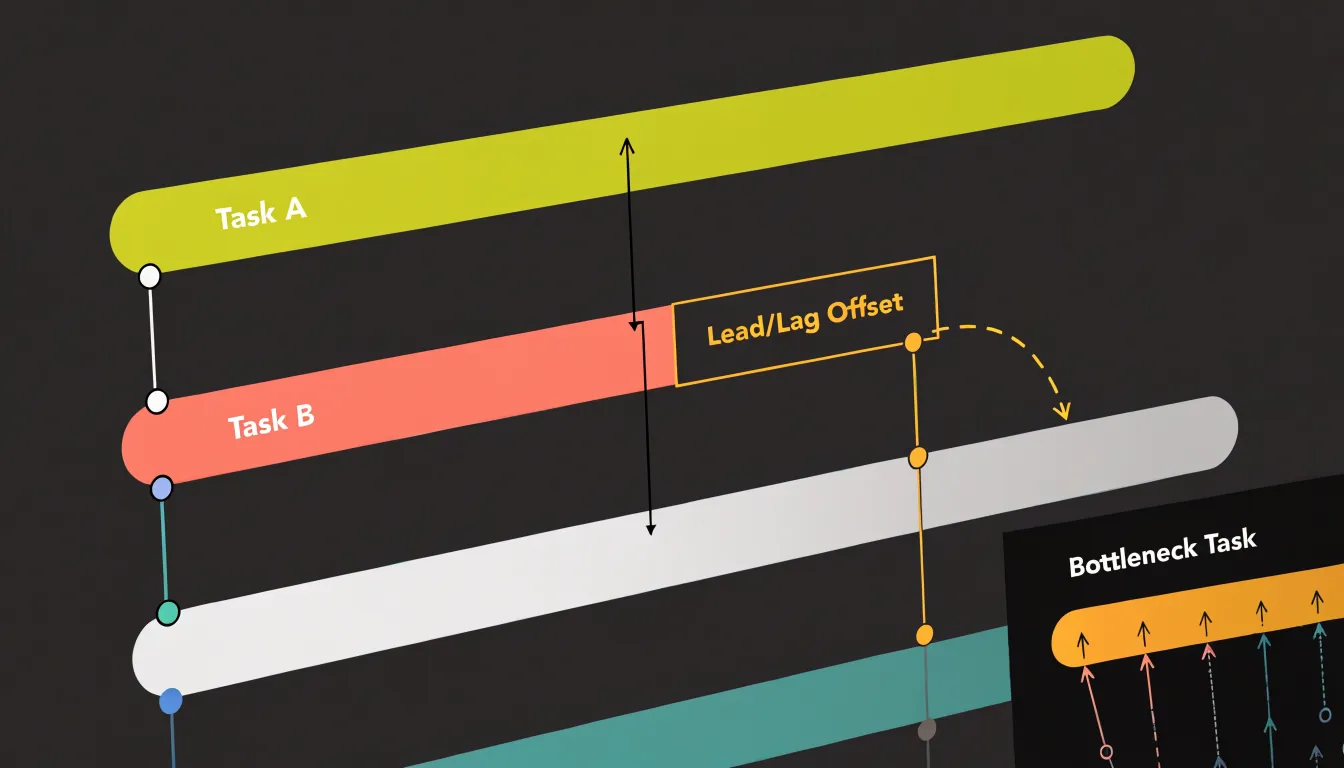
Every project contains steps that cannot begin until another step has concluded, and the clarity with which those relationships are displayed determines how well a team can anticipate problems. A Gantt chart renders these dependencies as explicit connectors, usually arrows linking one task bar to the next. Finish-to-start relationships appear as direct links between the end of one bar and the start of another. Lead-lag relationships, which allow for overlapping or delayed starts, are shown through offset connectors or slight gaps between linked bars, making the precise timing of each handoff visible at a glance.
Simple timelines, by contrast, display tasks along a date axis without drawing lines between them. The visual result is cleaner, yet the underlying logic of the work remains invisible. A viewer can see that task B starts the week after task A ends, but cannot tell whether that spacing reflects a real dependency or mere coincidence of scheduling. When a delay strikes task A, the timeline offers no immediate signal about which downstream activities are at risk, and team members must reconstruct those connections from memory or separate documentation.
In a Gantt chart, a crowded cluster of incoming connectors points to a bottleneck—a step that many others depend on. Project managers can see, for instance, that a single approval gate feeds five subsequent tasks, and can prioritize resources accordingly. This clarity supports better conversations about sequencing, resource allocation, and contingency planning.
Resource Allocation
A Gantt chart gives project managers a working view of who is doing what and when, making it possible to balance workloads before they tip into overload. Each task bar carries an assigned owner, an estimate of effort, and a start and end date, so a quick scan of any row shows how much of a person’s calendar is committed across the coming weeks. When several bars stack up against one team member in the same window, that visual clustering is an early signal that the person is overbooked. Managers can then shift deadlines, redistribute tasks to colleagues with lighter rows, or bring in extra hands from another team.
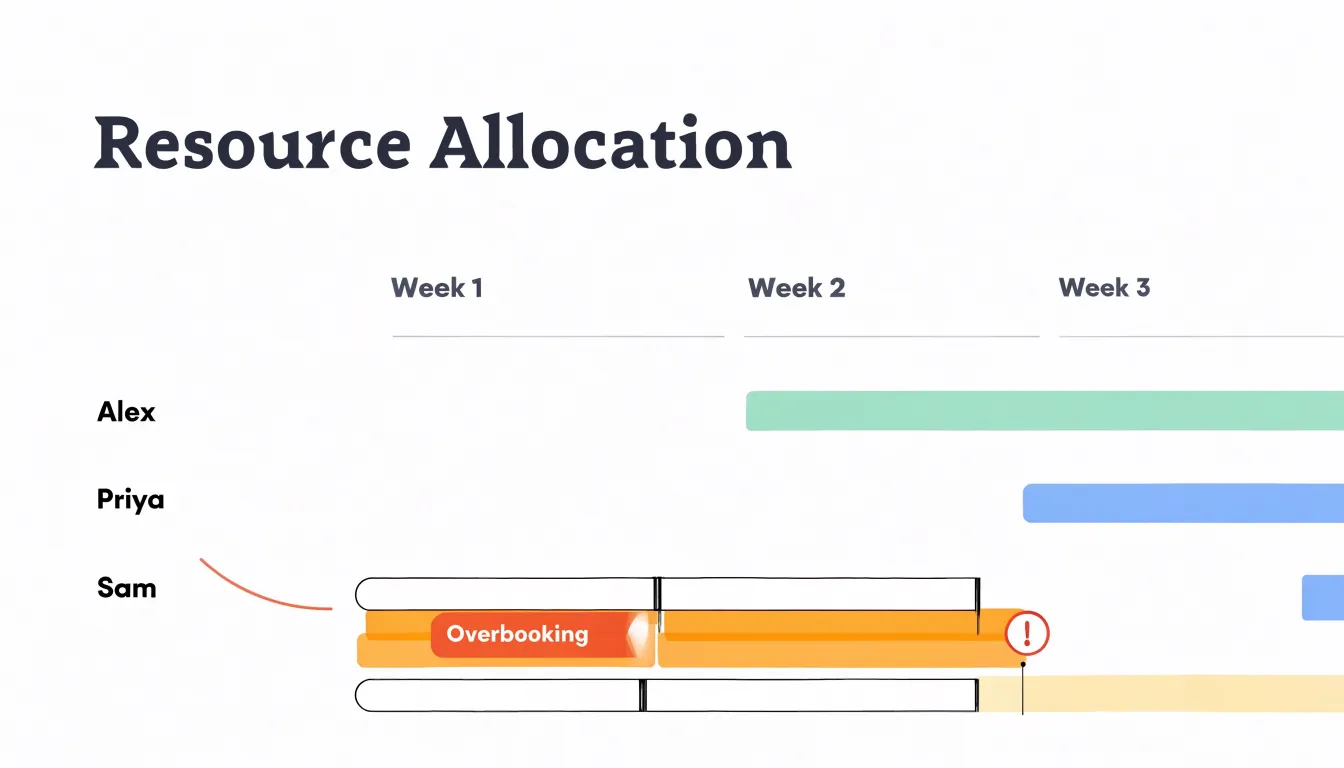
This approach supports concrete capacity planning: comparing the sum of assigned effort against realistic working hours reveals whether the team has room for incoming work or is already stretched. Regular reviews of the chart, perhaps once a week, keep the picture current and let small adjustments happen before stress builds. Preventing burnout comes from this steady attention to load, since problems surface as overlapping bars rather than as a sudden wave of absences or missed deadlines.
On a simple timeline, horizontal bars typically represent phases or deliverables rather than individual people, so they carry little or no information about effort, ownership, or weekly individual task loads. A manager looking at a timeline has no direct way to tell who is overloaded or where spare capacity exists. Workload problems tend to stay hidden until they cause delays, and balancing work requires guesswork or a separate spreadsheet. The Gantt chart closes that gap by tying every task to a person and a time frame.
Audience
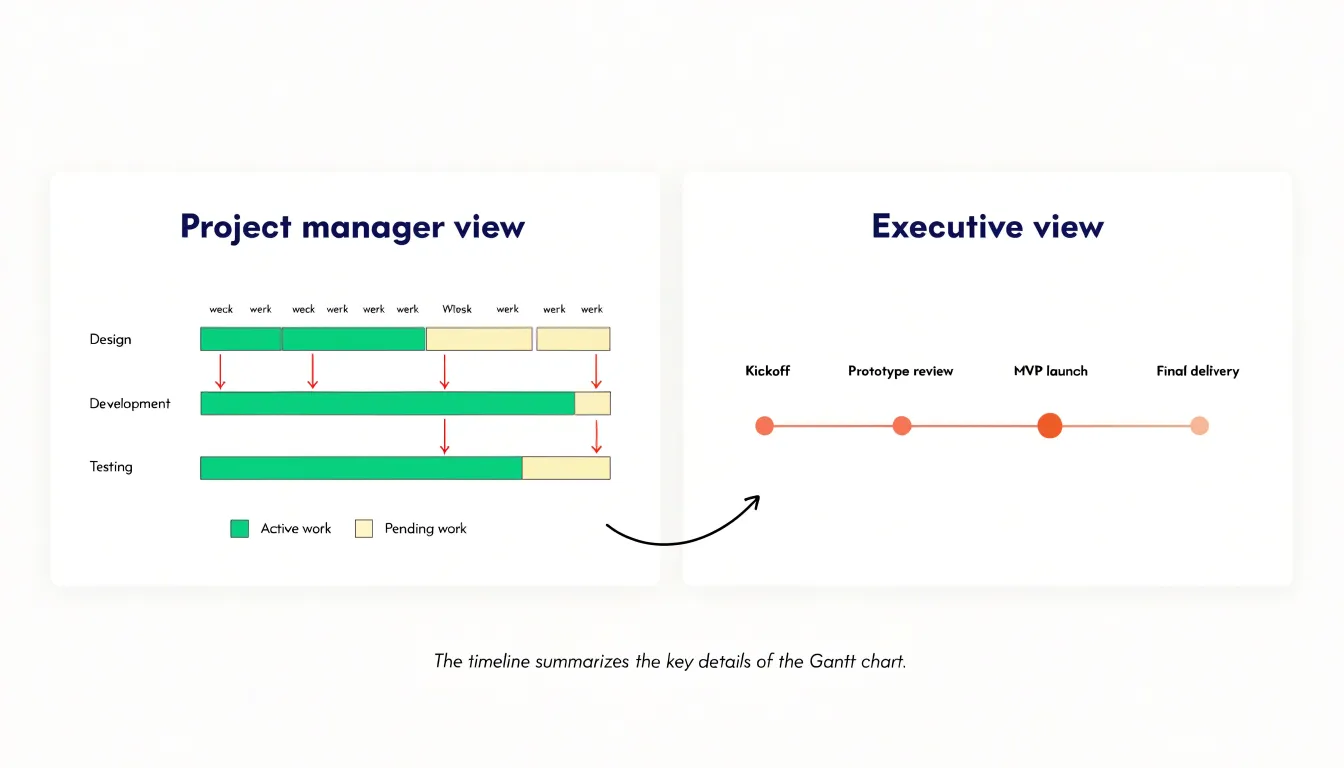
Different audiences need different views of the same project information. When presenting to executives or senior stakeholders, the goal is a fast, high-level understanding of where things stand. A timeline serves this purpose by mapping major milestones and phases along a single axis, letting a leader grasp the project’s shape within seconds. Executives rarely need to see every task dependency or daily assignment, and a crowded chart can bury the few facts that matter to them. A clean timeline limited to key milestones respects their time and keeps the conversation on outcomes, risks, and decisions.
Internal project teams operate under different requirements. They need the granularity of a detailed Gantt chart—task durations, overlaps, owners, and critical paths—to coordinate handoffs, spot scheduling conflicts early, and adjust workloads as conditions change. This detailed view becomes the working document the team revisits in stand-ups and planning sessions.
A practical approach pairs both formats within the same reporting rhythm. The project manager maintains the detailed Gantt chart as the source of truth for execution, then distills its status into a timeline summary for leadership reviews.
Setup and Maintenance
The effort required to set up and maintain a schedule differs sharply between timelines and Gantt charts across the project lifecycle. A simple timeline typically requires only a handful of data points per task: a name, a start date, and an end date. Building one takes minutes rather than hours, and team members can usually populate it without formal training. When a date shifts, the update is a single edit. Over a multi-month project, this low per-update cost compounds into substantial time savings, particularly for teams that revise schedules frequently.
A detailed Gantt chart demands considerably more upfront investment. Planners must define task dependencies, assign resources, set milestones, and configure the display to accommodate the full scope of work. This configuration phase can consume several hours on a moderately complex project and often requires familiarity with the software itself. Maintenance carries a similar weight. Every change to a task’s duration can trigger recalculations across linked tasks, and keeping dependencies accurate means reviewing the chart whenever upstream work slips. Resource assignments add another layer that must be kept current as team availability changes.
On straightforward initiatives with few dependencies, the maintenance overhead of a Gantt chart often outweighs its benefits. On larger projects where dependencies drive the critical path, the time spent maintaining the Gantt chart buys visibility that a simple timeline cannot provide. Teams should weigh these trade-offs against their actual scheduling needs, the frequency of change, and the number of people responsible for keeping the chart current.
Progress Tracking
Timelines keep attention fixed on the milestones that mark real progress: a phase completed, a deliverable approved, or a launch date reached. The distance between markers shows how far the project has traveled toward its goal, answering whether the team is hitting its major checkpoints. Stakeholders and clients benefit from this view because a missed milestone stands out immediately against the sequence of completed ones, giving leaders an early signal that something upstream needs attention.
Gantt charts track progress at a finer resolution. Because each task bar can be shaded to show the percentage of work completed, a project manager can open the chart on any morning and see which tasks are finished, which are in progress, and which have slipped behind schedule. Team members can update their own bars as they work, creating a live record of where effort is being spent and where bottlenecks are forming before they cascade into delayed milestones.
Used together, the two views give a project both a strategic headline and an operational record, connecting day-to-day completion status to the larger achievements the organization cares about.
Software Options
Mapping project management software against the views your team actually needs helps narrow down the options:
- Lightweight timeline generators: Tools such as Canva, Precedence, and Office Timeline let you produce a clean visual roadmap from a simple spreadsheet or a handful of milestones. You can hand a polished timeline to stakeholders without training anyone on complex features, making them ideal for presentations, launch plans, and small projects with limited dependencies.
- Mid-range platforms: Asana, Trello, and ClickUp offer timeline views alongside list, board, and calendar layouts, letting teams switch perspectives without exporting data. These tools suit teams that need day-to-day task tracking and shared visibility, and most now include dependency arrows and drag-and-drop scheduling that approximate Gantt functionality. The same platform can serve a marketing calendar and a product roadmap, with timeline views toggled on when stakeholders need the bigger picture.
- Dedicated Gantt software: Microsoft Project, Smartsheet, Wrike, and TeamGantt provide critical-path analysis, resource leveling, baselines, and detailed dependency management. These platforms handle multi-phase programs where a slipping task cascades through the schedule, and they typically integrate with time-tracking and reporting suites. The trade-off is setup effort and licensing cost, so they make sense when scheduling complexity justifies the investment.
Whichever tier you choose, prioritize tools that support multiple views from a single source of truth, offer collaboration features like comments and assignments, and export cleanly for stakeholder reports. Trial the shortlist against a real project before committing.
Common Mistakes
One common mistake is overcomplicating simple projects with dense Gantt charts. When a project has only a handful of tasks and a straightforward sequence, a detailed Gantt chart with dozens of rows, color-coded bars, and multiple dependency arrows becomes a burden. It obscures the overall flow, and teams can spend more effort updating the chart than managing the work itself.
Another pitfall is hiding critical dependencies within basic timelines. When dependencies are implicit or omitted, team members may overlook crucial handoffs, leading to delays and miscommunication. For instance, a timeline might show that design and development phases occur sequentially, but without indicating that development cannot start until design approval, stakeholders might assume parallel work is possible, causing scheduling conflicts and rework.
Some teams fall into the trap of using a Gantt chart for every project regardless of size, while others use a timeline for a highly interdependent project only to realize later that it fails to capture the necessary detail. Matching the tool to the project’s complexity and the audience’s needs avoids both wasted effort and scheduling oversights.
Hybrid Approach
To integrate timelines and Gantt charts into a unified system, establish the Gantt chart as the single source of truth and use the timeline as a filtered, high-level visualization of that underlying data. Project managers work directly within the Gantt chart to manage dependencies and update progress in real time, while executives access a dashboard or summary report that automatically pulls strategic milestones and overall project health into a simplified timeline.
Effective integration relies on software that supports multiple views from the same dataset, allowing seamless switching between perspectives. Regular synchronization is crucial: any changes in the Gantt chart should automatically reflect in the executive timeline to eliminate manual updates. You can also set up automated reports that push timeline summaries to leadership at regular intervals, while configuring task-deviation alerts for project managers.
Decision Criteria
Before choosing between a Gantt chart and a timeline, run your project through four decision criteria:
- Team size: Small teams of two to five people often coordinate through conversation, so a simple milestone timeline may be enough. As the team grows past eight or ten contributors, the need to see who owns what and when tasks overlap pushes you toward a Gantt chart.
- Project duration: A short sprint of a few weeks rarely justifies rows of task bars, while a project stretching across several months or quarters benefits from structured scheduling.
- Complexity: Count the number of workstreams, the dependencies between them, and how frequently dates shift. Projects with many interlocking tasks reward the richer view of a Gantt chart, whereas linear projects with few moving parts communicate more cleanly on a timeline.
- Stakeholder needs: Executives and clients often want a quick visual summary of progress and key dates, while delivery teams and project managers need granular tracking of assignments, durations, and critical paths.
Score each factor: how many people touch this work, how long will it run, how tangled are the dependencies, and who will look at the output? When two factors conflict, prioritize the audience who will use the visual most often.
Overview
Choosing between a timeline and a Gantt chart comes down to matching the visual format to your project’s complexity, team distribution, and reporting requirements. Use a Gantt chart when internal planning demands granular control over scheduling, resource allocation, and dependencies; use a timeline when external communication calls for an accessible overview of high-level progress. Factor in your team’s software familiarity and learning curve so the tool reduces friction rather than adding it, and review your setup regularly as the project evolves.
Frequently Asked Questions
What is the difference between a timeline and a Gantt chart?
A timeline presents a project as a single horizontal line marked with dates and key events, giving a quick view of sequence and duration. A Gantt chart uses a two-dimensional grid with tasks along one axis and time along the other, showing each task as a horizontal bar for its duration and scheduled start and end dates.
When should I use a timeline instead of a Gantt chart?
A timeline works well for simple projects with minimal dependencies, linear sequences, and audiences who need a high-level overview, such as executives, clients, or new team members. A Gantt chart is better for complex workflows with many interdependent activities, resource allocation needs, and detailed progress tracking.
How do Gantt charts show task dependencies?
Gantt charts render dependencies as explicit connectors, usually arrows linking one task bar to the next. These links can show relationship types such as finish-to-start, start-to-start, and finish-to-finish sequencing, making the ripple effect of a delay visible.
Can a Gantt chart help with resource allocation?
Yes. In a Gantt chart, each task bar can carry an assigned owner, an estimate of effort, and start and end dates, so overlapping bars can signal that a team member is overbooked. Managers can then shift deadlines, redistribute tasks, or bring in extra help.
Why might a Gantt chart be a bad choice for a simple project?
A detailed Gantt chart can add administrative weight and maintenance overhead without adding meaningful insight on straightforward projects. Overcomplicating simple projects with dense Gantt charts can obscure the overall flow, and teams may spend more effort updating the chart than managing the work.
How can timelines and Gantt charts be used together?
A practical approach is to establish the Gantt chart as the single source of truth for execution and use the timeline as a filtered, high-level visualization of the underlying data. This works best with software that supports multiple views from the same dataset and keeps changes synchronized.
Tony Astor
Tony writes about data visualization and the tools people use to build charts and dashboards. More about Data Illustrator