Gantt Chart: How to Plan Projects Visually
 By Tony Astor ·

Gantt Chart
A Gantt chart is a horizontal bar graph that displays a project schedule across a timeline. Each task appears as a bar whose left edge marks the start date and right edge marks the end date, with bar length showing duration. Tasks run vertically down the left side and dates run horizontally across the top, letting viewers see when activities begin, end, and overlap.
Table of Contents
- Gantt Chart Basics
- Key Elements
- Setting Up Your Project
- Estimating Task Durations
- Identifying the Critical Path
- Mapping Task Dependencies
- Establishing Clear Milestones
- Building Your First Chart
- Managing Team Resources
- Tracking Progress
- Handling Schedule Changes
- Avoiding Common Mistakes
- Gantt Charts vs. Kanban
- Real-World Examples
- Project Dashboard
Gantt Chart Basics
A Gantt chart is a horizontal bar graph that displays a project schedule across a timeline. Each task in the project appears as a bar, with the bar’s left edge marking the start date and its right edge marking the end date. The length of the bar corresponds directly to the duration of the task, so longer bars represent longer activities. Tasks are typically listed vertically along the left side of the chart, while dates run horizontally across the top, creating a grid in which every bar occupies its own row and time span. This arrangement lets viewers see at a glance which activities are planned, when each one begins and ends, and how the bars overlap with one another.
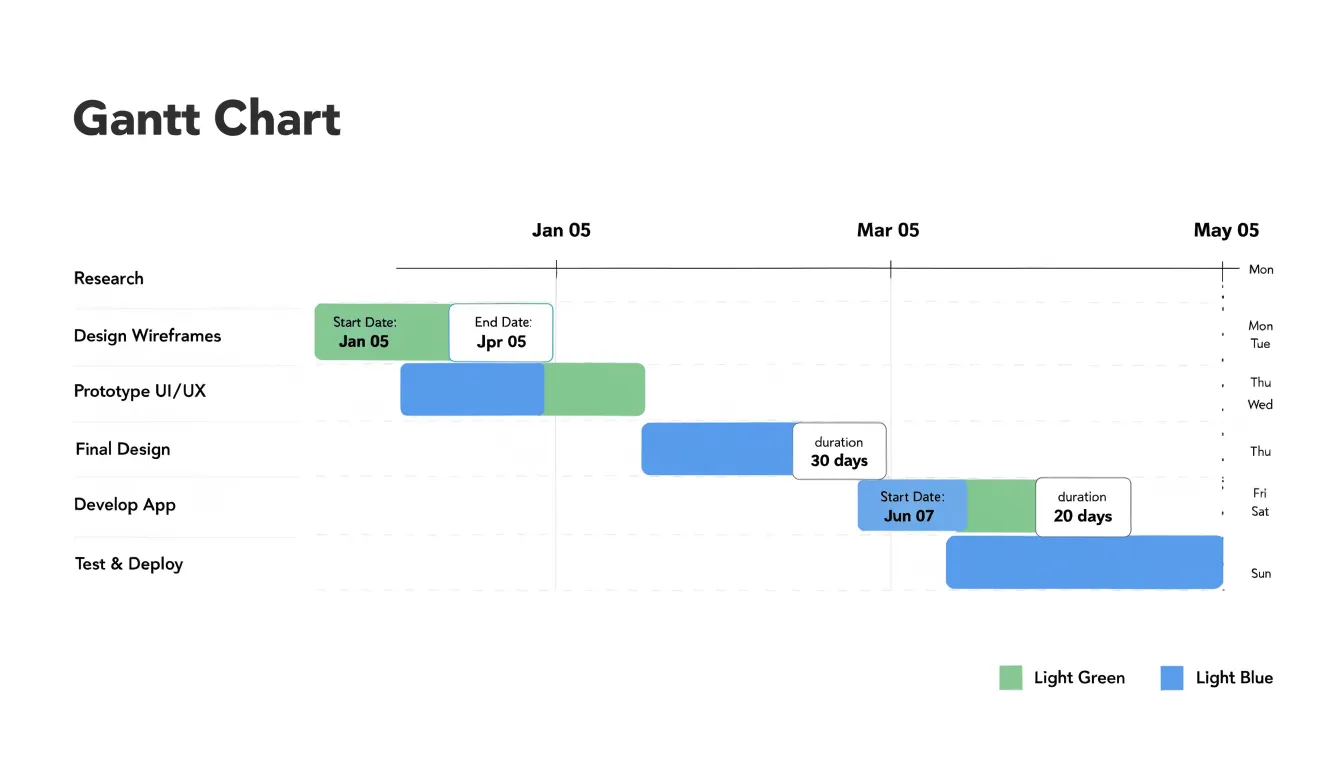
The tool takes its name from Henry L. Gantt, a mechanical engineer and management consultant who popularized the format in the 1910s while working on production scheduling. Gantt built on earlier charting ideas used in engineering and logistics, refining them into a visual method for tracking work progress. His charts were famously employed on large infrastructure and manufacturing projects, including efforts during the First World War, where supervisors needed a clear picture of what had been completed and what remained. The approach spread into construction, engineering, and eventually general project management because it translated complex schedules into a form that could be read quickly by managers and workers alike.
Beyond simple task bars, Gantt charts often incorporate dependencies and milestones, while modern versions add progress shading within each bar and resource assignments. The chart functions as both a planning instrument and a communication device, giving teams a shared reference for sequencing, deadlines, and workload distribution.
Key Elements
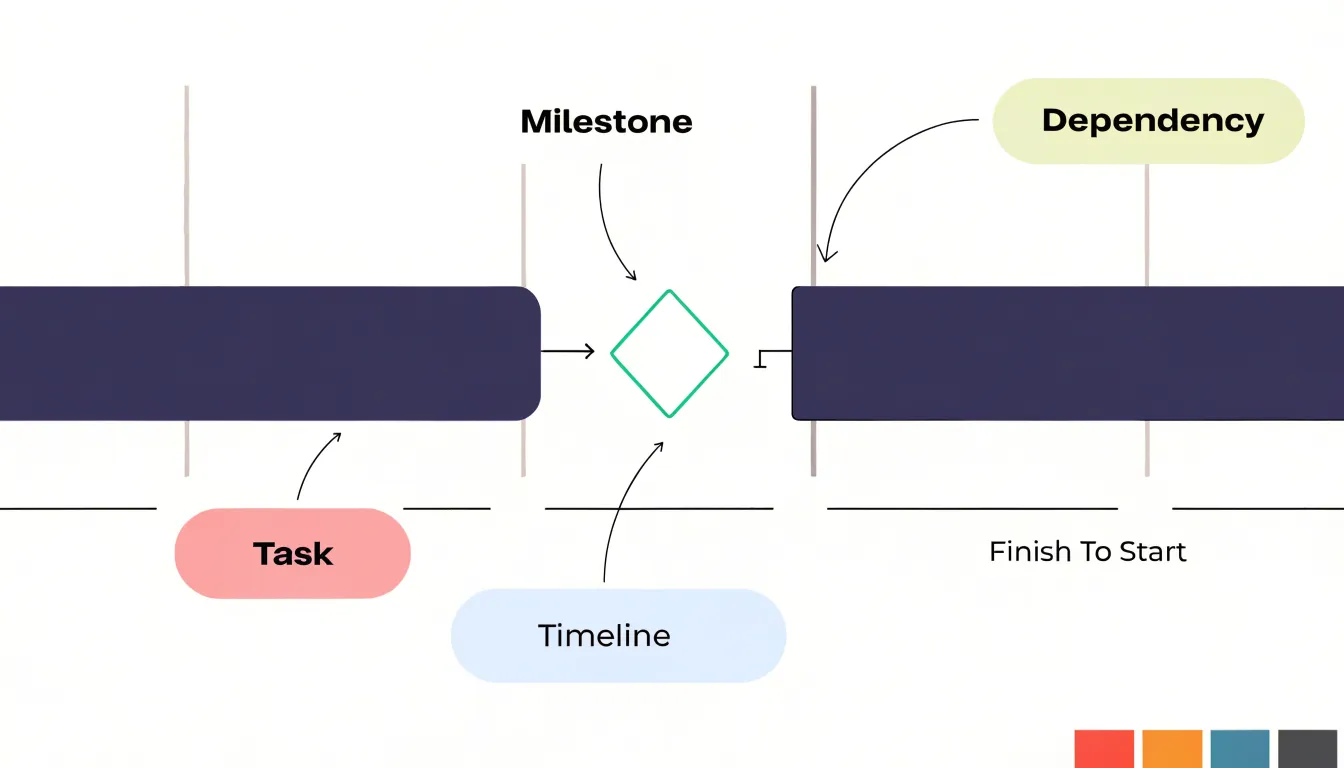
A Gantt chart relies on three essential building blocks: tasks, milestones, and dependencies.
- Tasks are the individual work units that make up the project, such as drafting a report or coding a feature. Displayed as horizontal bars spanning their start and end dates, tasks can be broken down into subtasks for greater detail, allowing teams to manage complex work at both high and low levels.
- Milestones are major achievements or significant points in the timeline, such as the approval of a design or the launch of a product. Usually represented as diamond shapes, milestones have zero duration and serve as checkpoints to track progress and communicate important dates to stakeholders.
- Dependencies are the logical relationships between activities that define the order in which tasks must be performed—for example, a testing task cannot begin until the development task is complete. Shown as arrows connecting tasks, dependencies illustrate the sequence, highlight critical paths, and help identify potential bottlenecks.
Setting Up Your Project
Setting up a Gantt chart begins long before any bars are drawn. The first task is compiling a complete work breakdown structure, which means decomposing the entire project into progressively smaller, manageable pieces until each element represents a unit of work that can be estimated, assigned, and tracked. Start with the major deliverables the project must produce, then break each deliverable into its component sub-deliverables, and continue subdividing until you reach work packages small enough to schedule with confidence. A useful rule of thumb is that any task lasting longer than a few weeks should be examined for further breakdown.
Listing all required deliverables sits at the heart of this process. Review the project charter, statement of work, contracts, and any requirements documents to identify every output the client or stakeholders expect. Include internal deliverables such as design reviews, test plans, and approval milestones alongside external ones. Miss a deliverable here and it will surface later as an unplanned task that disrupts the entire schedule.
Organizing project scope means grouping these tasks into logical categories, often following the phases of the project lifecycle or the major functional areas of the product. This grouping becomes the skeleton of the chart’s task list. Assign a unique identifier to each task, record its estimated duration, note dependencies you already know about, and identify the responsible person or team. Capture anything out of scope in a separate list so the boundary of the project remains clear.
Involving the people who will actually perform the work during this stage improves accuracy and buy-in. Once the task list is complete, reviewed, and agreed upon, the chart merely visualizes decisions already made.
Estimating Task Durations
Every dependency and milestone downstream rests on the duration numbers assigned to each task. A practical starting point is to break each task into units small enough to visualize clearly, typically between half a day and a few days, since large blocks of time are far harder to judge and tend to conceal hidden work. With granular tasks in hand, estimators can draw on several complementary techniques:
- Analogous estimating compares the task to similar work completed in past projects.
- Parametric methods apply known ratios, such as hours per deliverable, to new work.
- Three-point estimating asks team members for optimistic, most likely, and pessimistic durations, then blends them into a single figure that reflects genuine uncertainty.
Accuracy improves dramatically when subject matter experts are consulted directly. The people who will perform the work understand its quirks, from setup overhead to approval cycles, that managers often overlook. Ask experts to walk through the task step by step, identify what could slow it down, and describe what a realistic finish looks like rather than an ideal one. Capturing historical data from previous projects gives these conversations an empirical anchor.
Buffer time deserves deliberate treatment rather than an afterthought. Rather than padding every task, which inflates the schedule and obscures where risk truly sits, teams can hold a shared contingency reserve at the project or phase level and manage it openly. Individual buffers should be reserved for tasks with identifiable uncertainty, such as external dependencies or unfamiliar technology. Documenting the assumptions behind each estimate keeps the reasoning visible, so the schedule can be revised intelligently when reality diverges from the forecast.
Identifying the Critical Path
To identify the critical path, start by listing every task in the project along with its duration and its dependencies. Arrange the tasks in sequence from project start to project finish, trace each possible path through the network, and add up the durations of the tasks along that path. The path with the greatest total duration is the critical path, because it represents the longest stretch of work the project must complete. Its total duration equals the shortest possible project completion time.
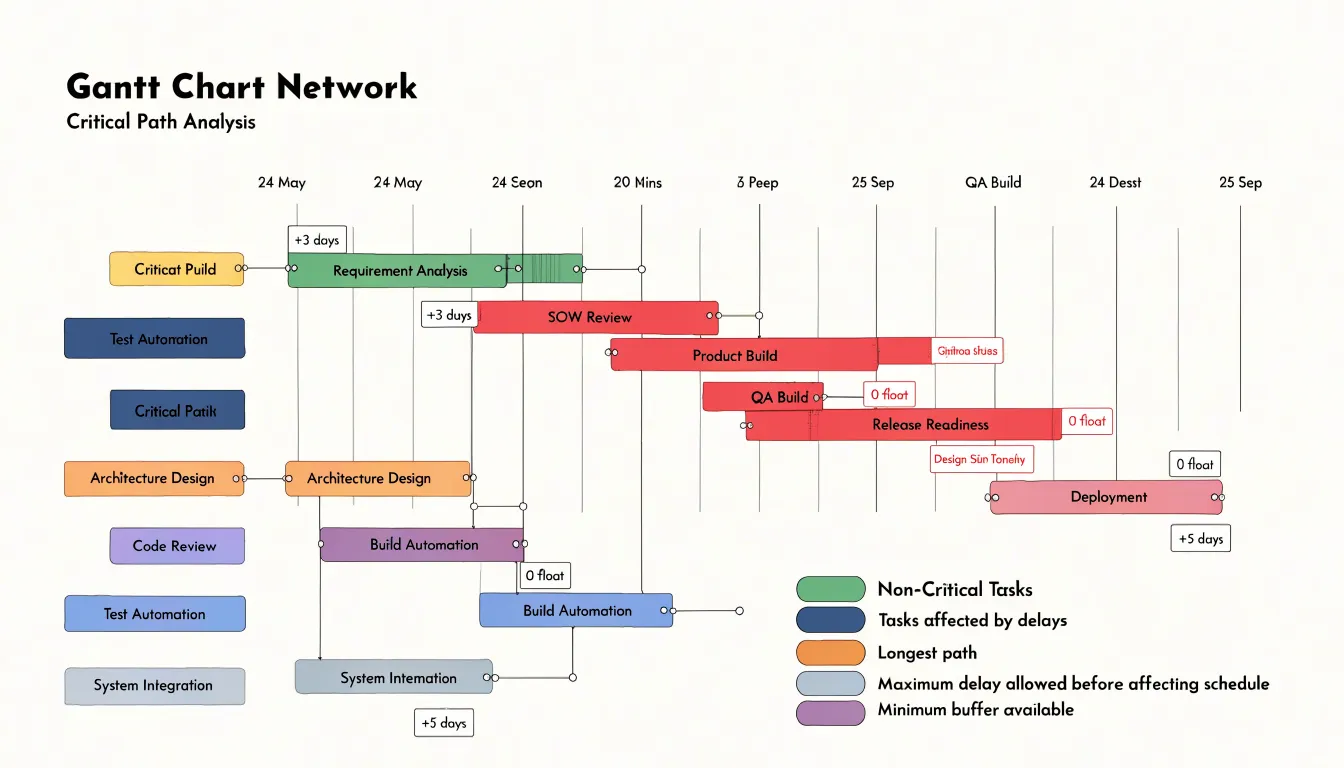
After locating the critical path, calculate float, also called slack, for every task. Float is the amount of time a task can slip without pushing the project end date later. Tasks on the critical path carry zero float, which means any delay in those activities moves the final completion date by the same amount. These zero-float activities deserve the closest attention during planning and execution, since they have no buffer to absorb problems.
It also helps to identify near-critical paths whose total duration falls just below that of the critical path. These paths carry small amounts of float and can become critical if their tasks run late. Pinpointing zero-float activities shows exactly where schedule pressure concentrates and where extra resources or closer tracking will pay off most. As the project progresses, update the calculations, since float shifts when tasks finish early or late, and the critical path itself can move to a different sequence of activities.
Mapping Task Dependencies
Mapping task dependencies ensures that the sequence of work reflects real-world constraints and logical flow. Four main types of task relationships form the foundation of a Gantt chart:
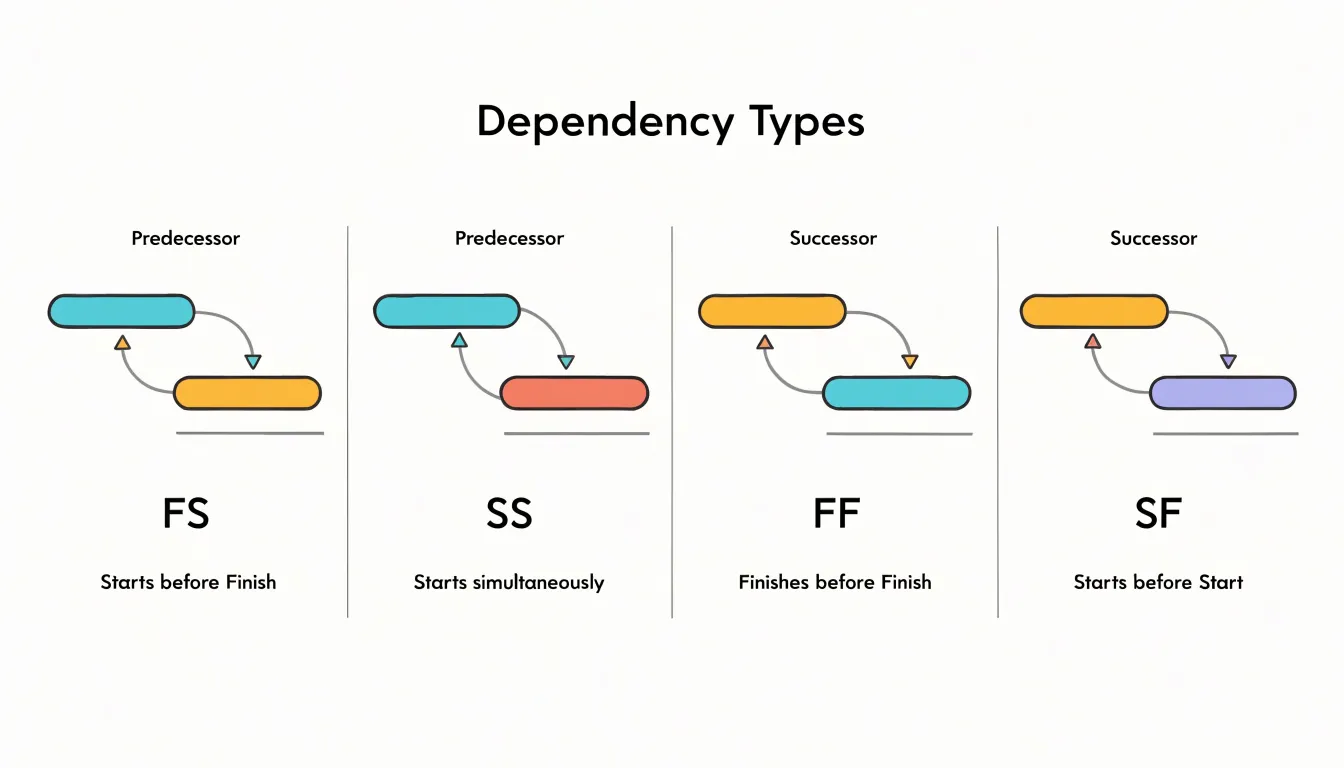
- Finish-to-start (FS) is the most common: a successor task cannot begin until its predecessor finishes, as when testing begins only after development is complete.
- Start-to-start (SS) allows two tasks to begin simultaneously, provided the successor starts no earlier than the predecessor; this is useful for parallel activities like drafting documentation alongside coding, where both can proceed once initial requirements are set.
- Finish-to-finish (FF) links the completion of two tasks, meaning the successor cannot finish until the predecessor does—relevant for tasks like finalizing a report that depends on the completion of data analysis.
- Start-to-finish (SF) is rare but applies when a task’s completion depends on another task’s start, such as a legacy system being retired only after its replacement goes live.
Linking sequential activities correctly requires more than selecting a relationship type. Each link should carry a lag or lead time when necessary—for example, a two-day delay after concrete curing before framing begins. Dependencies must also reflect true logical constraints rather than arbitrary preferences; otherwise, they create unnecessary critical path length and reduce scheduling flexibility. Mapping dependencies accurately involves reviewing each activity’s inputs and outputs, consulting team members who perform the work, and validating the resulting network for circular references or redundant links. Once mapped, these relationships drive the chart’s visual connectors and enable automatic schedule updates when dates shift.
Establishing Clear Milestones
Begin establishing milestones by identifying significant phase completions or key decision gates where progress can be objectively assessed, such as the completion of a design phase, approval of a prototype, or delivery of a critical component. Involve your team and stakeholders in this identification process to ensure alignment.
Represent each milestone as a zero-duration marker on the Gantt chart to distinguish it from tasks with duration and highlight its role as a checkpoint. Regularly review and update milestones as the project evolves so they remain relevant and accurately reflect the project’s critical path.
Building Your First Chart
Open your preferred tool, whether that is a dedicated project management application or a spreadsheet, and create a table with columns for the task name, start date, end date, duration, and the person responsible. List each work item on its own row, aiming for tasks that take a few days and have a single clear owner. Enter the start date for the first task, then fill in the end date and let the software calculate the duration, or enter the duration and allow the tool to derive the end date.
Next, establish the sequence in which the tasks must occur. In a spreadsheet, capture this by adding a column for predecessor tasks; in dedicated software, draw dependency arrows directly between bars. With dependencies in place, review the calculated dates for consistency and adjust any entries that create unrealistic overlaps or idle gaps. Assign resources at this stage so everyone knows who owns each block of work.
The final step is generating the visual representation. In a spreadsheet, this typically means creating a stacked bar chart from the date columns and formatting the bars so the first segment is invisible, producing the horizontal bars against a calendar axis. Dedicated tools render this chart automatically from the table you have built. Add milestones for significant checkpoints, label the axes with dates and task names, and apply consistent colors to distinguish phases or owners. Save this baseline version so future progress can be compared against the original plan, then hold a brief review with the team to confirm the sequence, dates, and responsibilities.
Managing Team Resources
Assigning an owner to each task bar is where workload planning starts. List your team members alongside the tasks they are suited to, then check how their assigned bars stack up across the same date ranges. Overlapping bars on one person’s row are the first warning sign of overload. Spread assignments so that no individual carries heavy concurrent work while others sit idle.
Balancing workloads across the timeline requires looking beyond the current week. A task that lands during an already busy period can be shifted earlier or later if dependencies allow, and the chart makes those adjustments visible. Where several people share a skill, rotate assignments between them so expertise stays distributed and no single person becomes a permanent bottleneck. Flag any task that only one team member can perform; these single points of failure deserve extra buffer time or a cross-training plan.
Preventing burnout means watching sustained pressure, not just isolated busy days. Consecutive weeks of full allocation leave no room for illness, review cycles, or unexpected scope creep. Build deliberate slack into each person’s schedule and treat that slack as protected capacity rather than free time to fill. Keep an eye on the critical path, since delays there tend to push extra work onto whoever is nearest the blockage.
Revisit the resource view regularly. Weekly check-ins against the chart let you spot bottlenecks before they cause missed deadlines and rebalance tasks while there is still room to maneuver.
Tracking Progress
Update completion percentages at a consistent cadence—weekly is typical for most projects, though critical phases may need daily attention. Use a simple, objective scale: 0% for not started, 100% for fully complete, and increments of 25% for work in progress based on tangible deliverables. Avoid subjective estimates like “90% done” that can linger for weeks.
When updating, record the date and actual effort expended so you can compare actual progress against the baseline plan. Calculate schedule variance by subtracting planned progress from actual progress at the same date; a positive variance means you’re ahead, and a negative one means you’re behind. Visualize this with a progress line or overlay bar on the Gantt chart so trends are immediately visible.
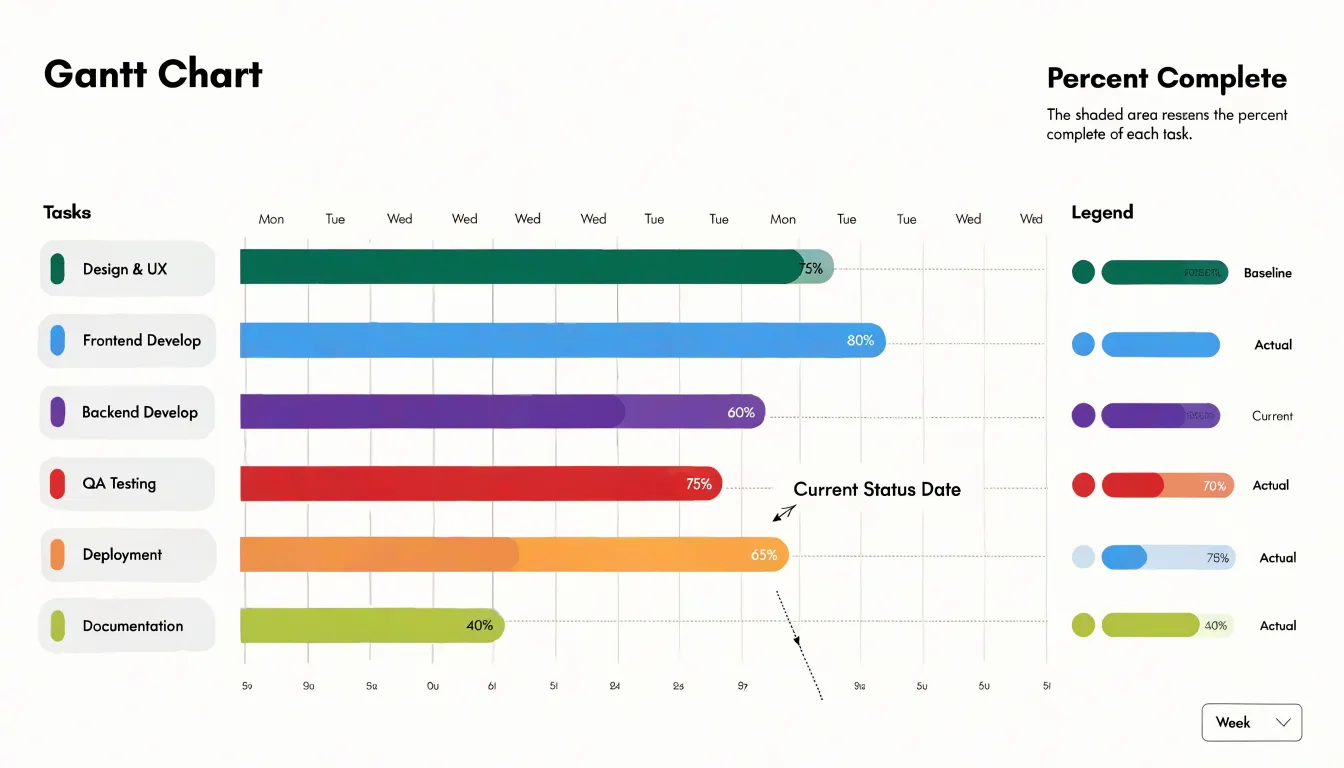
Hold regular status reviews—weekly team meetings and monthly stakeholder updates—to discuss variances, root causes, and corrective actions. During reviews, focus on tasks with the largest negative variance and those on the critical path. Document decisions and update the chart immediately after each review to reflect changes in duration, dependencies, or resources.
Handling Schedule Changes
When a plan shifts, distinguish between the original baseline, which records what was committed at project start, and the revised baseline that reflects current reality. Preserve the original baseline for reference, then create a new version with a clear date stamp and a short note explaining what prompted the change. Rebaselining involves updating task durations, dependencies, and start and finish dates in the Gantt chart, then recalculating the critical path so the schedule reflects the new sequence of work. Version-control each revision so the history of changes remains visible and auditable.
Assessing downstream impacts requires tracing how a delay propagates through linked tasks. A slip in one activity often pushes successors, consumes float, and can turn a non-critical path into the new critical path. Planners should review dependency chains, check where slack has been absorbed, and identify milestones that now fall at risk. It also helps to model the ripple effects on shared resources and external commitments, since a delayed handoff can disrupt vendors, approvals, or dependent teams. Quantifying the impact in terms of days lost and milestones affected gives decision-makers a concrete picture of the consequences.
Announce schedule changes promptly rather than waiting for a status meeting, and explain the cause, the revised dates, and the recovery actions underway. A shared Gantt view with clearly marked baseline versus current dates lets everyone see the difference at a glance. Regular updates, a short change log, and named owners for affected workstreams help stakeholders understand both what moved and why.
Avoiding Common Mistakes
Even well-planned schedules can fail when teams fall into three common traps:
- Over-complicating the chart: Cramming in every micro-task, color-coding dozens of categories, and layering on elaborate formatting makes the chart difficult to read and maintain. A cluttered schedule obscures the critical path and discourages team members from engaging with the plan. Keep the chart focused on meaningful milestones and work packages.
- Neglecting dependency updates: Task relationships shift constantly as work progresses, priorities change, and new information emerges. When dependencies are left stale, downstream tasks may appear ready to begin while their prerequisites remain unfinished, leading to wasted effort and idle time. Regularly revisit task links to prevent cascading delays.
- Ignoring team capacity limits: A schedule may look perfectly sequenced on paper while quietly assuming that every team member can work at full speed on multiple tasks at once. Assigning work without checking availability leads to overloaded individuals, missed deadlines, and burnout. Build in realistic effort estimates and account for vacations, meetings, and other commitments.
Gantt Charts vs. Kanban
Gantt charts and Kanban boards offer distinct lenses on project work. A Gantt chart’s time-based structure suits projects with fixed deadlines, sequenced phases, or complex interdependencies—such as construction, product launches, or event planning—where one delayed task cascades into others. It makes critical paths visible and supports forecasting and resource leveling across a calendar.
Kanban boards instead emphasize flow, displaying work as cards moving through columns that represent process stages, from backlog to done. With work-in-progress limits and a continuous pull system, Kanban surfaces bottlenecks, balances capacity, and encourages steady delivery. This flow-based model fits operational or maintenance work, support queues, and iterative development where the volume and timing of incoming tasks vary and priorities shift frequently. Kanban supports continuous improvement through metrics such as cycle time and throughput.
When deadlines, sequencing, and cross-team dependencies dominate, a Gantt chart provides the structure needed for planning and stakeholder communication. When the goal is managing a steady stream of items through a defined process, a Kanban board offers flexibility and responsiveness. Many organizations combine both: Gantt charts for high-level program planning and Kanban boards for day-to-day execution. The optimal choice depends on project constraints, team maturity, and reporting needs.
Real-World Examples
Across industries, teams adapt Gantt charts to fit their specific workflows and constraints:
- Construction: Project managers coordinate sequences from site preparation to final inspection, such as ensuring framing precedes roofing. A residential builder might use a Gantt chart to schedule subcontractors so electricians and plumbers don’t conflict, and to track progress against milestones like foundation completion.
- Software development: Teams map sprints, feature development, testing, and deployment across both agile and waterfall methodologies. For a mobile app project, a chart can enforce dependencies like completing a backend API before frontend integration, while tracking parallel workstreams—UI design, core functionality, and quality assurance—and holding buffer time for bug fixes.
- Event planning: Organizers plot venue booking, vendor coordination, marketing, and day-of logistics for conferences, weddings, or festivals. Dependencies ensure tasks like sending invitations happen only after finalizing the guest list, while overlapping bars track concurrent work like speaker confirmation, catering arrangements, and AV setup.
Project Dashboard
Scheduling detail becomes far more useful for executive oversight when it flows into a project dashboard. The dashboard serves as a translation layer, converting task-level bars, dependencies, and milestones into the handful of indicators leadership needs to judge whether a project is on track. By pulling data directly from the Gantt chart, the dashboard stays current without manual re-entry, reflecting the actual state of work rather than a stale snapshot.
Effective integration begins with identifying the metrics that matter at the top level: percent complete against plan, milestone status, schedule variance, upcoming deadlines, and the count of tasks running behind. These figures can be calculated from the dates and progress values already in the Gantt chart, then surfaced as summary cards, trend lines, or red-amber-green indicators. Drilling down from a dashboard tile back to the underlying Gantt view lets an executive move from a concerning signal to the specific tasks driving it in a single step.
Assigning each milestone a named owner and displaying those names alongside status turns abstract schedule data into personal responsibility. Regular dashboard reviews, whether weekly or tied to steering committee meetings, create a rhythm in which owners report progress and flag risks before deadlines slip, clarifying escalation paths and showing which workstreams need attention. When schedule data, ownership, and high-level metrics live in one place, leaders can reallocate resources and resolve blockers with confidence.
Frequently Asked Questions
What is a Gantt chart and what does each bar represent?
A Gantt chart is a horizontal bar graph that displays a project schedule across a timeline. Each bar marks a task’s start date at its left edge, end date at its right edge, and its length corresponds to the task’s duration.
What are tasks, milestones, and dependencies in a Gantt chart?
Tasks are individual work units shown as horizontal bars, milestones are zero-duration checkpoints usually shown as diamond shapes, and dependencies are logical relationships shown as arrows that define the order in which tasks must be performed.
How do you identify the critical path in a Gantt chart?
List every task with its duration and dependencies, arrange the tasks in sequence from project start to finish, and add up the durations along each possible path. The path with the greatest total duration is the critical path, and its total duration equals the shortest possible project completion time.
What are the main types of task dependencies?
The four main types are finish-to-start, start-to-start, finish-to-finish, and start-to-finish. Finish-to-start means a successor cannot begin until its predecessor finishes, while the others link starts or completions in different ways.
How often should you update completion percentages in a Gantt chart?
Update completion percentages at a consistent cadence—weekly is typical for most projects, though critical phases may need daily attention. Use an objective scale such as 0% for not started, 100% for fully complete, and increments of 25% for work in progress based on tangible deliverables.
What common mistakes should you avoid when using a Gantt chart?
Common mistakes include over-complicating the chart, neglecting dependency updates, and ignoring team capacity limits. Assigning work without checking availability can lead to overloaded individuals, missed deadlines, and burnout.
Tony Astor
Tony writes about data visualization and the tools people use to build charts and dashboards. More about Data Illustrator