Funnel Chart vs Bar Chart: Showing Conversion Data
 By Tony Astor ·

Funnel Chart vs Bar Chart
A funnel chart shows sequential stages of a process, with each segment’s width representing how many people reached that step, making it ideal for tracking conversion and drop-off through a customer journey. A bar chart compares independent, non-sequential categories side by side using bar length, making it better for ranking discrete values without implying flow.
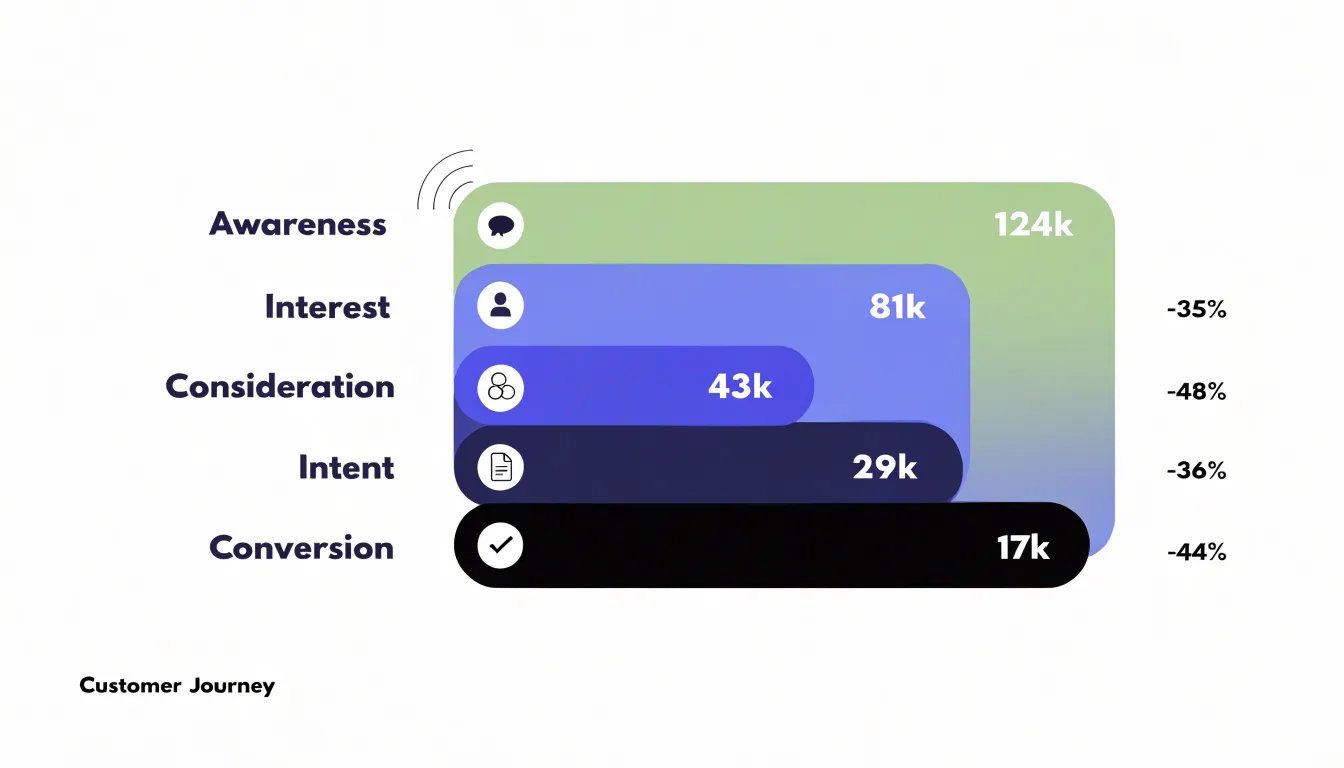
Table of Contents
Funnel Chart
A funnel chart is built for sequences. Each stage of the chart represents a defined milestone in a process, and the width of each segment shows how many people reached that point. The shape narrows from top to bottom, starting with the full population at the entry point and ending with the smaller group that completes the final step. This geometry makes the chart a natural fit for customer journeys, where an audience moves through awareness, consideration, intent, purchase, and retention in a fixed order.
The value of the funnel lies in how it exposes cumulative loss. When a marketing team plots a thousand visitors at the top and two hundred at checkout, the chart makes the drop visible as a physical narrowing. Each stage shows both the remaining count and the gap between it and the stage above, so viewers can see where volume disappears. Some funnel charts annotate each segment with conversion rates, turning the visual into a compact summary of step-by-step performance.
Funnel charts suit any process with a defined start and end and a known order of stages. Lead generation pipelines, onboarding sequences, and application workflows all fit the model. The requirement is a linear progression; when the journey branches into parallel paths or loops back on itself, the funnel becomes a simplification. Even so, the chart communicates the cumulative effect of sequential losses well, which is why product and growth teams rely on it for journey analysis.
Reading a funnel chart means comparing segment widths across stages and noting where the steepest contraction occurs. Those points of sharp narrowing usually indicate friction worth investigating. The chart does not explain why people leave, and that explanation comes from other analysis; the funnel’s role is to direct attention to the stage where the largest loss happens, making it a useful starting point for diagnosis.
Bar Chart
A bar chart compares discrete categories side by side. Each category is represented by a rectangular bar whose length is proportional to the value it represents, allowing viewers to quickly assess relative magnitudes. This makes bar charts effective for displaying non-sequential data, where the categories are independent and have no inherent order. For example, a bar chart could show the population of different countries, the sales figures for various products, or the number of employees in different departments. The side-by-side arrangement of bars facilitates direct visual comparison, as the human eye can easily detect differences in length.
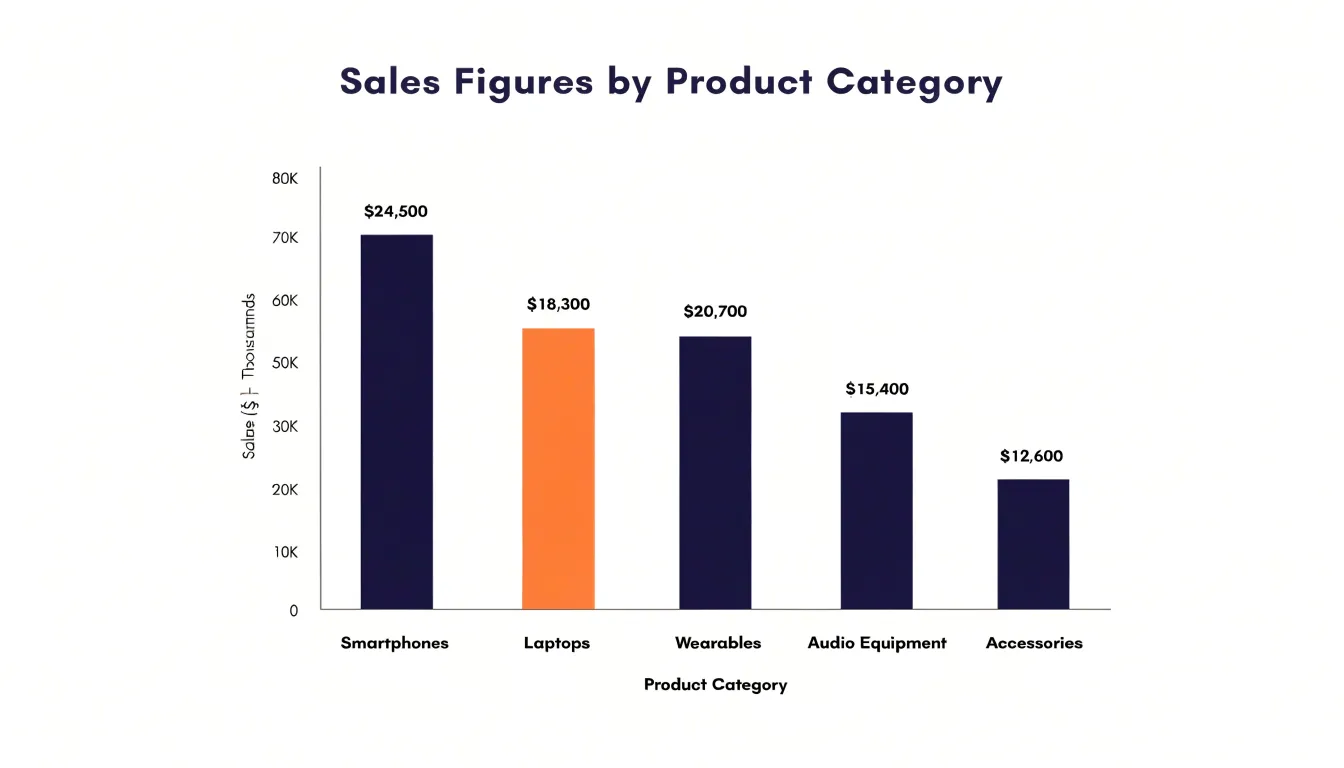
Bar charts can be oriented vertically or horizontally, depending on the nature of the categories and the available space. Vertical bar charts are common for comparing categories with short labels, while horizontal bar charts are useful when category names are long or when there are many categories. They can be enhanced with features such as color coding, data labels, and error bars to convey additional information.
However, bar charts are most effective when the number of categories is limited; too many bars can clutter the chart and make comparisons difficult. Additionally, the scale should start at zero to avoid misleading representations.
Funnel vs Bar Chart
The two chart types rest on fundamentally different structural architectures. In a funnel chart, stages are nested beneath one another in a fixed sequence. The stages cannot be shuffled without breaking the logic of the display, because each stage represents a position in a process that moves forward in time or sequence, from initial contact through to final conversion or completion.
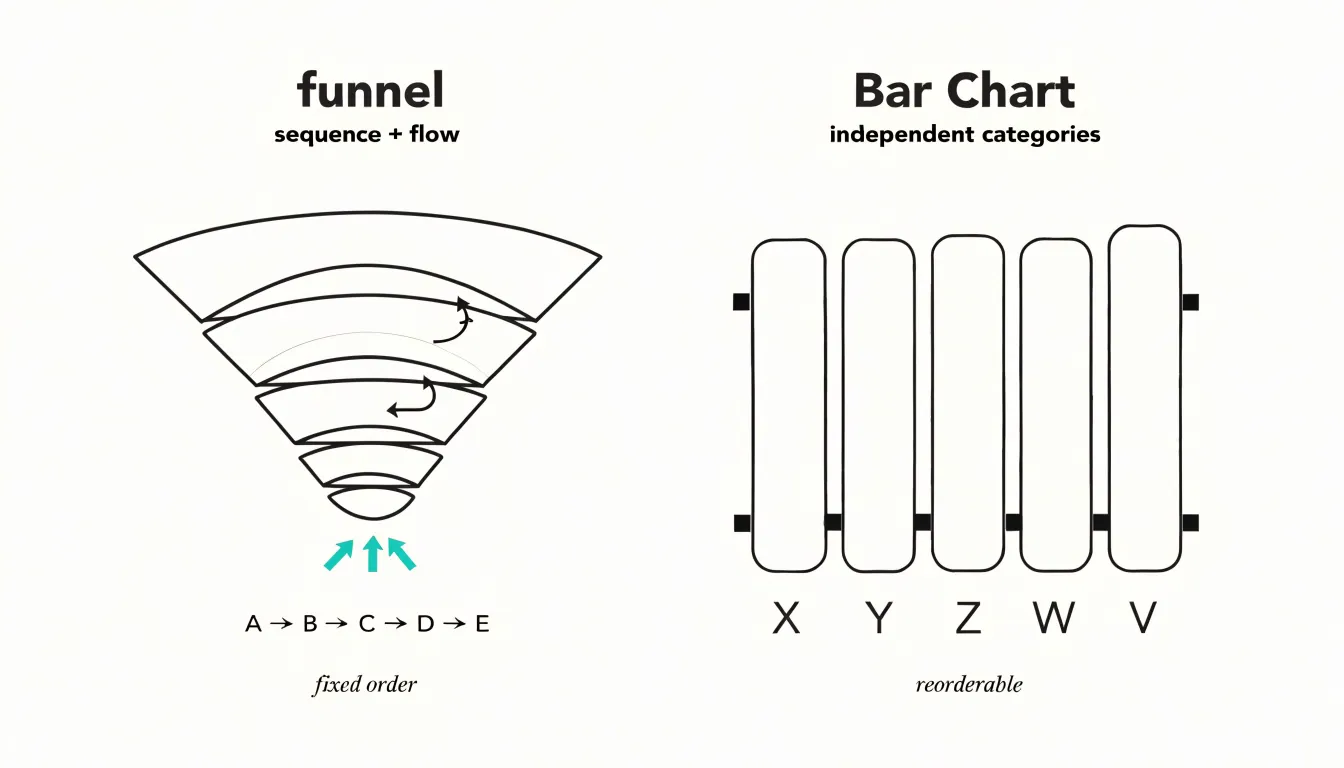
A bar chart operates on different principles. Each bar stands alone as an independent dimension, and the bars are typically uniform in width, separated by consistent gaps. The height or length of each bar encodes its value, while the width stays constant so it does not compete for the reader’s attention. Bars can be reordered, sorted by magnitude, grouped, or compared side by side without any loss of sense, because the chart imposes no inherent sequence on its categories. Each bar answers a discrete question about a single category’s magnitude.
These architectural differences shape what each chart communicates. The funnel’s nested, tapering structure encodes flow and attrition, treating the whole as a connected progression. The bar chart’s independent, uniform structure encodes comparison among peers, treating each item as a standalone quantity.
Funnel Chart
The key analytical value of a funnel chart comes from calculating the percentage leak between each pair of consecutive steps. This is done by taking the difference in count between stage N and stage N+1, dividing by the count at stage N, and multiplying by 100. For example, if 1,000 users start a checkout flow and 800 reach the payment step, the leak from step one to step two is 20 percent.
Repeating this calculation for every transition produces a precise drop-off profile. Teams can then rank these leaks to find the most severe abandonment points. A 45 percent leak between product view and add-to-cart signals a different problem than a 10 percent leak between payment and confirmation. By isolating the exact step where users abandon, teams can direct investigation and resources to the highest-impact friction. This might involve usability testing, session recordings, or A/B tests targeting that specific transition. Funnel charts thus enable prioritized improvements and measurable progress over time.
Bar Chart
A bar chart is the right tool when the metrics under examination stand on their own across categories or time periods that share no ordered relationship. Monthly sales figures fit this pattern well. January does not logically feed into February, and February does not convert into March. Each month’s revenue is a closed result, measured and reported on its own terms, and arranging all twelve months side by side lets viewers spot highs, lows, and trends without any suggestion that one period produced the next.
The same holds for regional leads. A lead generated in the Northeast does not move through the Southeast on its way to the West, and no stage order connects one territory to another. What matters is relative volume: which region is producing more, which is lagging, and how the distribution looks across the map of operations.
The structure of the chart reinforces this independence. Bars share a common baseline, so every value is measured against zero and against its peers rather than against a prior step in a process. There are no connectors between bars, no tapering, and no gradient that would imply flow or attrition from one category to the next. A viewer reading monthly sales or regional leads sees a set of parallel facts laid out for inspection, and the chart invites ranking, grouping, and comparison rather than tracing a journey.
This also makes bar charts flexible enough to hold categories that change order of interest: sort by value to highlight the leader, sort alphabetically to help people find a specific item, or group bars to reveal subcategories within each metric. Every arrangement remains faithful to the data because no arrangement pretends the categories are sequential.
Funnel Chart
In a sales pipeline, prospects move from initial lead qualification through to closed deals. By displaying each stage in order, a funnel chart allows account managers to see pipeline velocity clearly and take corrective action on bottlenecks. For example, if the segment between qualified leads and initial meetings is unusually narrow, it may indicate a need for better lead nurturing or more effective qualification criteria. Benchmarking conversion rates between stages also enables managers to set realistic targets.
The step-by-step visualization supports tracking of individual prospects as they move through the pipeline. Account managers can see how many prospects are at each stage, how long they typically spend there, and where they are most likely to stall. This facilitates forecasting and resource allocation, allowing more effort to be directed to stages with high potential for improvement. From sales representatives to executives, stakeholders can monitor the health of the sales pipeline at a glance, fostering discussions about strategy and execution.
Bar Chart
When marketing teams need a side-by-side comparison of channels such as Facebook, Google, and email, each channel receives its own bar, and the length of that bar encodes a performance metric like click-through rate or spend. A viewer can glance at the chart and see that email delivers a higher click-through rate than Facebook, or that Google accounts for a larger share of spend than the other two channels combined.
The value of this approach lies in its freedom from temporal dependencies. Campaign data often spans weeks or months, and plotting performance over time introduces trends, seasonality, and fluctuations that can obscure the simple question of which channel is doing well. A bar chart sidesteps that complexity by aggregating each channel’s metrics into a single summary value. Marketers can compare total spend, average click-through rate, or any other chosen metric across channels without worrying about how the data is distributed week to week.
This makes bar charts useful for budget allocation discussions and channel audits. When stakeholders want to know where money is going and which sources are producing results, a categorical comparison answers the question directly. Charts can be sorted from highest to lowest, grouped to show multiple metrics at once, or colored to distinguish paid from organic sources.
Funnel Chart
A funnel chart reveals where revenue leaks out of a process by isolating high-friction operational phases. In a sales pipeline, a gentle decline from lead to qualified opportunity followed by a sharp narrowing from proposal to closed-won points to the proposal stage as a bottleneck. This visual cue directs attention to the specific phase where prospects disengage, prompting investigation into causes such as complex pricing, slow approvals, or unclear value propositions.
The same principle applies to e-commerce checkout flows, subscription renewal sequences, or customer onboarding journeys. Each stage’s conversion rate can be benchmarked to highlight where actual performance deviates from expected patterns. By pinpointing these friction points, teams can prioritize process improvements that yield the greatest impact on overall conversion yield. When used to track changes over time, the chart also shows whether remediation efforts successfully widen narrowed stages, helping teams recover lost revenue and enhance pipeline efficiency.
Funnel Chart
Funnel charts work when the underlying data is genuinely sequential and monotonic. Problems arise when analysts apply the format to processes that do not fit that shape, forcing the layout to deliver a taper the data does not support.
The most common trap is treating non-linear journeys as linear. Real user behavior often moves backward, loops through stages, or converges on a shared step from multiple entry points. When such data is plotted on a funnel, the chart silently assumes a strict top-to-bottom progression, and the resulting wedge shapes imply a smooth decline that never occurred.
Skippable steps compound the issue. If a stage can be bypassed, its count may legitimately exceed the stage above it, and a funnel renderer will either drop that value, reverse the ordering, or distort widths until the visual obeys the expected taper. Each of these fixes introduces misleading information.
Best practice begins with a data audit before any chart is chosen:
- Check whether each stage has a true predecessor, whether skip paths exist, and whether counts can rise between stages.
- When the numbers cannot produce an honest narrowing shape, use a horizontal bar chart arranged in process order to preserve the sequence while letting each stage’s true magnitude show.
- Where a funnel remains appropriate, release the constraint that widths must monotonically decrease. Annotate stages that break the pattern and explain why, rather than reordering or merging stages to manufacture a clean wedge.
- Include absolute values and conversion rates beside every band so readers can verify the story for themselves.
- Document the logic behind stage order and any known skips directly in the chart caption.
Bar Chart
Much of the bar chart’s versatility for comparing distinct datasets comes from how bars can be arranged within a single chart. When several datasets share common categories, grouped bar layouts place bars side by side for each category, allowing readers to compare values both within a category and across categories. This arrangement works well for evaluating multidimensional performance, such as comparing revenue by product line across multiple regions or tracking survey responses across different demographic groups. Each bar retains its own visual space, and color coding distinguishes the datasets.
Stacked bar layouts take a different approach by placing bars on top of one another, showing both the total for each category and the contribution of each component. This format suits situations where the overall magnitude matters as much as the breakdown, such as total spending by department subdivided by expense type. A 100 percent stacked variant shifts the focus entirely to proportions, making it easier to compare relative shares across categories even when totals differ widely. Grouped bars emphasize direct comparison of individual values, while stacked bars highlight composition and cumulative totals.
Limiting the number of series, using consistent color palettes, labeling axes clearly, and providing legends or direct annotations all help keep multidimensional charts interpretable. Rotating labels or switching to horizontal bars can prevent crowding when category names are long.
Funnel Chart
A funnel chart gives e-commerce teams a structured way to audit how shoppers move through the checkout sequence: cart review, shipping information, payment entry, and order confirmation. This makes the chart a diagnostic instrument for checkout optimization, converting an abstract concern about abandoned carts into a stage-by-stage accounting of where customers drop off.
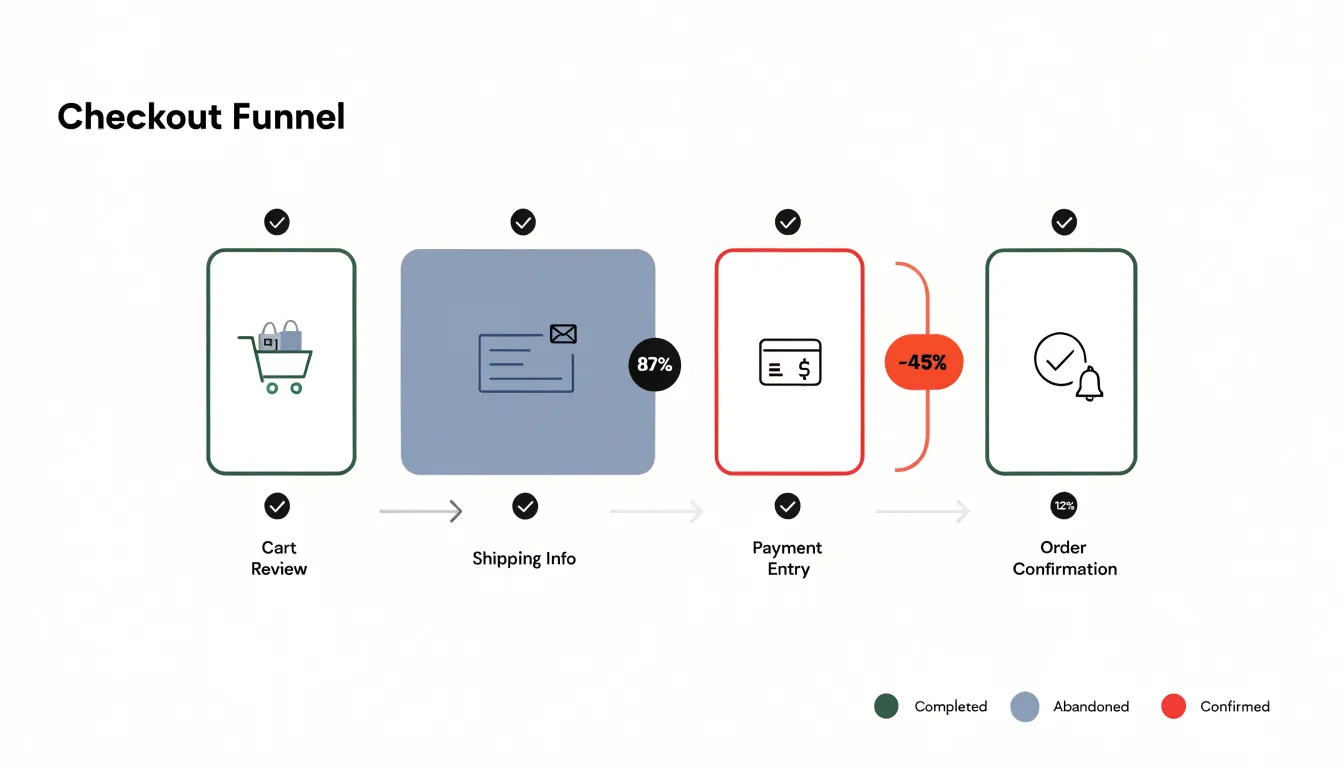
When the drop between two adjacent stages is unusually steep relative to the rest of the sequence, that gap points toward a specific cause:
- A sharp fall between the shipping and payment stages often coincides with a technical glitch such as a payment gateway timing out, a script failing to load, or an address validation service rejecting legitimate entries.
- A collapse between cart review and shipping may reflect form friction: too many required fields, unclear labeling, unexpected cost disclosures, or a mandatory account creation step that frustrates first-time buyers.
By isolating the stage where the loss concentrates, the funnel chart narrows the investigation to a manageable portion of the checkout flow. Auditing with a funnel chart also supports before-and-after comparison. Teams can capture a baseline funnel, deploy a fix to a specific step, and then re-measure the same stages to confirm whether the drop-off has shrunk. Over time, a series of these audits builds a record of which interventions reduced completed-transaction losses, helping prioritize development and design work on the checkout path.
Bar Chart
A bar chart is well suited to measuring lead source quality across marketing channels such as organic search, paid social, email, referral, and direct traffic. When the metric is conversion rate, each bar represents the proportion of leads from a given channel that ultimately convert, showing which sources deliver prospects who take the desired action. When the metric is average order value, the bars instead show how much revenue each converted customer tends to generate.
The practical value of this comparison lies in budgeting. A channel that produces a high volume of leads but a low conversion rate may be consuming spend without proportionate return, while a smaller channel with strong conversion and high average order value may deserve a larger share of the budget. By plotting conversion rate alongside average order value using grouped or stacked variants, analysts can identify which sources combine volume with quality and which merely inflate the top of the funnel.
For stakeholders who may not work with data daily, a manager can point to the tallest bar to explain which channel converts best and justify a reallocation of funds toward it.
Dashboard
Placing a funnel chart and a bar chart together on the same executive dashboard gives leadership a single place to read both the health of a process and the composition of its categories. While the funnel traces how a population moves through successive stages, the bar chart sits alongside it, breaking the same population into named categories—such as product lines, regions, or acquisition channels—and showing the relative size of each. Reading the two together, an executive can connect a narrowing funnel stage with the specific categories contributing most to that narrowing.
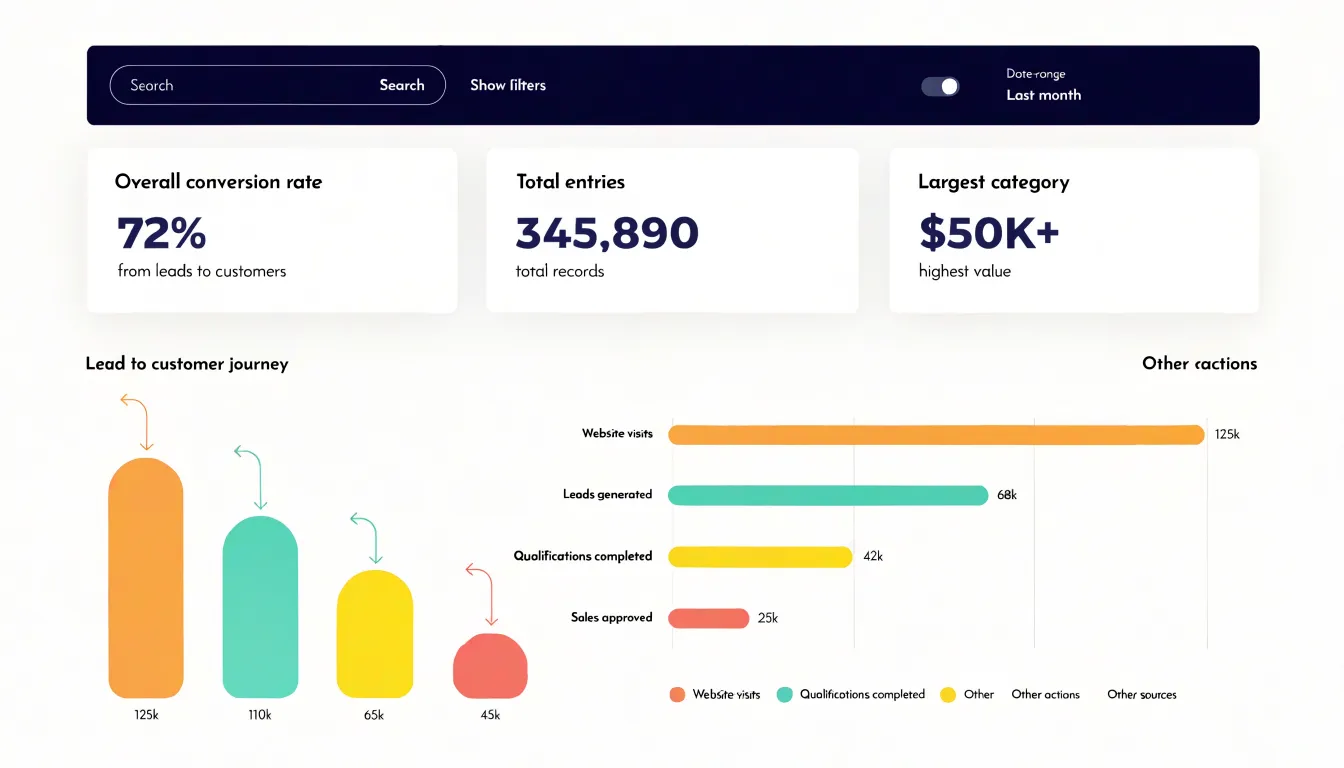
Layout matters when these charts share a dashboard:
- Align them so they draw from the same date range and the same underlying filters. A shared filter panel across the top of the dashboard lets a viewer switch time periods or segments once and watch both visualizations update in tandem.
- Use consistent color assignments; if a category appears in a particular color in the bar chart, the matching portion of the funnel should carry the same color so the eye can follow it across the page.
- Add complementary summary tiles above the two charts, such as compact metric cards showing overall conversion rate, total entries, and the largest category, to give context before a viewer drills into detail.
- Include tooltips that reveal exact counts at each funnel stage and precise values for each bar so analysts can verify what the visuals suggest.
Executives scanning the dashboard grasp overall process health from the funnel’s shape and category balance from the bars, while analysts can hover, filter, and compare to locate the precise stage and segment where attention will pay off.
Choosing a Chart
Start by examining the structure of the data itself. When values represent consecutive stages in a process, the sequence carries meaning that a bar chart cannot express. When values are independent categories, a bar chart keeps each item distinct and comparable. Ask whether the order of the categories matters; if reordering them would not change the story, bars are the natural fit.
Next, consider what the audience needs to take away and the level of precision required. Executives reviewing conversion performance want to see where the drop-off occurs, which favors a funnel. Operational teams comparing volumes across segments need accurate length comparisons along a common baseline, which favors bars. Funnel charts work better when the message is about flow and proportion rather than small differences between individual figures.
Reporting goals shape the decision as well. A recurring dashboard benefits from consistency, so choose the chart that matches the metric’s definition. A one-time presentation can prioritize narrative clarity, where a funnel that mirrors the customer journey may communicate faster than a set of bars. Consider how many categories the reader must hold in mind: more than a handful of stages becomes difficult to track in a funnel, while bars accommodate a longer list.
Finally, weigh the space available and the labels required. Funnels need room for stage names and conversion percentages, while bars scale well in compact panels. Document the reasoning behind each choice so future analysts can follow the same criteria and keep reporting coherent across teams.
Frequently Asked Questions
What is a funnel chart best used for?
A funnel chart is built for sequences where each stage represents a defined milestone in a process, and the width of each segment shows how many people reached that point. It is a natural fit for customer journeys, lead generation pipelines, onboarding sequences, and application workflows that have a defined start, end, and known order of stages.
How do you calculate drop-off between funnel stages?
To calculate the percentage leak between two consecutive funnel stages, take the difference in count between stage N and stage N+1, divide by the count at stage N, and multiply by 100. For example, if 1,000 users start a checkout flow and 800 reach the payment step, the leak from step one to step two is 20 percent.
What is the main difference between a funnel chart and a bar chart?
In a funnel chart, stages are nested beneath one another in a fixed sequence and cannot be shuffled without breaking the logic of the display. In a bar chart, each bar stands alone as an independent category, so bars can be reordered, sorted, grouped, or compared side by side without any loss of sense.
When should I use a bar chart instead of a funnel chart?
Use a bar chart when the metrics stand on their own across categories or time periods that share no ordered relationship, or when reordering the categories would not change the story. The article also cautions that too many bars can clutter the chart and that the scale should start at zero to avoid misleading representations.
What are common problems with using a funnel chart?
A common trap is treating non-linear journeys as linear, even though real user behavior often moves backward, loops through stages, or converges on a shared step from multiple entry points. Skippable steps can also cause a stage’s count to legitimately exceed the stage above it, leading renderers to drop that value, reverse the ordering, or distort widths.
What is the difference between grouped and stacked bar charts?
Grouped bar layouts place bars side by side for each category, allowing readers to compare values both within a category and across categories. Stacked bar layouts place bars on top of one another, showing both the total for each category and the contribution of each component, while a 100 percent stacked variant focuses on relative shares.
Tony Astor
Tony writes about data visualization and the tools people use to build charts and dashboards. More about Data Illustrator