Funnel Chart: Visualizing Conversion Stages
 By Tony Astor ·
Funnel Chart
A funnel chart visualizes a buyer’s journey from first contact to purchase, plotting how many users reach each stage so the narrowing population reveals where volume is lost. Each stage maps to a concrete action—landing, sign-up, add-to-cart, transaction—and steep drop-offs between stages identify friction points for testing and optimization.
Table of Contents
Funnel Chart
A funnel chart visualizes the journey a buyer takes from first contact with a product or brand through to the final purchase decision. Each stage of the funnel represents a distinct point in that journey, such as visiting a landing page, signing up for a trial, adding an item to a cart, and completing a transaction. By plotting the number of users who reach each stage, the chart reveals how the population of potential buyers narrows as they move deeper into the conversion process. This narrowing shape gives the funnel its name and provides an immediate picture of where volume is lost along the way.
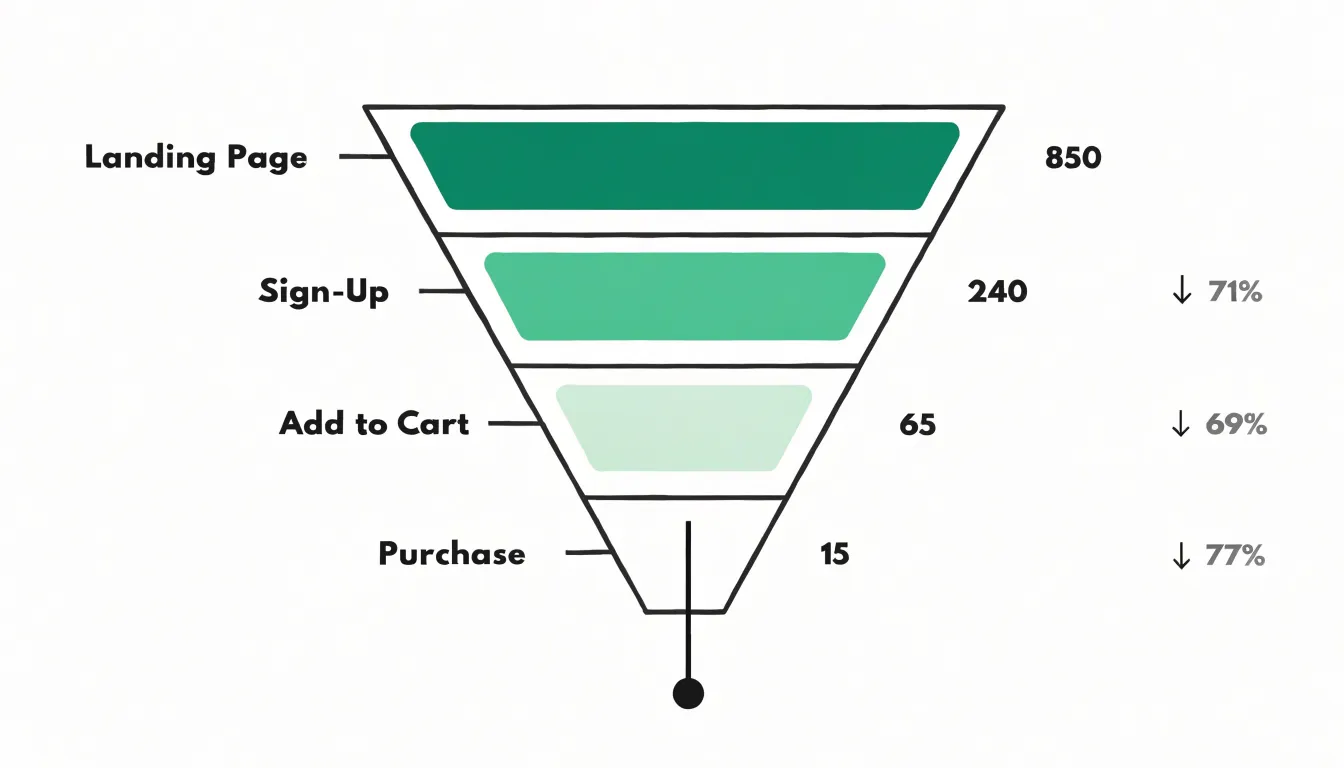
The real value of tracking buyer movement across these distinct stages lies in what it reveals about user intent. The proportion of visitors who advance from one stage to the next signals how strongly the audience wants to proceed. A large drop between browsing and adding to cart suggests hesitation or friction at that specific point, while steady retention indicates that messaging and experience align with expectations. Viewing the stages in sequence shows progression toward a purchase as a measurable flow rather than a single event, making it possible to see momentum build or stall at each step.
Funnel charts also help teams prioritize improvements by directing attention to the stages with the steepest drop-off. When a particular transition loses most of the audience, that stage becomes the natural focus for testing changes to copy, layout, pricing, or incentives. Tracking the same funnel over time shows whether those changes shift the shape of the chart in the intended direction. Segmentation adds another layer: different audiences may display different patterns of progression, revealing which groups move quickly toward purchase and which need additional support to advance.
Conversion Stages
Mapping conversion stages begins with defining the key milestones along the customer journey. The typical arc runs from awareness through interest, consideration, intent, and finally purchase, though the exact labels should match how your business actually operates. The important work is assigning a concrete, observable action to each stage so that every user can be placed somewhere in the funnel with confidence:
- Awareness: The first meaningful contact, such as when a user lands on a blog post, sees a social ad, or arrives through organic search.
- Interest: Exploration beyond a single page, like reading a product comparison or watching a demonstration video.
- Consideration: Actions that signal genuine commercial intent, such as downloading a buyer’s guide, requesting a quote, or adding an item to a wishlist.
- Intent: The point of near-commitment, visible in actions like starting a checkout, scheduling a call, or beginning a trial.
- Purchase: The terminal action, whether that means completing a transaction, signing a contract, or activating a subscription.
Each milestone holds distinct diagnostic value. A steep drop between awareness and interest often points to messaging that fails to resonate with the attracted traffic, while a collapse between consideration and intent suggests friction in pricing, trust signals, or the checkout experience itself. Defining stages through specific user actions transforms a vague sense of where customers are into measurable checkpoints.
Drop Off Analysis
Drop-off analysis begins with establishing a clear baseline for each stage, since raw conversion numbers only become meaningful when compared against expected performance. Tracking stage-to-stage conversion ratios across time periods, traffic sources, and customer segments makes bottlenecks visible. A drop from 60 percent to 25 percent between two consecutive stages signals a problem worth investigating, and segmenting the data often reveals that the decline concentrates within a particular audience, device type, or acquisition channel, narrowing the diagnostic field considerably.
Once a weak stage is identified, cohort analysis adds depth by following groups of users who entered the funnel at the same time and observing how their behavior diverges. Comparing a cohort with strong completion against one with weak completion can surface differences in messaging, pricing exposure, or page performance. Session recordings and heatmaps provide the qualitative layer, showing where visitors hesitate, scroll backward, or abandon forms mid-completion. Exit surveys and on-page feedback widgets capture stated reasons directly from users at the moment of departure, while server-side event logs reveal technical triggers such as slow load times, payment errors, or broken links that silently push people out.
A structured approach pairs quantitative signals with qualitative evidence:
- Rank stages by revenue impact.
- Rank drop-off severity within each stage, and investigate the intersection first.
- Establish exit-trigger categories such as price shock, trust concerns, form fatigue, and technical failure, and tag observed behavior against them.
- Repeat this analysis on a regular cadence to catch friction early and measure whether fixes actually move users forward.
Conversion Rate Calculations
Calculating conversion rates at each stage of a funnel begins with a simple formula: divide the number of people who advanced to the next phase by the number who entered the current phase, then multiply by one hundred to express the result as a percentage. If 4,000 visitors viewed a product page and 800 added that item to a cart, the stage-to-stage conversion rate is 20 percent. Analysts should define the entry and exit events for each phase with care, since inconsistent definitions produce rates that cannot be compared across time periods or segments.
Overall funnel performance combines these individual rates into a single view. Multiplying the stage-to-stage rates together yields the total conversion rate from first touch to final action. With rates of 20 percent, 25 percent, and 40 percent across three stages, the end-to-end conversion is 2 percent. This figure offers a baseline for judging campaigns, forecasting revenue, and setting targets. Dividing the number of final conversions by the number of initial entrants provides the same result more directly and serves as a useful cross-check.
Several supporting metrics add context:
- Drop-off rate: The complement of the conversion rate, highlighting the proportion lost at each step.
- Velocity: The average time prospects spend between phases, which matters when sales cycles are long.
- Statistical significance: A necessary check before acting on small changes, since modest sample sizes can produce misleading swings.
Funnel Chart Types
Funnel chart types divide largely into two structural families: the classic trapezoid layout and the segmented bar layout, and the difference between them shapes how pipeline data reads on the page.
In a traditional trapezoid chart, each stage appears as a horizontal band whose width tapers from top to bottom, with the widest band at the top representing the initial stage and narrower bands below representing subsequent stages. The sloping sides create a continuous visual surface that mimics the neck of a funnel, so the eye follows the descent from entry point to conversion. Because adjacent bands share angled boundaries, the chart emphasizes the overall flow of the pipeline and the cumulative narrowing across stages.
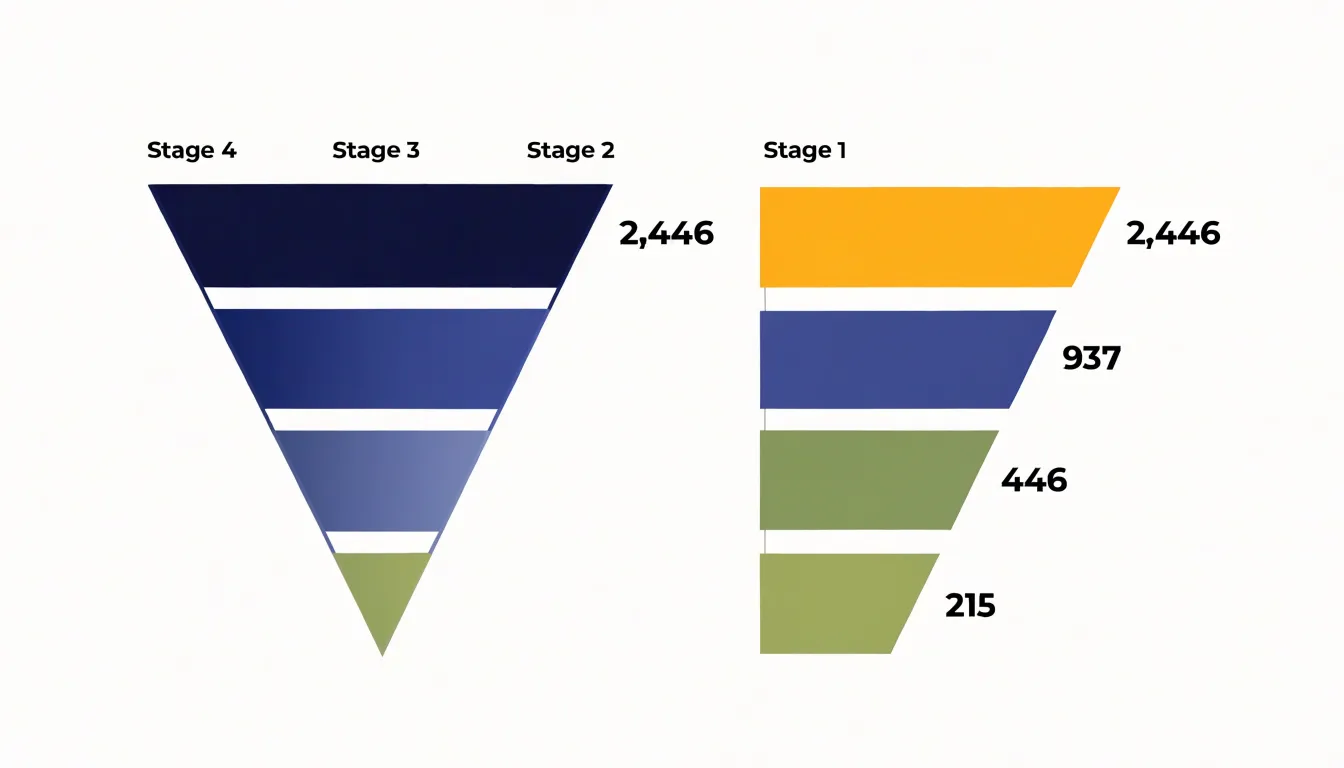
In a segmented bar layout, each stage becomes its own discrete horizontal bar, typically aligned along a shared vertical axis with a consistent left edge, and the length of each bar corresponds to the value or count at that stage. Gaps or thin separators distinguish each segment, making every stage a self-contained unit rather than part of a continuous surface. Readers can therefore compare bar lengths directly, gauge individual stage volumes against a common baseline, and measure the drop between stages with straightforward subtraction.
The structural distinction carries practical consequences. Trapezoid visuals communicate the sense of a whole passing through constriction, which suits executive summaries and presentations where the overall shape of the pipeline matters most. Segmented bars provide a cleaner basis for precise comparison and labeling, which suits analytical contexts where readers need to evaluate stage performance or conversion rates. Designers choosing between the two weigh how much the chart should convey flow versus how much it should support measurement.
Visual Design Principles
Effective funnel charts rely on deliberate visual design choices that guide the reader’s eye from the widest stage to the narrowest without confusion. Color contrast is the first consideration: each stage should be distinguishable from its neighbors, either through a graduated palette that darkens or lightens progressively or through clearly separated hues. This progression signals direction and magnitude at a glance. Contrast must also be maintained between the shapes and the background so the funnel stands out as the focal element rather than blending into surrounding page elements.
Proportion deserves equal attention. The width of each stage should correspond faithfully to the value it represents, since a funnel chart’s core purpose is to communicate relative volume. Distorting widths—whether for aesthetic balance or to make small stages visible—undermines the chart’s credibility. When a stage is so small that it becomes illegible, a minimum visual width paired with an explicit data label offers a more honest solution than arbitrary scaling.
Clear labeling ties the design together. Stage names belong either inside the shapes or immediately beside them, positioned consistently so the eye does not jump unpredictably. Values and conversion percentages should appear in a predictable location, and legends should be used sparingly, only when color carries essential meaning. Typography should remain legible against every fill color, which may require adjusting text color from dark to light as the palette shifts.
Restraint prevents visual clutter. Gridlines, borders, shadows, and decorative gradients add noise without adding information. Limiting the palette to a small set of purposeful colors, keeping labels concise, and removing nonessential elements allows the funnel’s shape and proportions to carry the message.
Common Funnel Mistakes
Even well-intentioned funnel charts are prone to visualization errors that distort the underlying data:
- Misaligned scale proportions: If the area or length of each segment does not accurately reflect the underlying values—such as representing drop-off with an inconsistent visual ratio—viewers may overestimate or underestimate the actual conversion rate.
- Missing stage data: Omitting a stage due to incomplete tracking or a desire to simplify breaks the logical flow and hides critical drop-off points. Every stage in the funnel should be present and clearly labeled, even if the value is zero.
- Misleading metric displays: Using cumulative totals instead of stage-specific counts, or displaying percentages without clarifying their baseline, confuses audiences. For instance, showing a 50% conversion from stage one to two and a 50% conversion from two to three might imply an overall 50% conversion, when the true end-to-end rate is 25%.
- Inconsistent labeling: Mixing absolute numbers with percentages without clear context leads to misinterpretation. Present all metrics with clear definitions and consistent formats.
Optimization Strategies
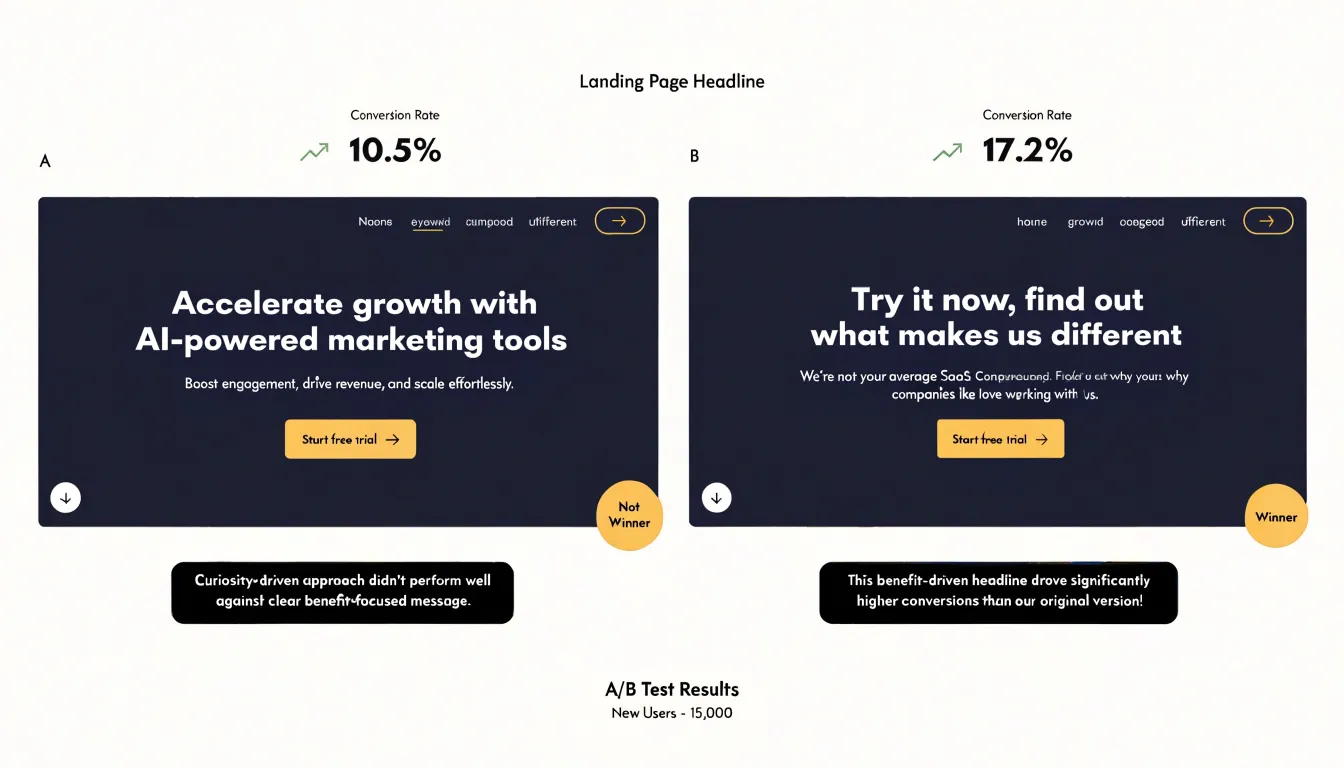
Optimization strategies for a funnel chart begin with the discipline of systematic testing, and headlines represent one of the highest-leverage places to start. A headline is the first substantive promise a visitor encounters, so small shifts in wording, specificity, or emotional tone can produce measurable changes in how many people continue to the next stage. Practitioners can test one variable at a time, such as a benefit-driven headline against a curiosity-driven one, or a version that names the audience explicitly against a broader statement. Running each variant long enough to reach statistical significance—and tracking drop-off rates at the specific funnel step rather than only aggregate conversion—keeps the results directly connected to the chart’s diagnostics.
Call-to-action (CTA) buttons deserve the same rigor. Test button copy that describes the outcome of clicking against copy that describes the action itself, and pair that with tests of placement, size, and color where the design system permits. Hold the page layout constant while swapping only the CTA element so any change in click-through can be attributed to the button rather than to surrounding content. Recording results by traffic source often reveals that a winning variant among organic visitors underperforms for paid traffic, which informs segmented rollouts.
Promotional offers form a third testing avenue. Trial variations in discount depth, bundle structure, urgency framing, or free-shipping thresholds, and evaluate each against margin impact as well as conversion lift. A higher conversion rate that erodes profitability is not a genuine optimization, so pair funnel metrics with revenue data. Sequencing tests across the funnel, rather than attempting every change at once, allows teams to isolate the interventions that most reduce drop-off and compound improvements stage by stage.
Marketing Funnel
Mapping content to audience awareness ensures visitors receive relevant material based on where they are in their buying journey. Consider how an essential oils brand might structure its marketing funnel:
- Top of the funnel (Awareness): Visitors are often curious but uninformed, searching for basic information about aromatherapy, wondering how to use a diffuser, or looking for natural ways to support relaxation. Content here should educate without selling: introductory blog posts explaining what essential oils are, beginner guides to safe dilution, and simple infographics covering common oils and their traditional uses. These materials build trust and give newcomers a reason to explore further.
- Middle of the funnel (Consideration): Awareness has grown and visitors are comparing options. Detailed educational content serves them well: downloadable starter kit checklists, recipes for blending oils for specific purposes, and comparison articles explaining the differences between single oils and blends. This stage is a natural place for email opt-ins—such as offering a free essential oil guide in exchange for contact information—to keep the conversation going while the prospect evaluates their needs.
- Bottom of the funnel (Conversion): Audiences are ready to act, so promotional materials take center stage. Product pages with clear pricing and usage instructions, customer testimonials and reviews, limited-time offers, and bundled starter sets reduce the friction of choosing. A well-placed CTA, such as a special discount for first-time buyers, can convert consideration into purchase.
Aligning each piece of content to the appropriate stage prevents premature selling and guides the audience smoothly from curiosity to buying decisions.
Sales Pipeline
A sales pipeline represents the sequence of stages a prospective customer moves through from initial contact to closed deal, such as prospecting, qualification, proposal, negotiation, and closing. Mapping this pipeline onto a funnel chart connects everyday sales activities with measurable milestones:
- Direct sales outreach (cold calls, emails, social selling) feeds the top of the funnel to generate awareness and capture initial interest.
- Lead nurturing activities (content marketing, email campaigns, follow-up calls) move prospects from the top to the middle stages by building trust and addressing concerns.
- Representative touchpoints (demos, meetings, check-ins) link to later stages, where the focus shifts to validating the solution and finalizing terms.
Explicitly linking these activities to chart stages shows sales teams how daily efforts translate into pipeline progression. For instance, a high volume of outreach might be necessary to generate enough qualified leads to move a target number of prospects into the proposal stage. Where the chart shows prospects dropping off, teams can investigate whether nurturing efforts are sufficient or touchpoints are effective. Managers can also use stage-to-stage conversion rates to predict revenue and allocate resources accordingly.
Customer Retention
The traditional funnel often stops at the first purchase, treating the sale as the finish line, yet for recurring-revenue businesses the first transaction is an opening signal rather than a conclusion. Extending the funnel model means adding explicit stages that capture whether a customer returns, renews, or reorders.
Subscription renewals offer one of the clearest retention signals. A monthly or annual renewal confirms that the value delivered matched the promise made at acquisition. Tracking renewal rates by cohort reveals whether retention holds steady across customer vintages or deteriorates over time, surfacing the renewal cycle as a predictable milestone for engagement.
Consumable product reorders—such as essential oils—function similarly. A customer who repurchases within an expected usage window demonstrates genuine product fit. Measuring the time between orders, the reorder frequency, and the percentage of first-time buyers who place a second order gives a practical read on retention health at the product level.
Customer lifetime value (LTV) ties these signals together. By combining average order value, purchase frequency, and expected retention duration, LTV quantifies what a retained customer is worth over time. This figure informs acquisition spending, since a higher LTV justifies greater investment in bringing in new buyers. It also highlights where retention improvements produce the largest gains, whether through reducing churn at renewal points or encouraging earlier reorders. Plotting these post-purchase metrics alongside traditional funnel stages shows where customers drop off after the initial sale and which interventions keep them moving forward.
Sample Kit Conversions
The sample kit conversion model tracks a specific post-purchase pathway: how many buyers of a low-cost essential oil sample kit later move into a full-sized product subscription. In this case study, the funnel tracks four sequential stages:
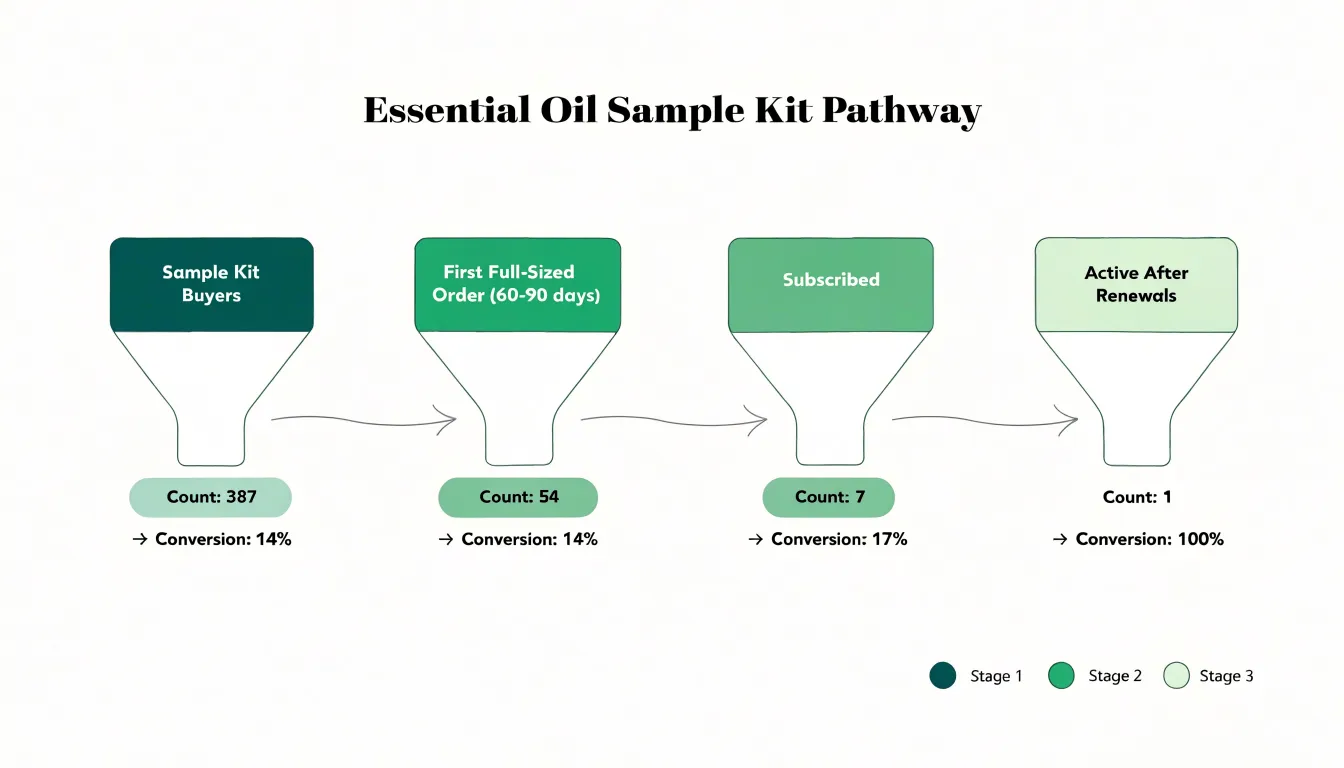
- Total number of sample kit buyers in a given period.
- Buyers who made at least one full-sized product purchase within a defined window (such as 60 or 90 days).
- Customers who enrolled in a subscription plan.
- Customers still actively subscribed after several renewal cycles.
Plotting these stages in sequence reveals where the largest losses occur and where to intervene. If the drop between kit purchase and first full-sized order is steep, the issue likely sits in onboarding or the follow-up communication accompanying the kit. If the drop appears between first purchase and subscription enrollment, the opportunity lies in incentives or messaging at the point of repurchase.
Segmenting this funnel by acquisition channel, kit type, or customer cohort allows teams to identify which combinations of marketing and product experience produce the strongest subscription uptake. The resulting chart gives marketing, product, and customer success teams a shared reference point to justify investment in follow-up sequences and measure conversion initiatives over time.
Software Tools
Selecting the right software for funnel chart creation begins with evaluating how a platform fits your existing workflow, data sources, and reporting cadence:
- Native connectors and automation: Teams relying on a specific data warehouse or CRM benefit from native integrations that eliminate manual exports and the delays or errors they introduce. Look for automated funnel generation that lets you define stages once and reuse the template across multiple campaigns or time periods.
- Real-time data sync: Some dashboards refresh on a scheduled interval, while others stream updates continuously. Live operations teams often need near-instant visibility into drop-off points, while monthly reporting cycles can tolerate batch updates. Check whether the platform documents its refresh latency clearly and allows different sync cadences for different data sources.
- Dashboard plugins: Look for plugins that handle stage conversion calculations, segment filtering, and comparison views without custom code. Confirm that plugins remain supported across platform updates so a version change does not break reporting.
- Pricing structure: Factor in seat counts, data volume limits, and any charges tied to real-time syncing before committing.
Running a short trial period with your own funnel data reveals more than a feature list and shows how the tool behaves under real team conditions.
Mobile Views
A funnel chart that reads comfortably on a desktop monitor—carrying stage names, values, conversion rates, and drop-off percentages—often compresses on a phone into unreadable labels, overlapping annotations, and stage bars so thin that the visual hierarchy collapses. Responsive funnel design treats the small screen as a distinct reading context, often glanced at briefly or held one-handed, with far less horizontal room for text and far more vertical scrolling available.
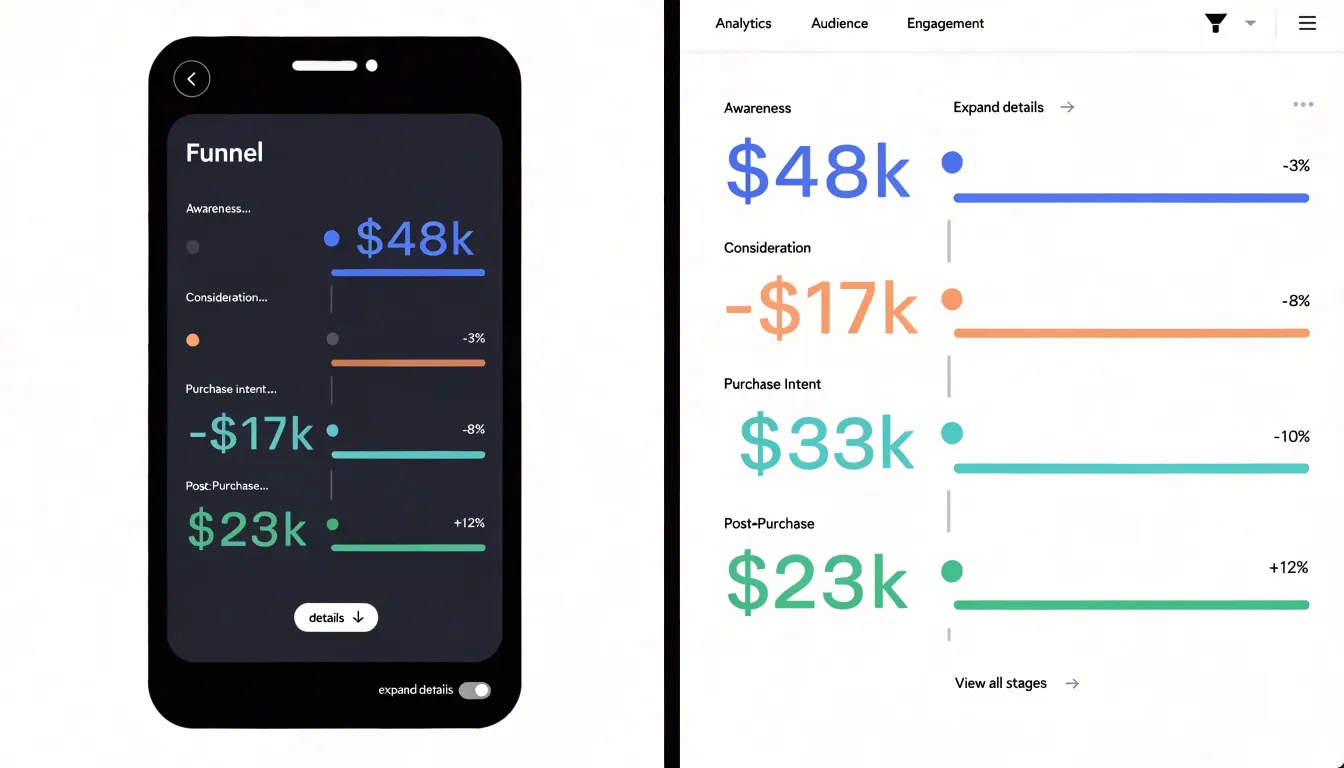
A practical approach is to reorient the funnel vertically and give each stage its own row rather than squeezing stages side by side. Each row can carry a stage label, a value, and a conversion rate without crowding. Labels should truncate gracefully, with full text available through tap or hover states where the platform allows. Drop-off metrics can move from inline callouts into secondary lines beneath each stage, keeping the primary value prominent, while color and shading retain the funnel’s proportional story across simplified horizontal tracks.
Complexity should be reduced progressively rather than removed outright. Hide secondary metrics, comparison series, and annotations behind an expandable detail panel or toggle so the default view stays clean while the full dataset remains one interaction away. Use generous spacing for touch targets and type sizes large enough to survive outdoor glare and quick scanning. Finally, test on actual devices across common screen widths to catch layout failures that desktop emulators miss.
Team Collaboration
Sharing conversion insights across a team turns a funnel chart from a static analysis into a tool for coordinated action. Start by tailoring exports to different stakeholders: a concise PDF with key metrics and trends suits executives, while a CSV export preserves raw data for analysts. Scheduling automated exports ensures everyone receives updated reports on time.
When setting up shared dashboards, centralize critical conversion metrics in one view and provide filters so team members can drill down by channel, campaign, or time period without altering the underlying data. Establish clear naming conventions, add annotations to highlight significant changes or experiments, and assign a dedicated dashboard owner to maintain data accuracy.
Aligning marketing and sales teams around these dashboards requires shared definitions and regular communication. Hold recurring review meetings where both teams examine drop-off points and handoff quality together: marketing can share insights on lead quality and campaign performance, while sales provides feedback on lead readiness and conversion barriers. Encouraging a culture where teams question and validate data collaboratively helps organizations spot opportunities quickly and improve the entire funnel.
Frequently Asked Questions
What is a funnel chart and what does it show?
A funnel chart visualizes the journey a buyer takes from first contact with a product or brand through to the final purchase decision. It plots the number of users who reach each stage, showing how the population of potential buyers narrows and where volume is lost along the way.
What are the typical conversion stages in a funnel?
The typical arc runs from awareness through interest, consideration, intent, and finally purchase, though the exact labels should match how your business operates. Each stage should be assigned a concrete, observable action so every user can be placed somewhere in the funnel.
How is a funnel stage conversion rate calculated?
Divide the number of people who advanced to the next phase by the number who entered the current phase, then multiply by one hundred. For example, if 4,000 visitors viewed a product page and 800 added that item to a cart, the stage-to-stage conversion rate is 20 percent.
What is the difference between a trapezoid funnel chart and a segmented bar funnel chart?
A traditional trapezoid chart uses horizontal bands that taper from top to bottom and emphasizes the overall flow and cumulative narrowing of the pipeline. A segmented bar layout uses discrete horizontal bars, making it easier to compare bar lengths directly and measure the drop between stages.
How do you analyze drop-off in a funnel chart?
Start by establishing a baseline for each stage and tracking stage-to-stage conversion ratios across time periods, traffic sources, and customer segments. Cohort analysis, session recordings, heatmaps, exit surveys, and server-side event logs can then help clarify where and why users drop off.
What mistakes should you avoid when making a funnel chart?
Avoid misaligned scale proportions, missing stage data, misleading metric displays, and inconsistent labeling. Every stage should be present and clearly labeled even if the value is zero, and metrics should use clear definitions and consistent formats.
Tony Astor
Tony writes about data visualization and the tools people use to build charts and dashboards. More about Data Illustrator