Euler Diagram: How It Differs From a Venn Diagram
 By Tony Astor ·

Euler Diagram
An Euler diagram shows only real, existing relationships between sets using closed curves: overlapping curves indicate shared members, nested curves indicate subsets, and separate curves indicate disjoint sets. Unlike Venn diagrams, it omits empty intersections, reducing clutter and keeping complex, multi-set figures legible for presentations and reports.
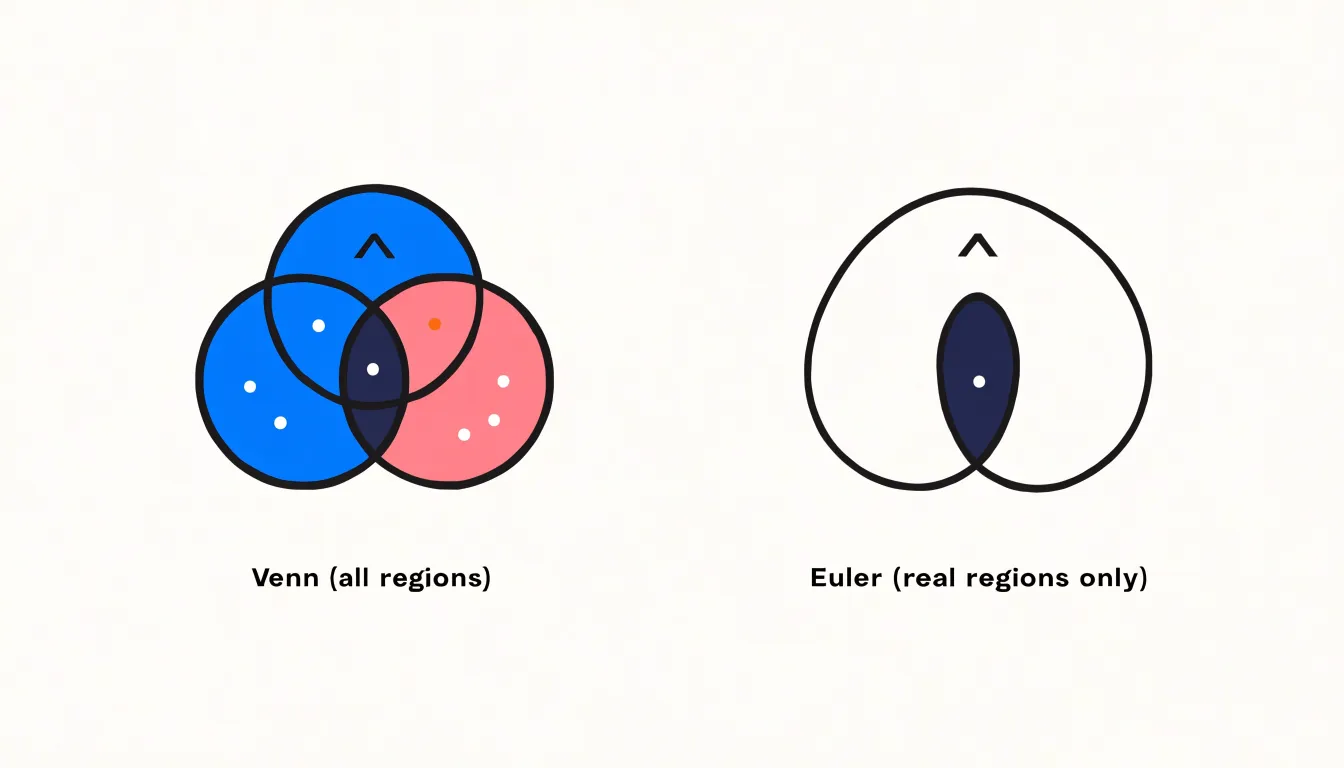
Table of Contents
Venn Diagram
A Venn diagram is a visual tool designed to display every possible relationship that can exist between a collection of sets. Its defining feature is that it represents all logically possible intersections, including combinations that may turn out to be empty. The shapes are drawn so that they overlap symmetrically, with each region corresponding to a distinct combination of set membership.
For two sets, the diagram shows the region belonging only to the first set, only to the second, to both at once, and to neither. For three sets, the number of regions grows to eight, and each region corresponds to one of the eight possible membership combinations: in all three sets, in exactly two of them, in exactly one, or in none at all. The layout is chosen so that every one of these combinations has a visible place on the page, regardless of whether any real item occupies it.
This completeness is what separates a Venn diagram from simpler illustrations of sets. A diagram might show two overlapping circles and shade the overlap to indicate shared members, but that alone does not guarantee that every combination has been accounted for. A true Venn diagram is constructed so that all combinations are represented, even the ones that hold no actual members. An empty region is still drawn, because the absence of members is itself a meaningful piece of information: it tells the reader that no item satisfies that particular combination of conditions.
Maintaining this completeness can become difficult as the number of sets increases, since the shapes must be arranged to produce every intersection while remaining symmetrical and readable. The empty regions are not oversights or wasted space; they are part of the diagram’s full picture of how the sets relate to one another.
Euler Diagram
Euler diagrams streamline visual data by displaying only real, active relationships between groups. Unlike Venn diagrams, which show all theoretically possible intersections, Euler diagrams focus exclusively on existing connections, eliminating clutter and unneeded intersections.
In an Euler diagram, each set is represented by a closed curve, and the overlaps between curves correspond precisely to the elements that the sets share. If two sets have no elements in common, their curves do not intersect. By omitting empty intersections, Euler diagrams reduce visual noise and draw the viewer’s attention only to meaningful connections.
This benefit is particularly evident when dealing with complex data involving multiple sets. In a Venn diagram, the number of regions grows exponentially with the number of sets, leading to a cluttered and often confusing figure. An Euler diagram only includes regions that correspond to actual combinations of elements. As a result, the diagram remains clean and legible, even when many sets are involved, making it ideal for presentations and reports.
Furthermore, Euler diagrams can be adapted to various shapes and layouts to best convey the relationships. The curves can be arranged to reflect the logical structure of the data, such as hierarchical or overlapping relationships, without the constraint of fixed intersection points.
Core Differences
Shading in Venn diagrams serves a precise logical function: it marks regions that contain no elements. Because all possible intersections of the sets are drawn, a shaded region explicitly asserts that the corresponding combination of properties is empty. For example, shading the region inside A but outside B states that no A is a B. This ability to represent emptiness is essential for expressing universal claims and exclusions, making Venn diagrams a complete method for categorical logic.
Euler diagrams operate under a different convention. Because they show only non-empty regions, the absence of a region carries no formal logical weight beyond showing that sets are disjoint. There is no mechanism for shading or otherwise marking empty regions, because empty combinations are not drawn at all. As a result, Euler diagrams cannot directly express statements like “no A is B” as a relation between overlapping sets, since the absence of overlap already conveys disjointness.
The functional impact of this difference is significant. Venn diagrams can represent both positive and negative information within a single unified framework, allowing them to encode full logical relations among sets. Euler diagrams, by contrast, are limited to positive information: they show what exists and how sets relate through overlap or containment, but they cannot assert that a particular combination is empty. The presence or absence of shaded regions thus determines whether a diagram can convey negative facts, and this shapes the kinds of statements each diagram type can effectively communicate.
Nested Sets
Nested sets offer one of the most intuitive ways to express hierarchy within an Euler diagram. When one category is wholly contained within another, the smaller circle is drawn entirely inside the larger one, so that every element of the inner set is also visibly an element of the outer set. The spatial relationship mirrors the logical relationship: containment on the page reflects containment in meaning. This makes Euler diagrams particularly well suited to hierarchical classifications, where categories break down into more specific subcategories without any ambiguity about membership.
Consider the example of pure lavender oil and botanical extracts. A broad circle labeled botanical extracts can enclose a smaller circle labeled pure lavender oil, signalling that every pure lavender oil sample belongs to the wider family of botanical extracts. The nested arrangement immediately communicates that the inner group inherits the properties of the outer group while adding its own distinguishing traits. Readers do not need to trace connecting lines or consult a legend; the visual containment does the explanatory work on its own.
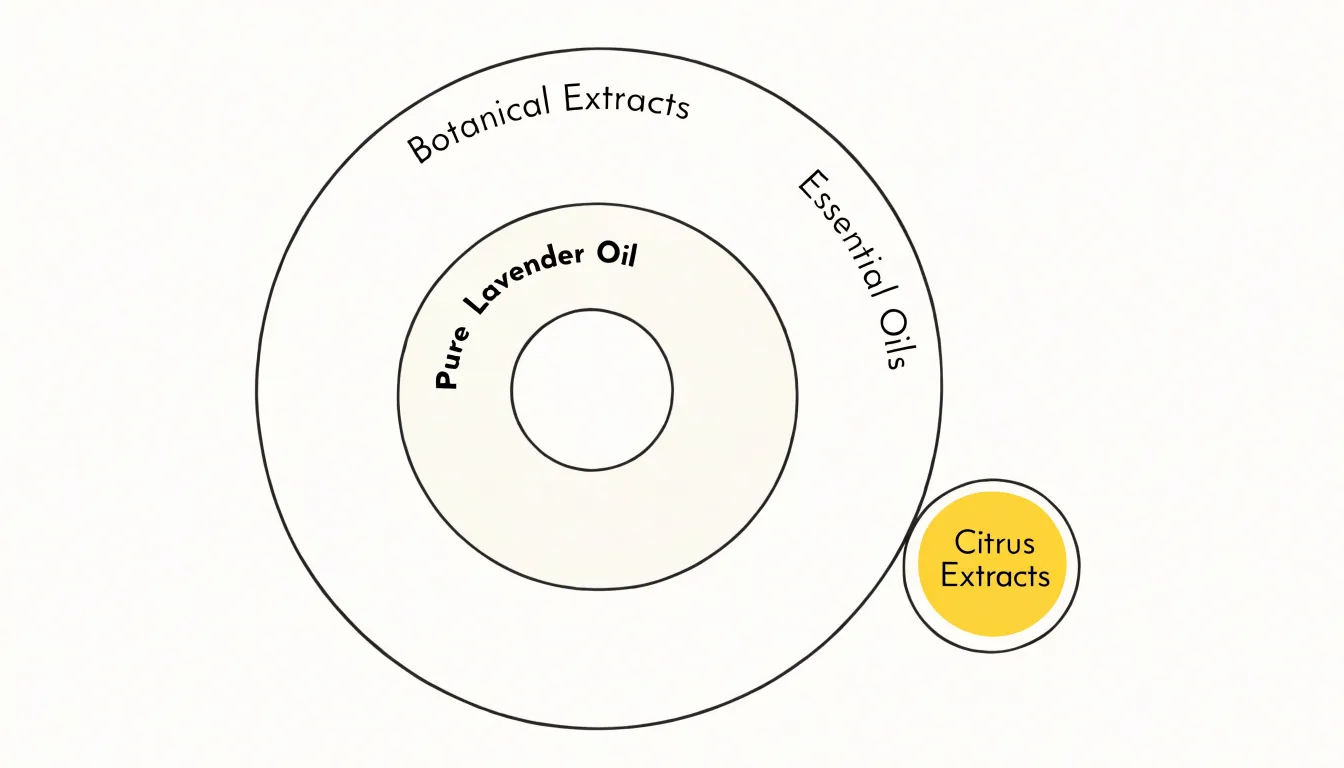
This nesting can extend through several levels. A circle for botanical extracts might contain a circle for essential oils, which in turn contains a circle for pure lavender oil, producing a clean visual ladder from general to specific. Each level stays fully inside its parent, so the diagram preserves the rule that subordinate categories are complete subsets of the categories above them.
The approach also supports comparison across branches. A separate circle for, say, citrus extracts can sit inside the botanical extracts circle alongside the essential oils group, showing two parallel subcategories that share a common parent without overlapping each other. This layout helps viewers see both the vertical hierarchy and the horizontal distinctions in a single view.
Nested sets therefore give Euler diagrams a natural grammar for taxonomy, letting classification schemes unfold visually in a way that matches how people intuitively reason about groups within groups.
Zero Overlap
When two sets share no elements at all, the Euler diagram presents them as fully separate circles with a clear gap between them. For oil profiles, this matters because some oils genuinely have nothing in common in terms of their defining characteristics, and the diagram should say so plainly rather than implying a relationship that does not exist. Keeping the circles apart makes the disjointness visible at a glance: a reader scanning the diagram sees two distinct shapes and immediately understands that these profiles belong to entirely different categories.
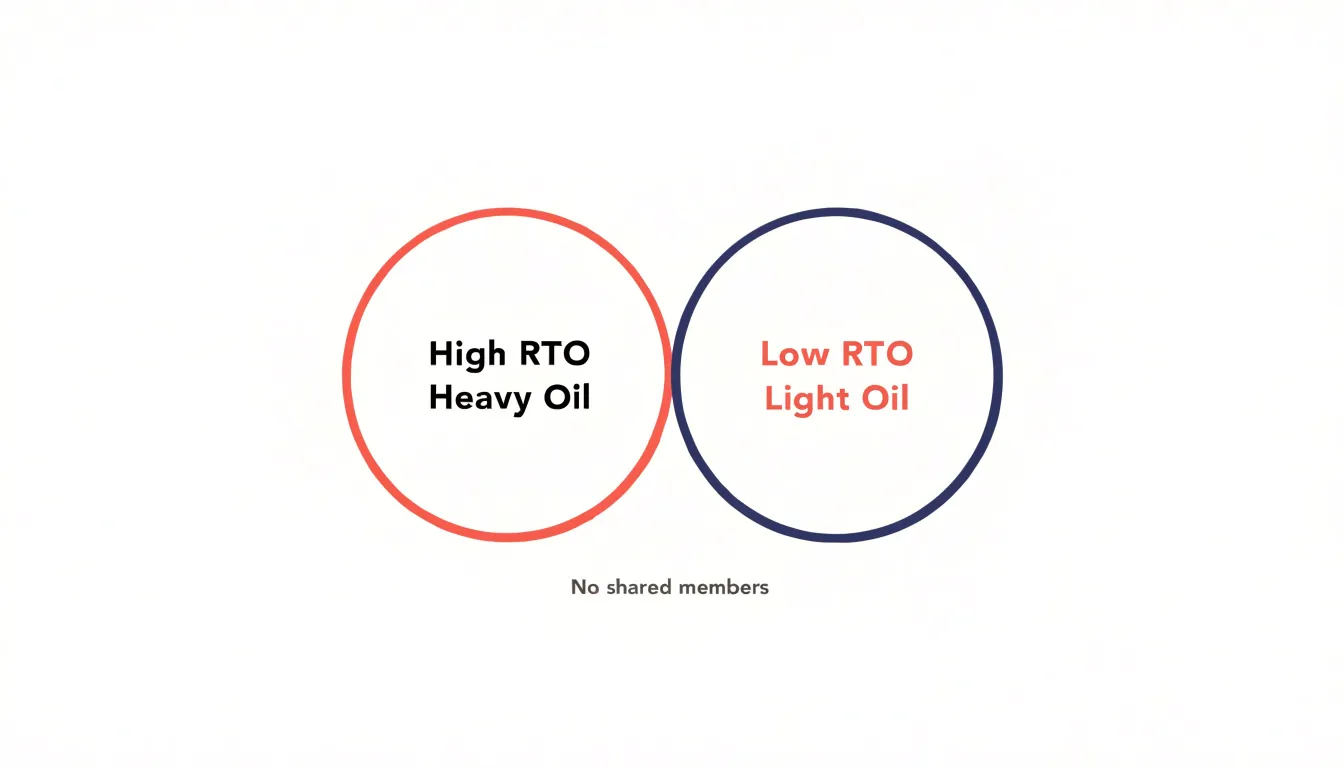
The alternative, forcing circles to touch or intersect, would introduce false information. An intersection implies shared members, and even a small overlap can suggest that some oils fall into both groups. Separate circles preserve the integrity of the data and keep the visual language honest. The gap between them is not empty decoration; it is a meaningful statement that the sets do not meet.
Clutter is another concern. Attempting to connect unrelated groups with lines, brackets, or other bridging devices adds visual noise without adding understanding. Each added element competes for attention and makes the diagram harder to parse. The cleaner approach leaves the separate circles as they are, letting whitespace do the work of separation. Labels can sit within each circle, and the eye moves easily from one group to the next without being drawn into spurious connections.
This treatment also scales well. As more disjoint profiles are added, they can be placed around the existing circles in a layout that keeps each one clearly bounded. The result stays readable even as the number of groups grows, because the principle is simple and consistent: no shared elements means no shared space.
Reading Diagrams
Reading Euler diagrams well begins with a calm, systematic scan of the figure before any interpretation takes place. Trace the outermost boundary first and note what it encloses. The outer contour establishes the universal set, the total space within which every other shape is situated. Once that frame is clear, work inward one enclosure at a time, asking of each region which circles contribute to it. A region inside two overlapping circles belongs to both sets simultaneously, while a region inside only one circle belongs to that set alone. The eye naturally jumps to the dense central areas of a diagram, so a disciplined pass from the perimeter inward prevents the overlapping zones from being misread as standalone categories.
When reading nested circles, remember that the visible empty ring between the inner and outer boundaries represents members of the outer set that fall outside the inner one. Practically, it helps to verbalize each relationship as a sentence: every A is a B, some C are D, no E is an F. Translating shapes into plain statements forces precision and exposes any reading that the geometry does not actually support.
In botanical and chemical contexts these distinctions carry real weight. A diagram may show shared chemical constituents across several species, with the intersection marking compounds that two or more plants have in common, while the nesting reflects taxonomic groupings such as a genus within a family. Overlap in chemistry does not imply shared classification, and shared classification does not guarantee identical chemistry. Keeping the two kinds of relationship separate in the reading guards against the common error of treating a chemical overlap as evidence of botanical kinship. Annotating the diagram with short labels and checking each region against the source data completes a reliable reading.
Common Mistakes
One of the most frequent errors people make when working with set diagrams is choosing the wrong format for the data they actually have. When someone draws a full Venn layout out of habit while thinking about real data, viewers naturally assume that every enclosed area represents an actual population. An empty region then reads as a genuine zero, suggesting that the overlap was measured and found to contain nothing, when in truth the overlap was never part of the dataset at all. This single confusion can distort conclusions about how two groups relate, because an absent category looks identical to an observed empty one.
The reverse mistake appears just as often. People sketch a compact Euler layout with loosely arranged circles, then present it to an audience trained to read Venn diagrams. The missing regions invite the audience to fill in the gaps themselves, assuming the diagram is merely incomplete or that the author forgot to draw certain intersections. Viewers may also misjudge the relative sizes of the shapes, treating a larger oval as evidence that one category outnumbers another, even though many hand-drawn Euler diagrams use size only to indicate containment rather than proportion.
Labels compound the problem. A region left unlabeled in a Venn diagram usually means no data was collected there, while an unlabeled region in an Euler diagram means the category simply does not arise. Without an explicit caption explaining which convention governs the picture, readers default to whatever format they learned first. The practical remedy is to state the convention directly beneath the figure and to verify that the chosen layout matches the underlying table of counts before publication.
Essential Oil Blends
Lavender is one of the most versatile oils in an aromatherapist’s collection, and its pairing relationships make it an ideal subject for an Euler diagram case study. A practitioner might begin by drawing a large circle for lavender, then overlapping circles for the floral, citrus, and herbaceous families. Because lavender blends harmoniously with members of all three groups, each intersection with the lavender circle is populated with concrete examples: rose and geranium in the floral overlap, bergamot and sweet orange in the citrus overlap, and rosemary and clary sage in the herbaceous overlap. The visual result communicates at a glance what a written list struggles to convey, namely that lavender sits at a busy crossroads of the aromatic palette.
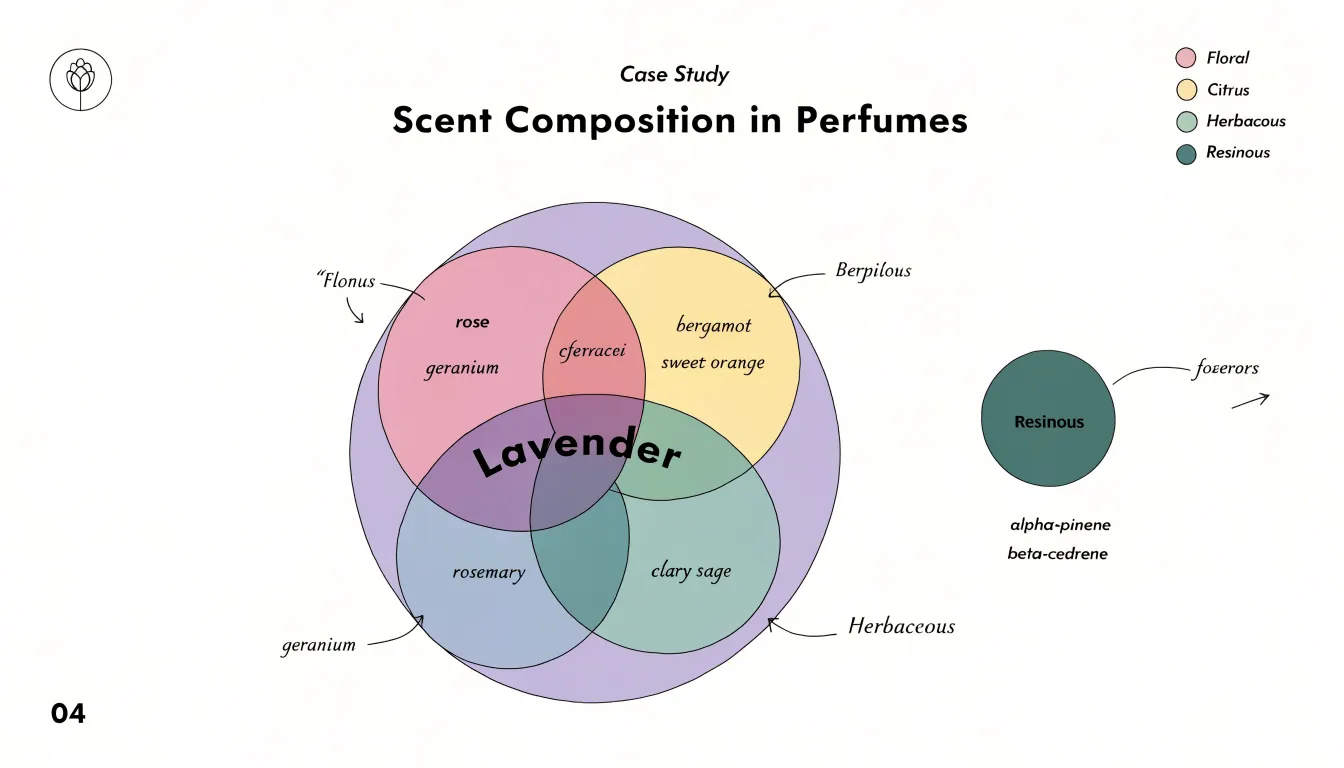
The real value of the Euler approach emerges when a blend does not exist. Suppose the practitioner wants to show that lavender pairs well with florals and citrus but rarely appears in the same classical blend as the heavier resinous oils. In a Venn diagram, the intersection with a resins circle would still be drawn and then left empty, inviting the reader to wonder whether the blank space means no blend exists, the data is missing, or the diagram is simply unfinished. An Euler diagram avoids this ambiguity by omitting the empty intersection altogether: the resins circle either sits apart from lavender or does not appear at all.
For a working case study, this clarity matters. A chart mapping lavender synergy across categories should read as a confident summary of established combinations rather than a grid of guesses. By letting the geometry follow the evidence, the diagram shows the floral, citrus, and herbaceous overlaps as full, inhabited zones and quietly leaves out the pairings that never took hold, giving the reader a trustworthy map of where lavender genuinely belongs.
Carrier Oils vs Extracts
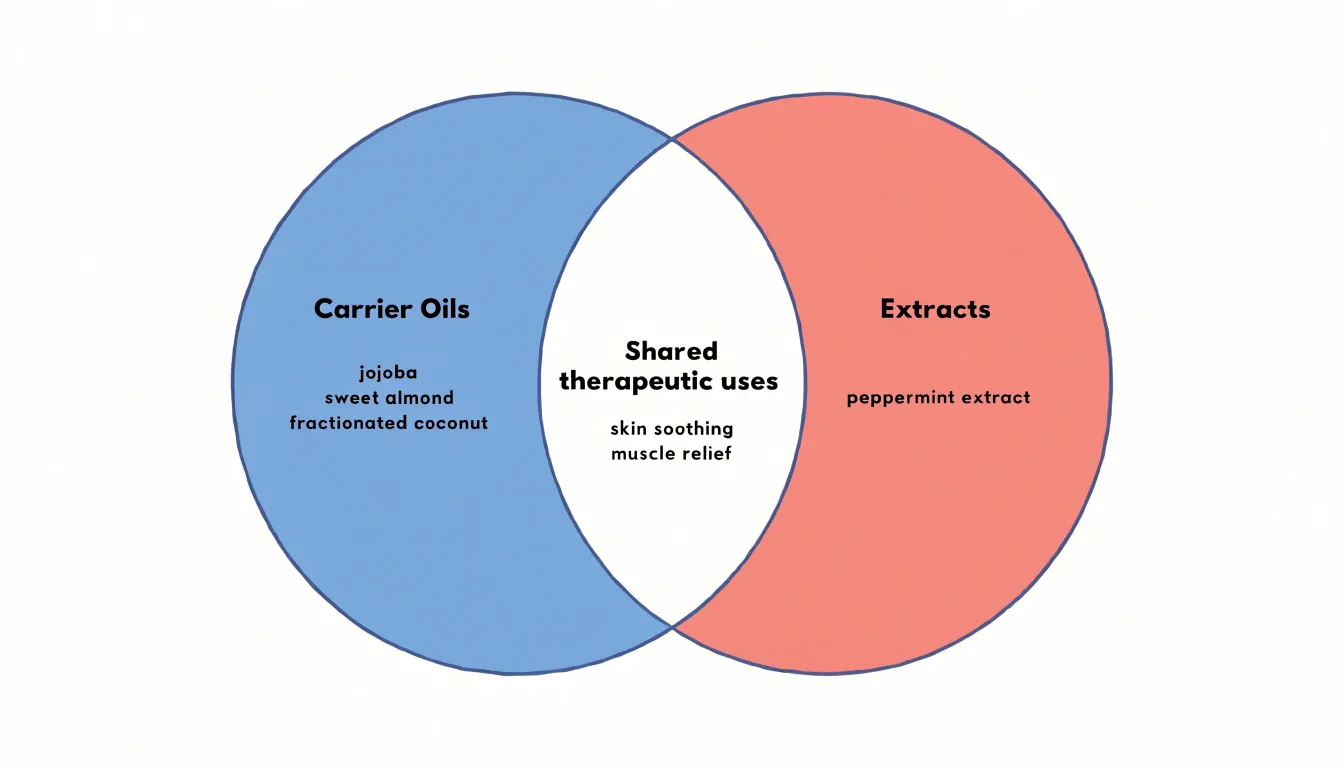
When you begin mapping carrier oils and plant extracts, the first thing that becomes clear is that these are two distinct product categories with different structures and functions. Carrier oils, such as jojoba, sweet almond, and fractionated coconut, are the base substances. They are typically cold-pressed from nuts, seeds, or fruit, and they serve as the medium in which other ingredients are diluted and delivered. Extracts, by contrast, are concentrated preparations made by drawing out specific compounds from plant material through methods like steam distillation, solvent extraction, or maceration. Peppermint extract, for example, is a potent concentration of menthol and other volatile components, and it behaves very differently from a base oil in both texture and strength.
Where this gets interesting is at the point of therapeutic overlap. Jojoba and peppermint can both appear in formulas aimed at soothing the skin or relieving tension, which means a simple topic-based diagram would place them in the same circle. Yet structurally they remain separate: one is a diluent and carrier, the other an active concentrate that usually requires dilution before use. An Euler diagram can capture this by giving each category its own circle, then showing a shared region where specific uses coincide.
The design challenge is to keep category structure visible while acknowledging overlap. Placing carrier oils in one circle and extracts in another, with an intersecting middle zone for shared therapeutic applications, preserves the distinction between base and concentrate. Individual products can then be plotted as points: jojoba sits firmly in the carrier circle, peppermint in the extract circle, and a shared-use label such as skin soothing or muscle relief appears in the overlapping region where both categories contribute. This approach keeps the taxonomy honest while still reflecting the practical reality that formulators routinely combine the two types of product to achieve a single therapeutic goal.
Aromatherapy Profiles
Aromatherapy profiles give blenders a structured way to think about how essential oils relate to one another before a single drop is combined. The most intuitive approach sorts oils along the arc of evaporation, beginning with top notes: the bright, volatile scents such as citrus, peppermint, and eucalyptus that rise quickly and fade within the first hour. Middle notes, sometimes called heart notes, form the stabilizing core of a blend and include florals like lavender and geranium alongside herbs such as rosemary and clary sage. Base notes anchor everything with the heavy, slow-evaporating resins, woods, and roots — sandalwood, patchouli, vetiver, frankincense — whose molecules linger for hours and hold the lighter notes in place.
Mapping these three layers as distinct visual sets immediately clarifies the architecture of a balanced blend. A blender can see at a glance whether a proposed formula lacks a middle to bridge the sharp top and the dense base, or whether the base notes are crowding out the opening.
Beyond the evaporation hierarchy, oils also cluster into fragrance families: citrus, floral, herbal, woody, resinous, spicy, and earthy. Sorting oils by family as overlapping visual regions reveals the shared territories where scent synergy is strongest. Lavender, for instance, sits at the intersection of floral and herbal, making it a natural connector between a rose accord and a rosemary one. Bergamot bridges citrus and floral, which is why it appears so often in classic blends. Visualizing overlap shows which oils can serve as bridges between sets rather than forcing abrupt transitions.
Organizing both dimensions — note position and fragrance family — lets formulators spot redundancies, identify gaps, and anticipate how a blend will evolve. What begins as an abstract set of scent descriptions becomes a working map of synergy, guiding both the first sketch of a formula and later refinement, while keeping the whole composition legible at a single glance.
Educational Uses
Euler diagrams offer a gentle entry point for students encountering set theory and formal logic for the first time. By showing containment, overlap, or separation directly, these spatial relationships let students see logical structure before they must reason about it abstractly, which lowers the initial cognitive load considerably.
Instructors can begin with concrete examples, such as the set of mammals nested within the set of animals, and ask students to interpret what the placement of the curves implies. From there, learners practice translating statements like all A are B or no A are B into diagrammatic form, connecting everyday language to formal claims. Because each region in the diagram corresponds to a definite combination of membership conditions, students can trace which regions must be empty and which must contain elements, building intuition for universal and existential statements.
Simplified Euler diagrams also support discussion of validity: an argument can be tested by checking whether the conclusion’s relationship is already forced by the premises as drawn. This hands-on approach keeps beginners focused on the core ideas of inclusion and exclusion, giving them confidence with the basic vocabulary of sets before they encounter the more intricate conventions and shading techniques of Venn diagrams.
Business Applications
In the retail and wholesale essential oil trade, product catalogs often grow quickly into sprawling lists of single oils, blends, and carrier products, and customers can struggle to understand how these items relate to one another. Streamlined diagrams offer a practical way to bring order to this complexity. By mapping a product line as a set of overlapping circles, a business can show at a glance which oils share botanical families, which blends draw from the same base ingredients, and where categories such as citrus, floral, woody, and resinous intersect. A lavender oil, for example, might sit at the center of several overlapping interests: its membership in the mint family, its use in calming blends, and its role in skincare preparations. Placing these relationships in a compact visual format lets buyers see the logic behind the catalog rather than memorizing isolated product names.
The same approach helps present inventory categories clearly. Retailers can group products by intended use, extraction method, or sourcing region, then display those groupings as simple nested or intersecting shapes. A customer browsing in person or online can trace a path from a broad category down to a specific bottle without wading through dense tables. Shared botanical traits become visible connections rather than hidden trivia. Staff can point to a diagram to explain why certain oils pair well together or why a particular blend belongs in more than one section of the shop.
For the business itself, these diagrams serve as internal planning tools. They clarify which products overlap in function, helping managers trim redundant stock, plan seasonal promotions, and train new employees. The visual simplicity keeps the information accessible, encouraging customers to explore adjacent products with confidence and giving the brand a reputation for clear, thoughtful presentation.
Customization Tips
Color coding works best when it carries meaning rather than decoration. Assign a distinct hue to each major category in your diagram and reuse that same hue consistently across related figures, so readers learn the association once and apply it everywhere. Limit yourself to a small palette, since more than about five or six colors becomes hard to distinguish, especially for readers with color vision deficiencies. Pair color with a second visual cue, such as a pattern, border style, or icon, so the information survives grayscale printing or photocopying. Ensure sufficient contrast between fills and text, and keep background tones muted so the labeled regions stand out.
Clear labels are the backbone of an understandable diagram. Place each label inside or immediately beside the region it describes; never rely on a distant legend when a direct label will do. Use plain language and consistent terminology, and keep label text horizontal where possible so readers do not have to tilt the page. Size text for legibility in its final medium: a diagram destined for a printed guide needs larger type than one viewed on a high-resolution screen. Where space is tight, use short labels and add a brief caption beneath the figure to explain relationships.
Proportional sizing turns an Euler diagram from a sketch into a truthful visualization. If a circle represents a set, its area should reflect the size of that set, which means adjusting radius by the square root of the value rather than the value itself. Overlap regions deserve the same care, since exaggerated or shrunken intersections distort the message. Keep circles large enough that small sets remain visible, and add numeric annotations when exact values matter. Test the finished diagram at its intended size and on both screen and paper, checking that colors, labels, and proportions remain readable in every context.
Decision Guide
Choosing between an Euler diagram and a Venn diagram comes down to whether your project demands mathematical completeness or a practical representation of real-world relationships.
A Venn diagram is the right tool when completeness itself carries meaning, such as teaching set theory, demonstrating formal logic, or proving that certain overlaps are empty by design. If your data describes actual entities with real memberships, an Euler diagram offers a more faithful picture, whether you are mapping product features to customer segments, showing shared responsibilities across teams, or illustrating biological classifications.
A practical framework follows three questions:
- Does the absence of an overlap need to be visible as an empty region? If yes, lean toward Venn.
- Are your sets defined by actual membership counts rather than hypothetical combinations? If yes, lean toward Euler.
- Will your audience benefit more from formal completeness or from immediate readability? Weigh those answers together, and the appropriate diagram type usually becomes clear.
Overview
A simple composition of overlapping curves can convey membership, exclusion, and partial overlap at a glance, which suits audiences who need orientation rather than exhaustive detail. When the number of sets grows, or when the relationships involve hierarchy, magnitude, or sequence, the viewer benefits from diagrams that layer additional information onto the basic set logic.
Choose the simplest diagram that preserves the distinctions the audience must recognize. If the key message is shared membership, overlapping curves will do. If the message involves relative size, nesting, or flow between categories, a richer structure earns its complexity.
The diagram type should follow the question the reader is asking, and the layout should reduce the mental effort needed to answer it. Consistent labeling, restrained color, and deliberate spacing carry as much weight as the choice of diagram itself. Before finalizing a design, apply a short checklist:
- Identify the relationship being shown.
- Confirm the diagram makes that relationship visible.
- Verify that a newcomer can interpret the result without explanation.
Frequently Asked Questions
What is the difference between an Euler diagram and a Venn diagram?
A Venn diagram shows every logically possible intersection between sets, including combinations that may be empty, while an Euler diagram shows only real, active relationships and omits empty intersections. This makes Euler diagrams less cluttered when representing actual data.
Why does an Euler diagram not show empty intersections?
Euler diagrams focus exclusively on existing connections and eliminate clutter by not drawing empty combinations. Because they show only non-empty regions, the absence of an overlap already conveys that sets are disjoint.
How do you show two sets that have nothing in common in an Euler diagram?
Show them as fully separate circles with a clear gap between them. Keeping the circles apart makes the disjointness visible, and forcing them to touch or intersect would falsely imply shared members.
How are nested sets drawn in an Euler diagram?
When one category is wholly contained within another, the smaller circle is drawn entirely inside the larger one. For example, a circle for pure lavender oil can sit inside a broader circle for botanical extracts to show that every pure lavender oil sample belongs to the wider family.
What is a common mistake when using a Venn or Euler diagram?
A common mistake is using a full Venn layout out of habit for real data, which can make an empty region look like a measured zero; the reverse mistake is presenting a compact Euler layout to viewers trained to read Venn diagrams. The article recommends stating the convention beneath the figure and verifying the layout matches the underlying counts.
How can an Euler diagram map carrier oils and plant extracts?
Give carrier oils one circle and extracts another, with an intersecting middle zone for shared therapeutic applications. The article notes that extracts, such as peppermint extract, are active concentrates that usually require dilution before use, while carrier oils are base substances such as jojoba and sweet almond.
Tony Astor
Tony writes about data visualization and the tools people use to build charts and dashboards. More about Data Illustrator