Dumbbell Chart vs Bar Chart: Showing Gaps and Change
 By Tony Astor ·

Dumbbell Chart vs Bar Chart
A dumbbell chart shows two values per category as dots connected by a line, making the gap or change between them the dominant visual feature. A bar chart shows one value per category with length from a zero baseline. Use dumbbells for paired comparisons like before-and-after; bars for single-value rankings.
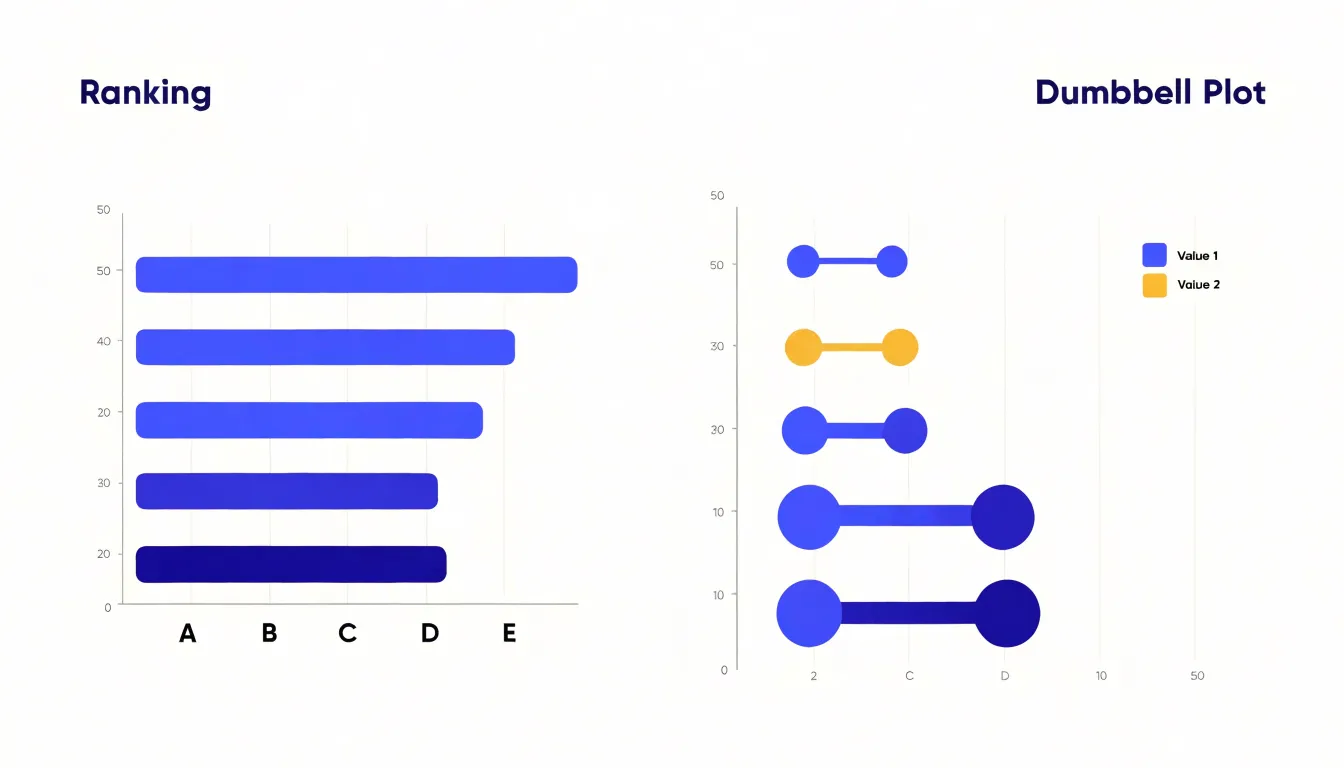
Table of Contents
Bar Chart
Bar charts compare single values across categories, making them a dependable choice for evaluating standalone metrics side by side. Each bar represents one category and one quantity, so its length maps directly to the measured value. A viewer scans the bars, compares their lengths, and immediately sees which categories are large, which are small, and how wide the gaps between them are. For discrete categorical metrics—such as revenue by region, headcount by department, or survey responses by option—a bar chart delivers the comparison without requiring interpretation of a second variable.
Bar charts also work well for ranking. Sorting bars from longest to shortest produces a clean ordered view, letting readers spot top performers and laggards at a glance. This makes them useful for leaderboards, priority lists, and any context where relative order matters as much as the values themselves. A horizontal orientation helps when category labels are long, since text can sit beside each bar without crowding.
With a single series of bars, there is no ambiguity about what is being compared. Gridlines and axis labels support accurate reading, while consistent bar widths and spacing keep the visual rhythm predictable. Color can highlight specific categories sparingly without distracting from the overall comparison. The format also accommodates annotations well, such as value labels at the end of each bar or a reference line marking a target threshold.
Dumbbell Chart
A dumbbell chart is built around two points connected by a line. Each row carries a pair of values—one plotted at the start of the line and one at the end—giving the eye a continuous segment to follow. This construction makes distance the dominant visual feature: the connector’s length conveys the magnitude of change, while the two endpoints show each state in absolute terms.
This emphasis on distance matters when the story is about the gap itself. Whether comparing a baseline measurement to a follow-up, a category’s performance across two years, or a group’s value against a benchmark, the connector encodes the difference directly instead of leaving the reader to subtract mentally. Rows with wide spans stand out immediately, drawing attention to the largest shifts.
Directional shifts are equally clear. Because each row has distinct endpoints, reversing the order of the two conditions creates an obvious visual cue: movement runs toward lower values or higher ones, and readers can scan down a column to spot where the pattern flips. This suits paired data where the sign of the change carries meaning, such as gains versus losses or movement above and below a target.
Variance across categories also emerges naturally. Rows with uniformly short connectors signal stability, while wildly different spans reveal inconsistency, showing the spread of differences across the whole figure.
Bar Chart Anatomy
A standard bar chart anchors every bar to a common, zero-aligned baseline. Because all lengths are measured from this shared origin, readers can compare categories by scanning bar lengths rather than reading individual numbers.
The categorical axis—typically horizontal in a vertical bar chart—lists the groups being compared. Each category occupies one uniformly spaced slot so that no group appears visually more important than another. Concise labels, rotated or abbreviated when names are long, keep the chart compact and readable.
Uniform bar width and even gaps between bars create a steady rhythm from one category to the next. When every bar has the same thickness, only height varies, keeping attention on the value comparisons. Axis titles clarify what the categories and values represent, while gridlines or tick marks provide reference levels for estimating intermediate values.
Dumbbell Chart Anatomy
A dumbbell chart uses three structural elements to show change between two states:
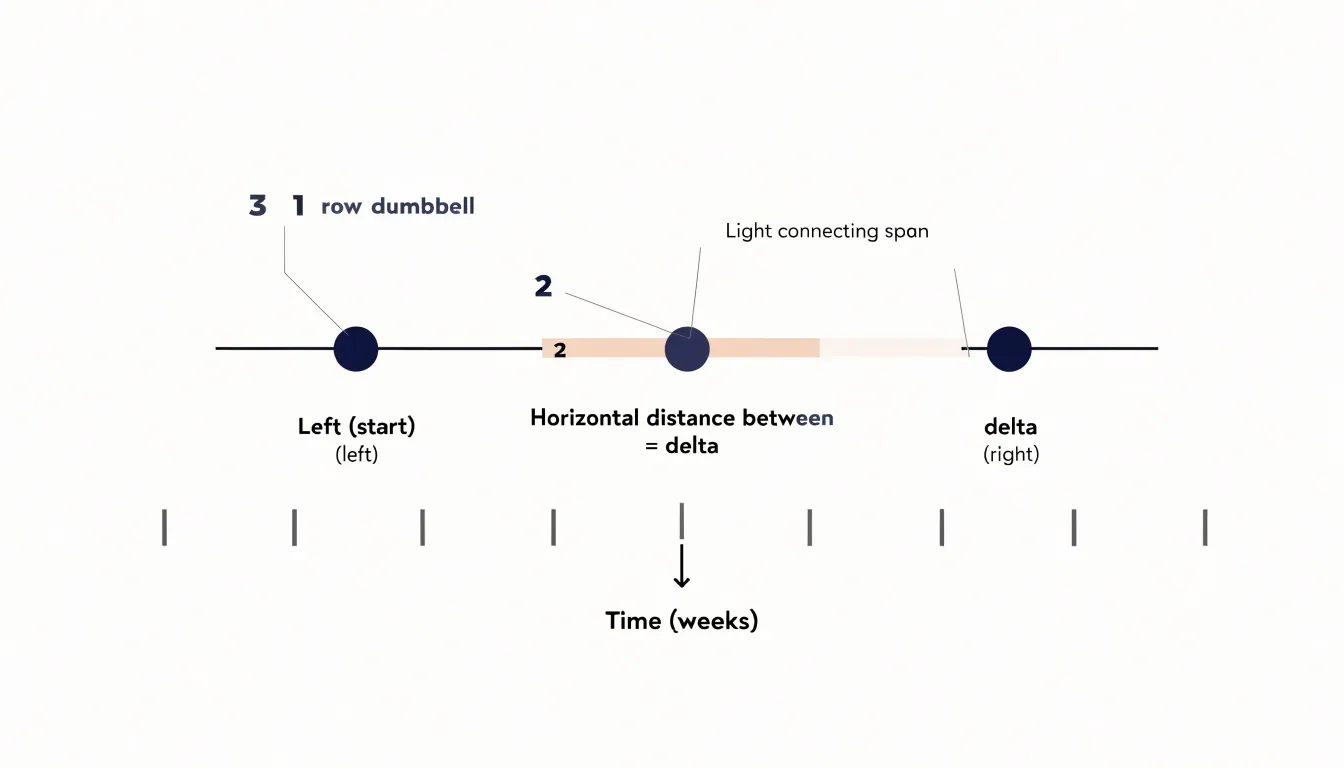
- Data markers: A pair of circles or dots anchors each observation, with one marker for the starting value and the other for the ending value. Because their position along the continuous axis carries the measurement, readers can compare absolute magnitudes by scanning down the start or end markers.
- Connecting line: The span line turns two isolated points into a single visual unit, making the pairing obvious even across many rows and directing the eye along the direction of change.
- Delta distance: The visual gap between the two markers encodes the magnitude of change. Readers can compare spans across rows to see which categories shifted the most and which stayed stable, using axis gridlines and labels to translate the visual gap into a numeric difference.
Clear labeling of the endpoints and a visible axis complete the structure.
Gap and Change
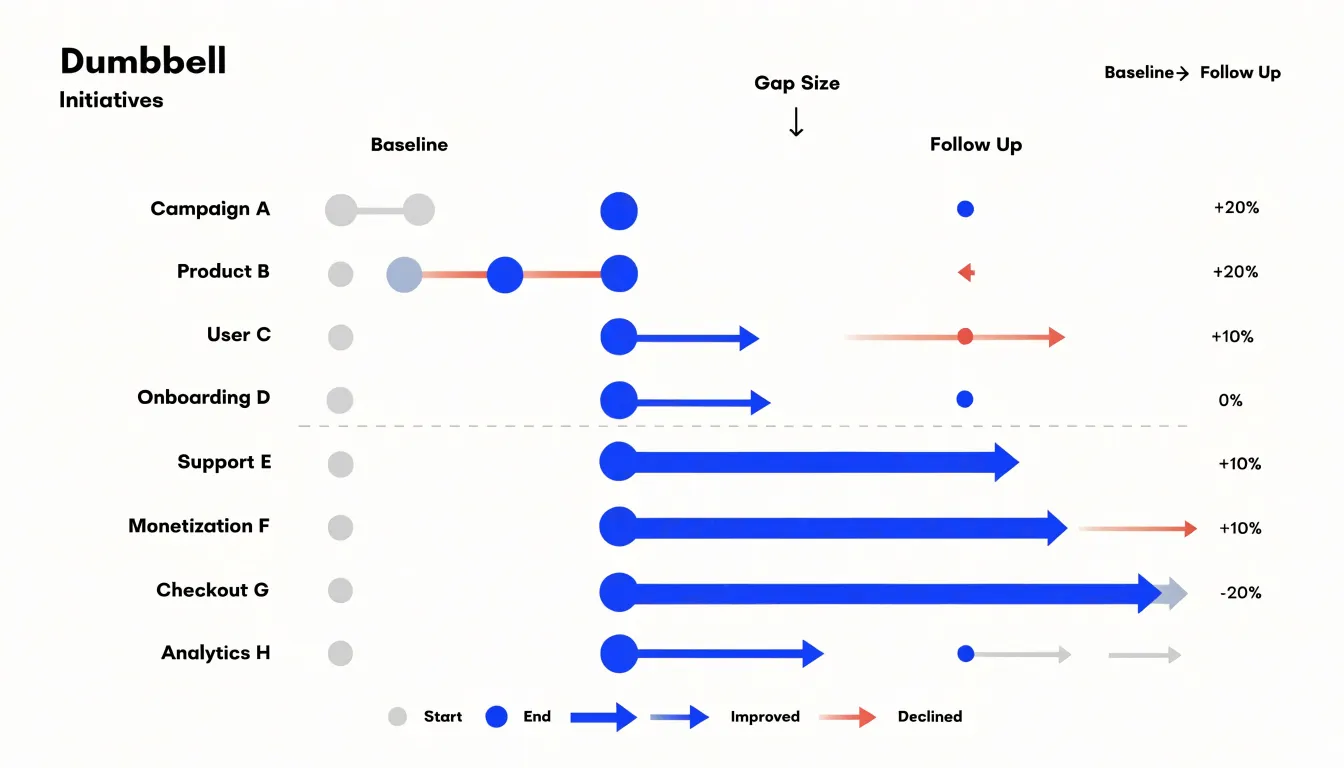
Tracking metrics before and after an intervention requires keeping both states visible at once. Dumbbell charts do this by placing baseline and follow-up markers on a single row, letting readers rank categories by improvement or deterioration almost instantly.
A bar chart can also represent before-and-after data, typically through grouped bars placed side by side, or a single bar showing the current value with an annotation for the prior one. Grouped bars preserve exact magnitudes clearly, which helps when absolute levels matter more than the movement between them. However, comparing adjacent bars requires the eye to jump back and forth, which becomes tiring across many categories. The gap between the two states remains implicit rather than being drawn directly.
By making that gap explicit, the dumbbell layout handles increases and decreases with the same visual device, showing mixed results across a portfolio of initiatives in one coherent view for performance dashboards and program evaluations.
Multiple Categories
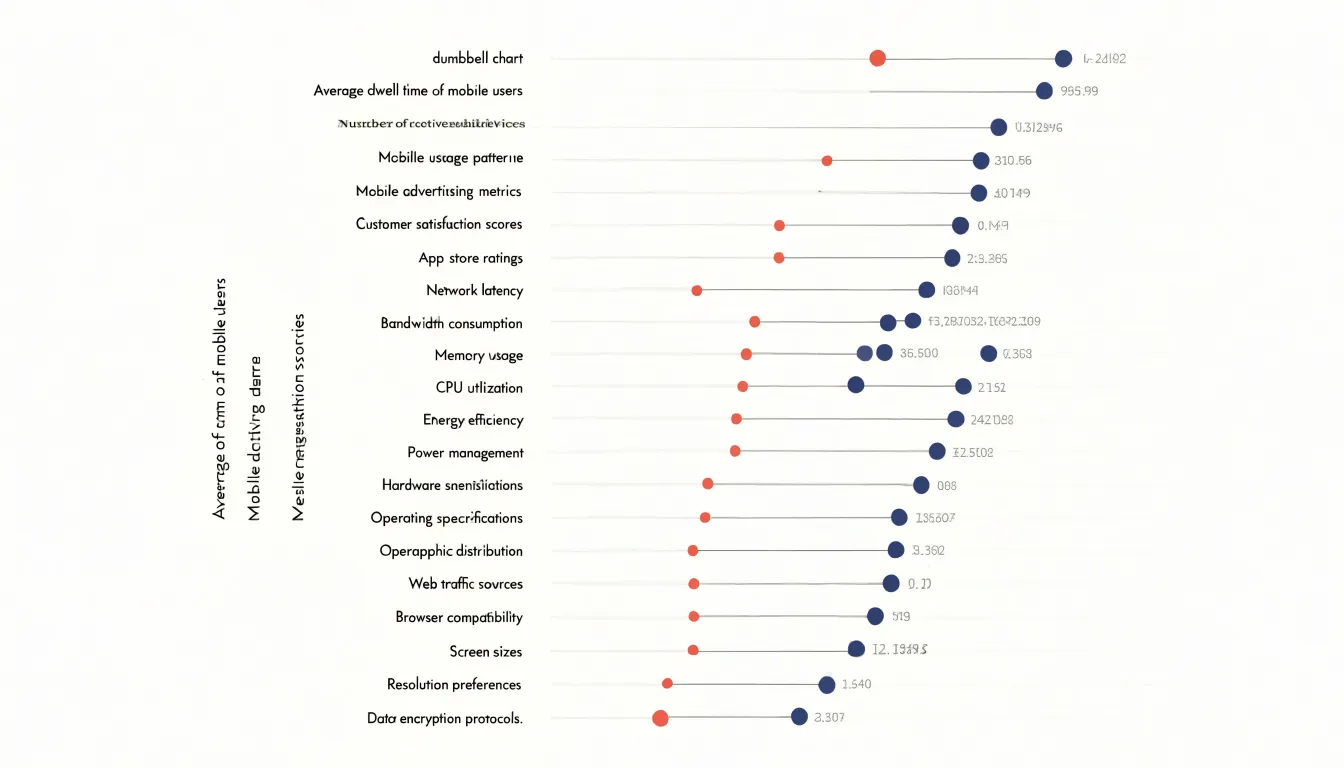
When a comparison involves many categories and multiple series, grouped bar charts quickly become crowded. With three, four, or five series spread across a dozen categories, the chart turns into a dense thicket of parallel rectangles where subtle differences are hard to perceive, forcing readers to repeatedly check the legend to track which bar belongs to which series.
Dumbbell charts organize high-density category lists more cleanly by assigning one horizontal row per category. For lists of twenty or more categories, long names fit comfortably along the vertical axis, and rows can be sorted by gap size or endpoint position. Reserving color for the two endpoints eliminates the repeated legend lookups that grouped bars demand, while whitespace between rows keeps each comparison distinct.
Design Basics
A clean dumbbell or bar chart begins with restraint. Strip away heavy gridlines, redundant axis ticks, drop shadows, gradient fills, and decorative backgrounds that compete with the data. A light grid or none at all, direct labels where space permits, and a single accent color for the focal element usually carry the message best. Review every line, label, and legend entry and remove whatever the reader can infer without it.
Order categories logically to support the chart’s goal:
- Alphabetical order works for lookup tasks.
- Sorting by value or magnitude (bar length, gap size, or endpoint position) makes comparison patterns visible at a glance.
- Natural sequences—such as time periods, age bands, or process stages—should be preserved as they are.
Keep ordering consistent across related charts so readers do not have to relearn the layout from one figure to the next.
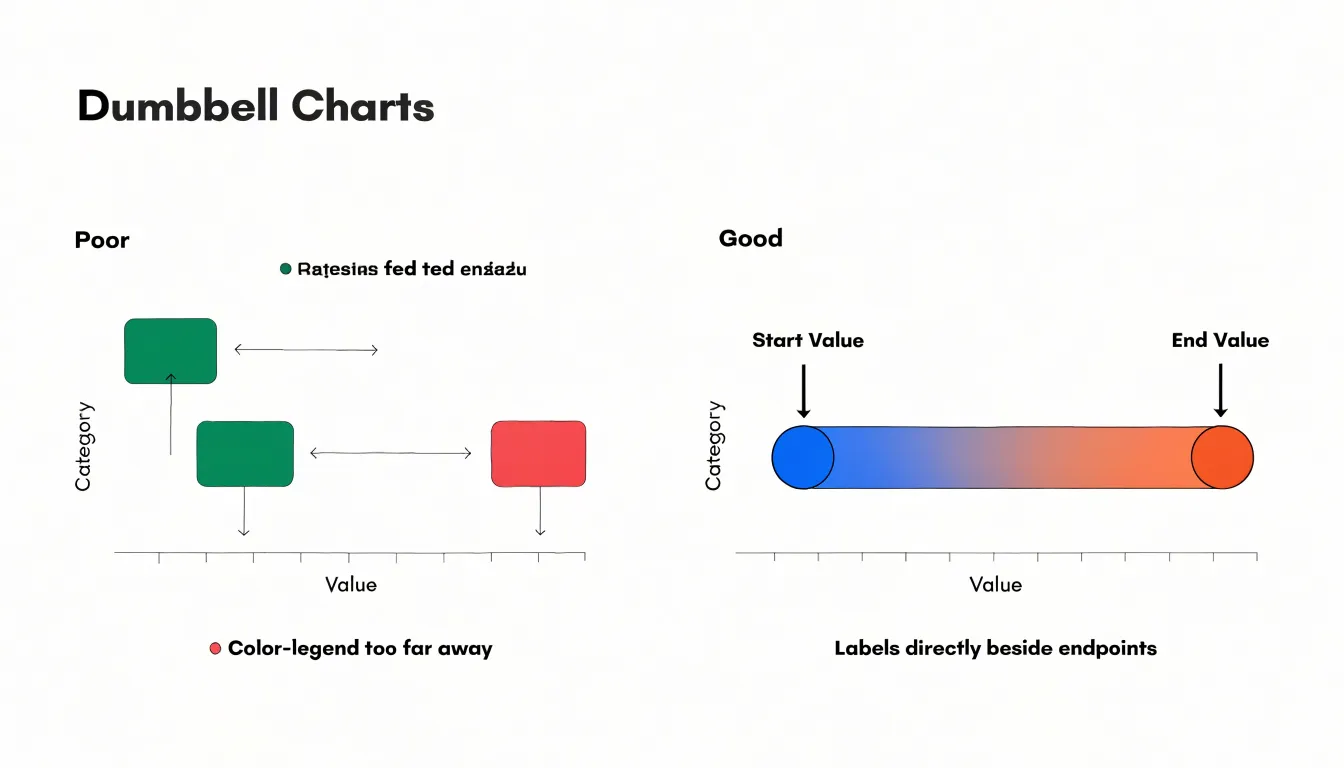
Manage whitespace deliberately. Comfortable padding around the plot area, even spacing within groups, and wider gaps between groups help signal category boundaries and prevent cramping. At the same time, avoid wasted space that shrinks the data region, such as oversized titles or legends placed far from the marks they explain.
Axes and Scale
Both chart types rely on a consistent, continuous scale so visual distances match numerical differences:
- Zero-based baseline: A bar chart must start at zero so bar lengths remain proportional to the values they represent. Dumbbell charts focus on the distance between two points and are less dependent on a zero baseline, though a zero-based axis still provides useful context when absolute magnitudes matter.
- Consistent scaling: Every category or panel in a multi-chart view should share the same axis range; inconsistent scales exaggerate or downplay changes.
- Even tick intervals: Use uniform increments (such as 10 or 20 units) without scale breaks or jumps, and include a clear axis title with units.
Color Choices
In a dumbbell chart, color tells the reader which marker is the start and which is the end. Assigning a muted or neutral tone to the baseline dot and a saturated tone to the endpoint dot guides the eye from origin to destination. Coloring the connecting line in a lighter tint of the same family preserves visual hierarchy so the line does not compete with the endpoints.
Color can also encode the direction of change. When the story hinges on which items improved and which declined, assigning a warm color to negative movement and a cool color to positive movement lets readers sort the outcomes without reading numbers. Alternatively, the connector can shift color only when a change crosses zero, leaving modest shifts in neutral gray while flagging dramatic reversals in a vivid hue. Stick to a restrained palette of three to five colors applied consistently across every row.
Common Mistakes
Several design pitfalls regularly undermine bar and dumbbell charts:
- Truncating the axis: Starting a bar chart scale above zero distorts relative bar lengths and exaggerates small differences. If a dumbbell chart uses a non-zero axis to zoom in on tight pairs, label the scale clearly so the range is obvious.
- Overcrowding the chart: Packing too many bars into a chart creates a dense forest, while close values in a dumbbell chart cause markers to overlap and obscure the pattern. Limit the number of categories, group smaller items into an “Other” category, or use interactive filters for large datasets.
- Over-complicating visual encodings: Avoid 3D effects, decorative patterns, or gradient fills that imply a continuous scale on categorical bars. In dumbbell charts, do not vary line thickness or marker size unless those dimensions encode an additional variable.
Real World Use Cases
Dumbbell charts are common in business intelligence dashboards whenever analysts need to show two measures and their gap across many categories:
- Year-over-year revenue: Across a dozen sales territories, one dot marks last year’s revenue and a second marks this year’s. Sorting by gap size and coloring connectors by growth versus contraction highlights momentum and problem regions immediately.
- Demographic target gaps: A retailer can compare a priority segment’s share of store customers against that segment’s share of the surrounding market. Wide gaps signal untapped local demand; close dots confirm the store is reaching the available audience.
- Pricing comparisons: Product teams pair a competitor’s price with an internal price on each row to spot overpricing and underpricing in one pass.
- Operational and survey tracking: The same layout tracks survey sentiment between two waves, compares actual to budgeted headcount by department, or measures vendor on-time delivery rates against targets.
Tools
Building bar and dumbbell charts requires different setups depending on the software:
- Excel: Arrange categories in rows with two columns for start and end values. Insert a stacked bar chart, convert the start-value series to a clustered bar, and set its fill to “No Fill” so the end values float. To add the connecting line, either plot a scatter series on a secondary axis aligned to each category, or use horizontal error bars set to a negative direction to span the gap.
- Tableau: Place the category on Rows and the measure on the Columns shelf twice. Use a dual-axis combination, set both marks to Circle, synchronize the axes, and connect the points using a calculated field or reference line (or place Measure Values on Columns with a Line mark layer).
- R (ggplot2): For bar charts, use
geom_col()withcoord_flip()for horizontal bars. For dumbbell charts, combinegeom_segment()for the connector (mapping start and end values toxandxend, and categories toyandyend, usingsizefor line thickness) withgeom_point()for the markers. Alternatively, theggaltpackage providesgeom_dumbbell()to build the chart in a single layer. Order factor levels from high to low for a clean layout.
Accessibility
Roughly one in twelve men and one in two hundred women experience some form of color vision deficiency, making accessible encoding essential:
- Colorblind-safe palettes: Choose palettes that vary in lightness and saturation as well as hue, so red-green or blue shades remain distinct under deuteranopia and protanopia. Tested scales from ColorBrewer or Viridis preserve separation, and pairing color with shape, dot size, or position provides a redundant visual cue.
- Direct labeling: Placing category names or series labels directly beside bars or dumbbell endpoints removes the need to match plot colors against a distant legend, helping readers with low vision, color blindness, or screen glare.
- Mobile and touch sizing: On small screens, interactive tap targets need enough surface area and spacing to prevent mis-taps, and hover-only tooltips require tap equivalents. Responsive chart libraries can reflow labels, reduce tick density, and switch vertical bars to horizontal layouts when screen width is tight.
Choosing the Right Chart
Match the chart to the structure of your data and your reporting goal:
- Use a bar chart when you have one value per category and want to compare absolute magnitudes, show rankings, or display an overall distribution. Bar charts are universally familiar and require no explanation for general audiences.
- Use a dumbbell chart when you have two comparable values per category—such as before-and-after metrics, two time periods, or actuals versus targets—and the primary message is the size or direction of the gap between them. While some audiences may need a brief introduction to read the endpoints, the format handles paired comparisons across many categories with far less clutter than grouped bars.
Overview
When deciding between a bar chart and a dumbbell chart, anchor your design to the specific comparison the audience needs to make:
- Match form to data: Use bars for single-value magnitudes and rankings; use dumbbells for paired values and changes.
- Minimize visual load: Strip out non-essential gridlines, legends, and decorative styling so attention stays on the marks.
- Order and scale honestly: Sort categories by the metric that matters, label directly where possible, and keep axes consistent.
- Fit the display context: Use larger text and fewer elements for slide decks than for detailed reports, and verify that a reader can grasp the main takeaway within a few seconds.
Frequently Asked Questions
What is the difference between a dumbbell chart and a bar chart?
A bar chart compares single values across categories, while a dumbbell chart uses two points connected by a line for each row, making the gap between paired values the dominant visual feature. Use bars for single-value magnitudes and rankings, and dumbbells for paired values and changes.
How do you read a dumbbell chart?
Each row has two markers connected by a line, with the endpoints showing each state in absolute terms and the connector length conveying the magnitude of change. The direction of the line also shows whether values moved lower or higher.
Can a bar chart show before-and-after data?
Yes—typically through grouped bars placed side by side or a single bar showing the current value with an annotation for the prior one. Grouped bars preserve exact magnitudes, but comparing adjacent bars requires the eye to jump back and forth, and the gap between states remains implicit.
Are dumbbell charts better than grouped bar charts for many categories?
Dumbbell charts organize high-density category lists more cleanly by assigning one horizontal row per category, and rows can be sorted by gap size or endpoint position. Grouped bar charts can become crowded with multiple series and force readers to repeatedly check the legend.
Why should a bar chart start at zero?
A bar chart must start at zero so bar lengths remain proportional to the values they represent. Starting a bar chart scale above zero distorts relative bar lengths and exaggerates small differences.
How do you make a dumbbell chart in Excel?
Arrange categories in rows with two columns for start and end values, insert a stacked bar chart, convert the start-value series to a clustered bar, and set its fill to No Fill so the end values float. To add the connecting line, plot a scatter series on a secondary axis aligned to each category or use horizontal error bars set to a negative direction to span the gap.
Tony Astor
Tony writes about data visualization and the tools people use to build charts and dashboards. More about Data Illustrator