Dumbbell Chart: Showing the Gap Between Two Values
 By Tony Astor ·

Dumbbell Chart
A dumbbell chart is a compact chart that compares two related values across categories using paired dots connected by a line, forming a dumbbell shape. The dots mark the two values, such as before-and-after or two groups, and the connecting line’s length shows the gap or change between them.
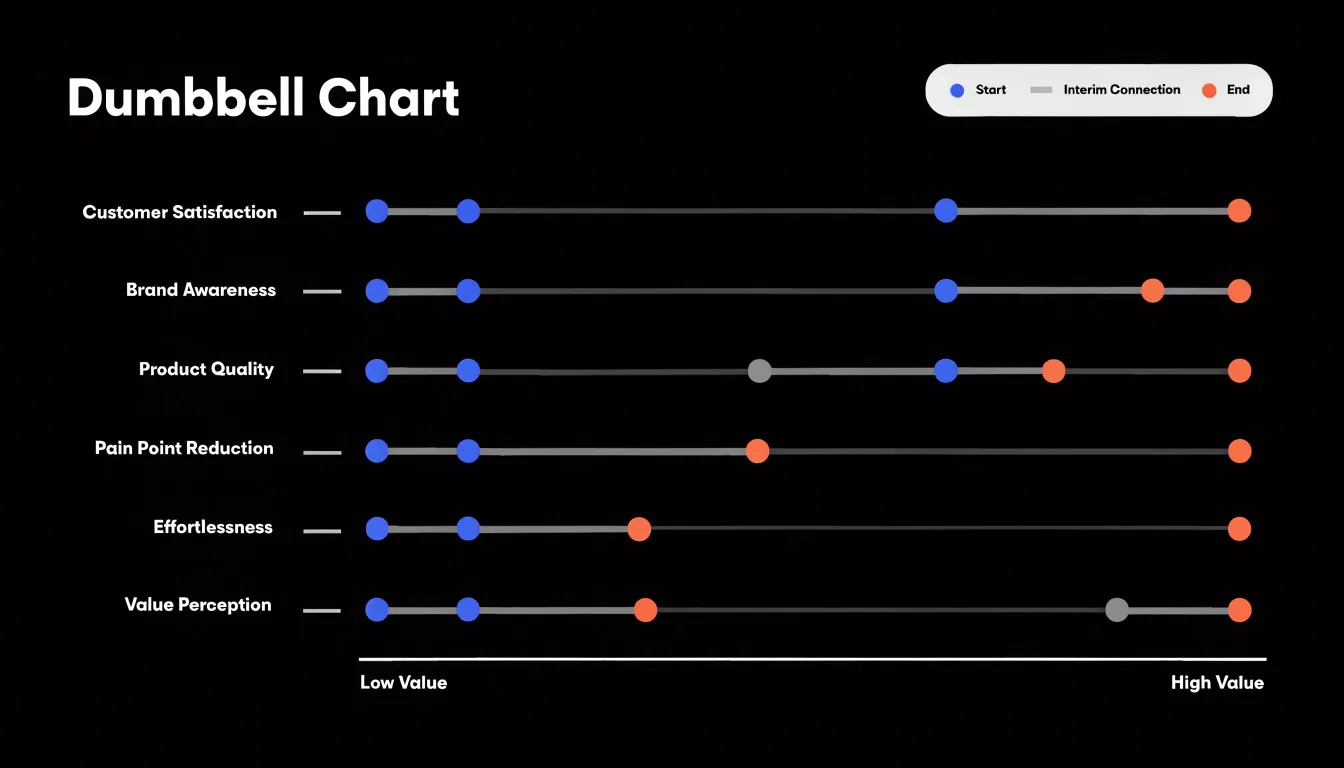
Table of Contents
Dumbbell Chart
A dumbbell chart is a compact visual tool for comparing two related values across multiple categories. Each category is represented by a pair of points connected by a line segment, forming a shape reminiscent of a dumbbell. The two points typically correspond to two time periods, two groups, or two conditions, and their horizontal or vertical position indicates the measured value. By placing categories along one axis and values along the other, the chart makes it easy to see both the absolute levels and the gap between the paired values for each group.
The primary strength of the dumbbell chart lies in its ability to highlight relative performance and overall variance. The length of the connecting line directly shows the difference between the two values, drawing attention to categories with large or small changes. This makes it particularly useful for before-and-after comparisons or for comparing two groups side by side. For example, a company might use a dumbbell chart to compare employee satisfaction scores before and after a new policy, or to compare the average sales of two product lines across different regions. The visual pairing encourages viewers to focus on the gap rather than on individual values alone.
Visual Anatomy
The dumbbell chart derives its name and its expressive power from three core components that turn an abstract difference between two numbers into a concrete spatial distance the eye can measure directly.
The baseline provides the reference against which the dots are positioned. Typically a horizontal or vertical axis, it establishes the scale that translates numeric values into physical location. A well-constructed baseline carries consistent tick marks and clear labels, so that the position of each dot can be read against a known standard. The baseline also anchors the chart visually, giving the connecting lines a shared frame of reference so that gaps across many rows can be compared at a glance.
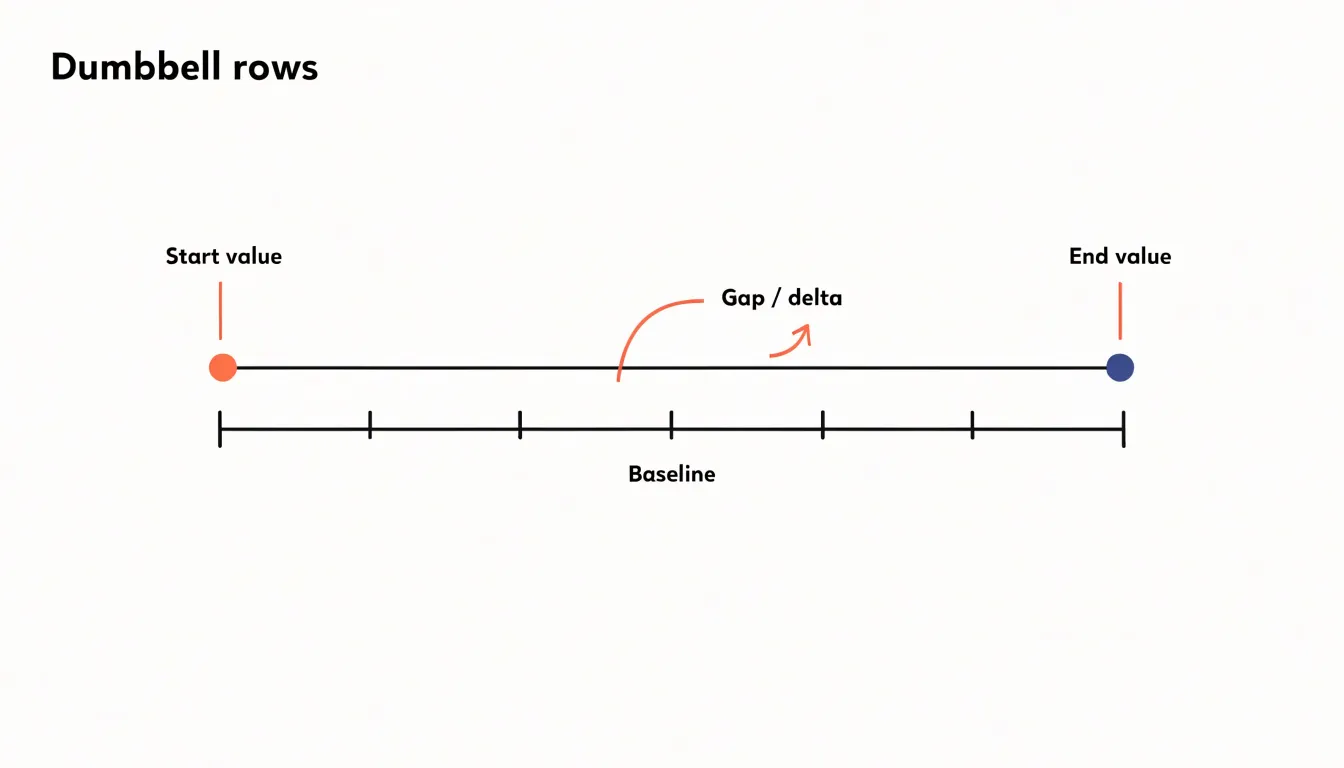
The endpoints are the two dots at either end of each connecting line. Their placement encodes the start and end values of the comparison, and their styling—whether filled circles, hollow markers, or dots of contrasting color—helps distinguish the two conditions being compared. Because each dot sits at an exact position along the baseline, the endpoints communicate both absolute values and, through their relative placement, the direction of change.
The connecting line segment is the element that draws immediate visual focus to the delta. By physically bridging the two endpoints, the line transforms an interval into a measurable length. Readers can scan a column of parallel line segments and instantly rank them by size, identifying the largest and smallest gaps without reading a single number. Color and thickness in the connector can further encode direction or category, reinforcing the gap as the chart’s central message.
Dumbbell vs. Bar Chart
Dumbbell charts and grouped bar charts both display comparisons between two values, yet the dumbbell design reduces visual clutter in ways that sharpen the reader’s focus on the change itself. A grouped bar chart devotes considerable ink to the full length of each bar, from the baseline up to the data value. When many categories are shown, those bars form a dense wall of filled rectangles, and the eye must travel across paired bars and mentally subtract one length from the other to grasp the difference. The comparison becomes an act of arithmetic performed visually, and the baseline often stretches far below the region where the interesting variation occurs.
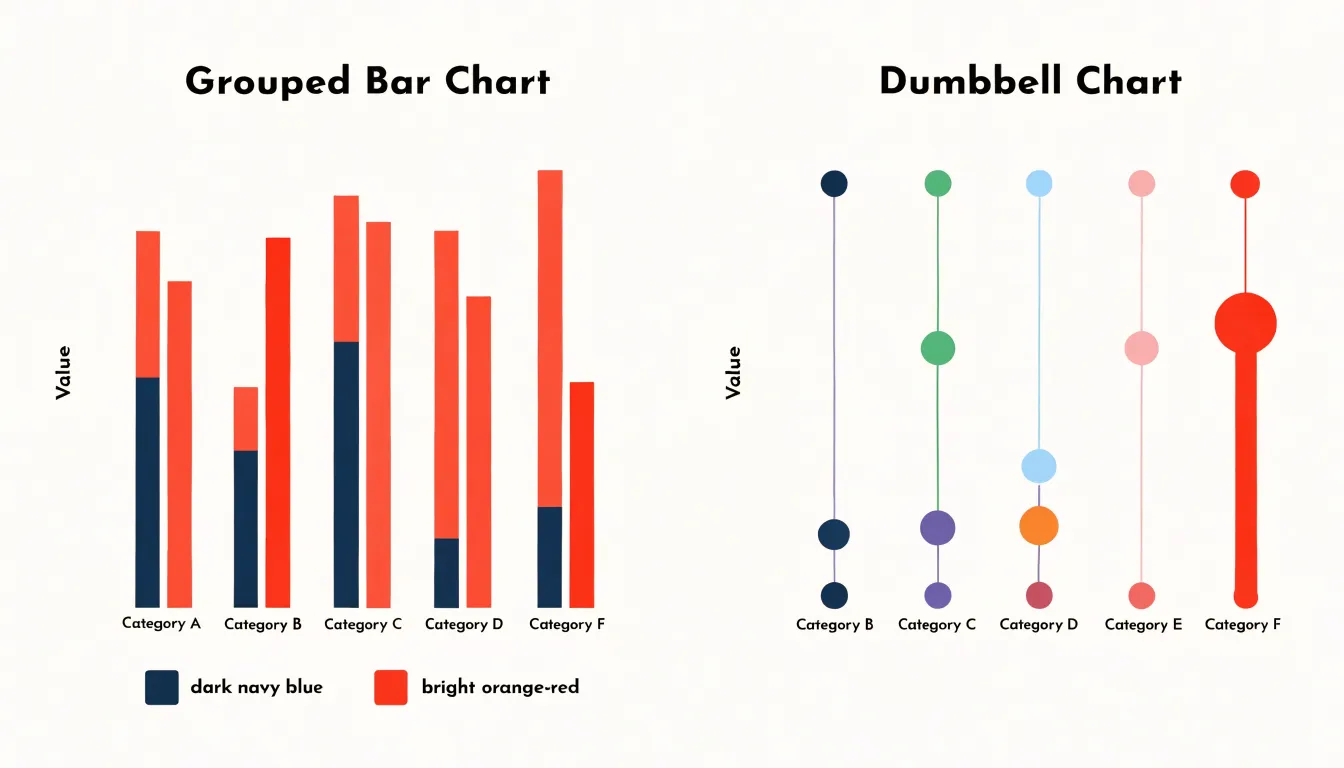
A dumbbell chart strips away that bulk. Each category occupies a single horizontal line, and the filled area between the baseline and each value disappears, leaving only the two endpoints and the line joining them. Readers can compare gap lengths across rows without reconstructing differences from bar heights.
The reduction in clutter also frees space for more categories. Without broad bars competing for room, dozens of rows can fit in a compact vertical layout while remaining legible, with labels sitting comfortably beside each pair of dots. This spare visual form makes dumbbell charts especially effective when the story lies in how much each category moved between two points.
When to Use
Dumbbell charts excel when a dataset pairs two measurements for each category along a shared quantitative scale:
- Before-and-after studies: A pre-intervention value and a post-intervention value for each subject, site, or group, with the connecting bar showing the direction and magnitude of change.
- Survey result comparisons: The same question asked across time periods, demographic segments, or respondent groups. Plotting the two percentages as endpoints turns a table of numbers into a readable pattern where large or inverted gaps stand out immediately.
- Benchmark analyses: A benchmark and an actual value naturally form the two-endpoint structure. A company comparing its performance against an industry average, an organization tracking departmental results against a target, or a student cohort measured against a national norm all benefit from this arrangement.
This structure appears in many fields: prices at two points in time, life expectancy across two years, vote shares in two elections, or rankings of items by two reviewers. The format also works when the categories themselves carry meaning and order matters, since the vertical arrangement makes scanning easy.
Color Coding
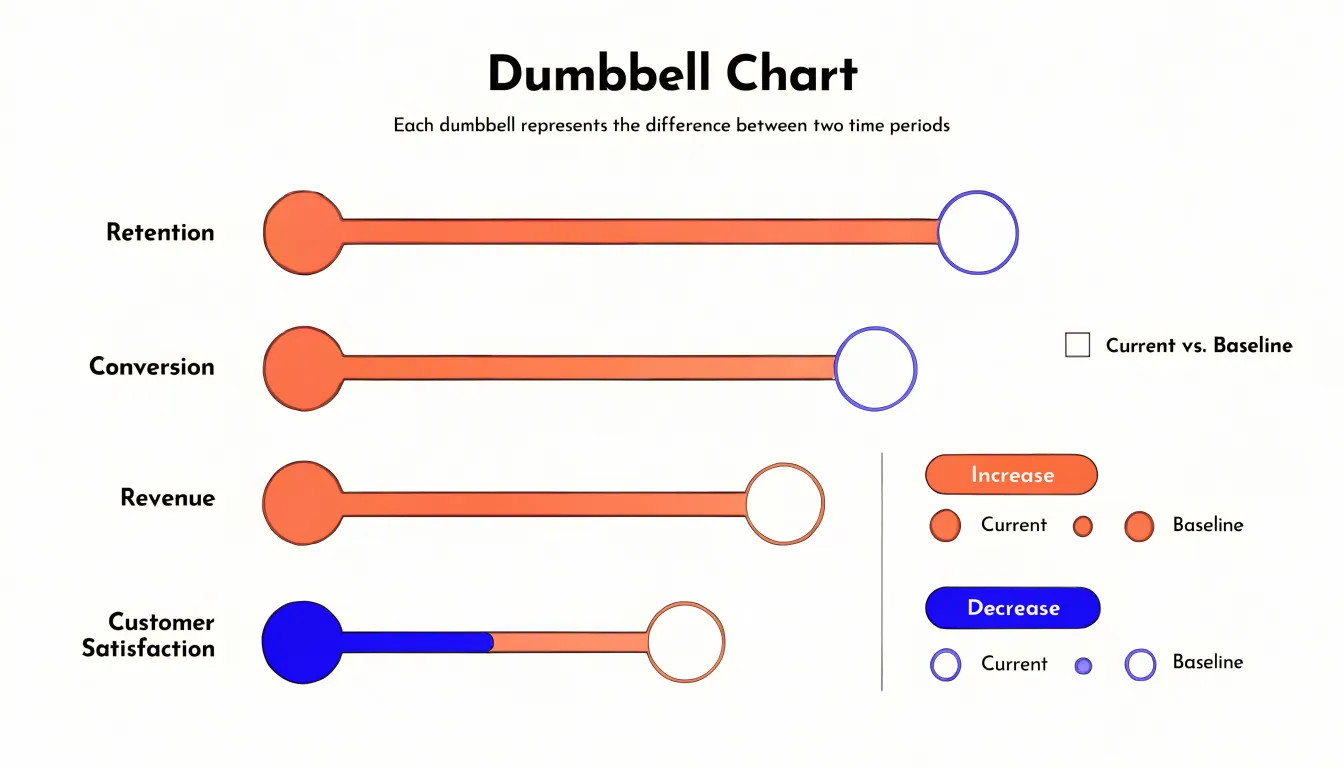
Color coding transforms a dumbbell chart from a neutral comparison of paired values into a narrative about direction and outcome. A common convention assigns one color family to increases and another to decreases, so a bar that rises from left to right appears in a warm or positive tone while a falling bar shifts to a cooler or alert tone. This directional scheme lets an audience scan a dense field of dumbbells and immediately separate the metrics that are improving from those that are slipping, even when dozens of rows compete for attention.
The choice of palette matters as much as the direction it encodes. Sequential shades can show the magnitude of a change, with deeper saturation marking larger movements and lighter tints marking modest ones. Diverging palettes anchored around a neutral midpoint work well when the dataset revolves around a meaningful zero, such as net growth versus net loss, or performance above and below a target. In those cases the midpoint color acts as a visual baseline, and any deviation toward either pole reads as a distinct signal.
Contrasting markers add a second layer of meaning at the endpoints themselves. Filled markers can represent the current period while hollow or outlined markers represent the baseline, giving viewers a consistent anchor for which end of the pair is which. Alternatively, marker color can flag threshold breaches: a point that crosses a target line might switch to a warning tone, drawing the eye to exceptions that deserve scrutiny. Pairing these marker cues with a clear legend and accessible, colorblind-safe hues ensures the encoding remains readable for every audience.
Sorting Categories
Sorting categories in a dumbbell chart is one of the most consequential decisions an analyst makes, because the order of rows determines what patterns the eye can detect. When rows are left in an arbitrary or alphabetical sequence, the reader must scan back and forth across the chart to compare gaps and endpoints, which slows comprehension and obscures the story.
Three ordering strategies suit most datasets:
- By gap size: Places the largest divergences at the top or bottom, making it immediately obvious which categories experienced the greatest change and distinguishing widespread shifts from isolated ones.
- By starting value: Groups categories according to where they began, making it easier to see whether early leaders maintained their position or fell behind over time.
- By overall magnitude: Orders rows by the total across both endpoints or the average value, giving a sense of which categories carry the most weight in the dataset.
The right choice depends on the question the chart is meant to answer. If the goal is to highlight movement, gap-based sorting brings the biggest movements into focus. If the goal is to compare levels, sorting by magnitude or starting point produces cleaner comparisons. Many analysts test several orderings before settling on one, since a different sort can reveal a pattern that was invisible in another arrangement. Adding a subtle visual cue, such as a small bar or label showing the variance, reinforces the ordering logic and helps readers trust the sequence they see.
Decluttering
Because a dumbbell chart communicates through the position of its markers, every additional visual element competes with that primary signal. Gridlines serve as the reference scaffold that lets readers translate a marker’s horizontal position into a value. Keep them thin, light, and unobtrusive, using a soft neutral gray that recedes behind the data. Vertical gridlines usually do the most work because values are read along the x-axis; horizontal lines can often be removed entirely or reserved for faint guides aligned with each category row. Avoid heavy borders around the plotting area, drop background fills, and eliminate tick marks that merely duplicate the grid.
Axis formatting deserves similar restraint. Label only meaningful, evenly spaced intervals rather than every data point, and choose a round tick sequence that lets readers estimate intermediate values mentally. Keep axis labels in a consistent, modest type size, and format numbers uniformly so that decimal places and thousands separators do not vary from tick to tick. Where categories are listed along the y-axis, align labels to a consistent edge and avoid wrapping them into multiple lines unless space demands it. A short, clear axis title removes the need for redundant annotations elsewhere in the chart.
Marker scaling affects both legibility and perceived hierarchy. Dots should be large enough to register instantly yet small enough to leave clear whitespace between neighboring markers. When marker size encodes a variable, cap the range so that the largest dot does not overwhelm its row or collide with adjacent rows. Consistent sizes for identical values help readers compare without recalculation. Add a subtle outline to markers only when they overlap a gridline, and use color sparingly to distinguish groups rather than decorate.
Excel
Excel offers no native dumbbell chart type, so building one relies on combining chart elements to simulate two points connected by a horizontal bar. The most reliable route begins with a scatter plot:
- Arrange your data in three columns: a category label, a start value, and an end value. Add a helper column containing the category positions (1, 2, 3, and so on) so Excel can plot each row along the vertical axis at evenly spaced intervals.
- Insert an XY scatter chart using the category positions as the X values and the start values as the Y values to produce the first set of dots. Add the end values as a second series to place the second dot of each dumbbell.
- Select the start-value series and add horizontal error bars. Choose the custom error amount option and point the positive and negative values at a computed difference column equal to the end value minus the start value. Setting the negative direction to zero and the positive direction to the difference draws a line from each start dot to its matching end dot. Format the error bars with a thicker line weight and a neutral gray.
- Clean the chart: hide gridlines, remove the legend, adjust axis bounds to frame the data tightly, and label the endpoints directly.
An alternative approach uses a stacked bar chart with a transparent first series. Plot the minimum value as an invisible base bar, then stack the difference on top so only the gap between values shows. Overlay scatter points for the endpoints if visible markers are needed.
Tableau
Building a dynamic dumbbell chart in Tableau begins with preparing the data so that each record contains a start value and an end value for the same category:
- Place the categorical dimension on the Rows shelf, then drag the start measure and end measure onto the Columns shelf, creating two separate marks cards.
- On the second measure, change the mark type to Circle, and on the first, set the mark type to Line.
- Right-click the second measure’s pill and choose Dual Axis, then synchronize the axes so that the scale is consistent across both marks. Adjust the size of the circles and the thickness of the line so the endpoints remain legible.
- For dynamic behavior, create a parameter that lets the viewer select which measure pair to display, then build calculated fields that reference the parameter and return the appropriate start or end value. Replace the original measure pills with these calculated fields so the chart updates when the parameter changes. Add a second parameter wired into a calculated field on the Rows shelf or filter card to control category sorting or filtering.
- Format the axes, hide the second axis header, add labels to the circle endpoints, and set a consistent color for the connecting lines. Test the parameter selections to confirm the dual axes stay synchronized and the marks reposition correctly.
Python
Matplotlib provides a direct, low-level pathway to dumbbell charts through its horizontal line and scatter primitives. The core recipe pairs ax.hlines() for the connecting segment with two ax.scatter() calls for the endpoint markers. A typical snippet begins by defining the y positions for each category, then calling ax.hlines(y=positions, xmin=start_values, xmax=end_values, color='grey', linewidth=2) to draw the gap connectors in one vectorized call. Two scatter layers follow, one for the starting values and one for the ending values, each with its own color and size. Because hlines and scatter accept arrays, the entire chart is built from a handful of lines of code, which keeps notebooks readable and makes the chart easy to regenerate when the underlying data changes.
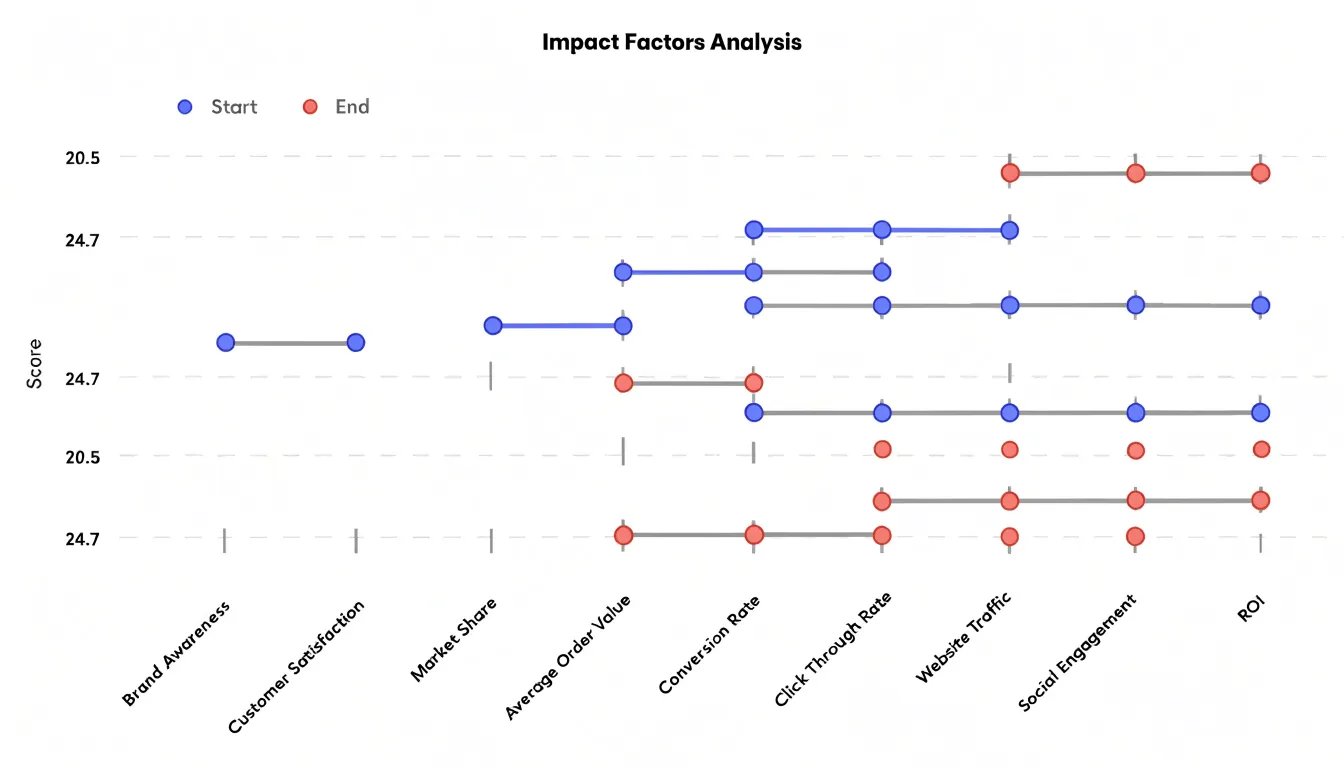
Seaborn complements this by handling styling and color management. Loaded with sns.set_theme(), it adjusts the default palette, grid styling, and figure dimensions so the dumbbell chart inherits a consistent look across a report. Seaborn’s color palettes can be passed into the scatter calls: for example, sns.color_palette('deep') supplies a set of muted, accessible colors for the endpoint markers, while a lighter grey or a palette-derived shade works well for the connectors.
Practical refinements include sorting categories before plotting, adding value labels near each endpoint with ax.text() for precision, and using ax.set_yticks() with descriptive category names. Matplotlib’s tight_layout() or constrained layout removes overlapping labels.
Common Mistakes
Several common design flaws can undermine a dumbbell chart’s clarity and lead to misinterpretation:
- Truncated axes: When the scale does not start at zero, the visual length of the connecting line can exaggerate or understate the actual difference between the two values—making a small change appear dramatic on a shortened axis, or a large change look insignificant across a wide range. Ensure the axis starts at zero or clearly indicate that it is truncated, and verify that the visual representation accurately reflects the magnitude of change.
- Overcrowded category labels: Long or numerous labels can overlap and become unreadable. Mitigate this by abbreviating labels, rotating them, or using a horizontal layout that provides more space. If necessary, group smaller categories into an “Other” category or use interactive elements that reveal full labels on hover.
- Confusing marker legends: When multiple markers represent different groups or time periods, unclear or distant legends cause misinterpretation. Position legends close to the data they describe, avoid overwhelming the viewer with too many marker types, or use direct labeling on the first row instead of a separate legend.
- Color-only encoding: Relying solely on color to distinguish markers can exclude viewers with color vision deficiencies. Incorporate patterns or shapes as secondary encoding.
- Overpowering connectors: Connecting lines that are too thick can swallow the endpoint markers. Keep connectors narrower than the dots they join.
Dual Axis
When a secondary metric or contextual benchmark is genuinely necessary—such as a target line, a prior-year figure, or a related rate—a dual axis can accommodate it without destroying the primary comparison, provided the overlay is handled with discipline. The dumbbell’s endpoints and connecting bar should always map to the axis that carries the gap story, and that axis should remain visually dominant through color, label placement, and marker thickness. The secondary axis exists to give the overlay meaning, so its ticks and labels should be visually quieter—lighter in tone and smaller in type—signaling subordinate status to the reader.
Contextual benchmarks usually work best as a thin reference line, a subtle band, or a small ghosted marker sitting behind the dumbbell endpoints rather than as a full second series of bars or dots. These forms read as annotation rather than as a competing data voice. Color should separate the two systems entirely: the primary dumbbell in a strong, saturated hue, and the overlay in a neutral gray or a desaturated tint, so no reader has to work out which mark belongs to which axis. Labeling the secondary axis directly, with a short note such as units or source, removes ambiguity without requiring a legend that doubles the chart’s visual weight.
Restraint is the final safeguard. A dual axis is justified when the overlay answers a question the primary gap raises, such as whether a change outpaced a benchmark. If the secondary metric needs its own trend narrative, it belongs in a separate chart.
Interactive Tooltips
Interactive tooltips turn a static dumbbell chart into a dynamic exploration tool. When a user hovers over a dumbbell, a tooltip can display the exact values for both endpoints, the absolute difference between them, and the percentage change relative to the baseline. This immediate access to precise numbers eliminates the need to estimate values from axis positions, which is especially valuable when the chart contains many rows or when the scale makes small differences hard to discern.
Beyond basic values, tooltips can include sample sizes or data quality indicators. For instance, showing the number of observations behind each endpoint alerts users to cases where small sample sizes may reduce reliability, letting them assess data robustness without cluttering the main view.
Configuring tooltips involves defining trigger areas (the entire dumbbell or individual points), designing concise layouts, and ensuring responsiveness across devices, with dynamic content formatted to match the chart’s style.
Real World Examples
Real-world applications across industries show how versatile paired-point comparisons can be:
- Executive business dashboards: A retail leadership team might plot customer satisfaction scores by store before and after a service redesign, letting executives see at a glance which locations improved sharply, which barely budged, and which slipped. The same pattern works for tracking quarterly revenue by product line, employee engagement before and after a policy change, or market share against a competitor benchmark.
- Demographic research: A public health agency might chart life expectancy by region for two census years to highlight places where the gap narrowed or widened. Workforce researchers can place male and female participation rates on the same row, turning the connecting segment into a visual measure of gender disparity across industries or age brackets. Migration studies link origin and destination figures on a single line to show net shifts.
- Financial reporting: Analysts compare opening and closing balances, budgeted versus actual spending by department, or credit ratings before and after a fiscal event. An investor relations team might show earnings per share across two consecutive years for a portfolio of holdings, letting the length of each bar communicate momentum instantly.
Dashboard Overview
A dashboard overview distills the disparities shown in a dumbbell chart into a concise executive summary for strategic decision-making. Rather than leaving readers to inspect each row in isolation, the overview aggregates movements across the chart—flagging, for instance, which regions require immediate attention after a drop in customer satisfaction and which strategies are yielding results.
This synthesis is grounded in visual delta analysis: quantifying the gaps represented by the connecting lines, prioritizing them by magnitude or strategic importance, and linking them to key performance indicators, benchmarks, and organizational goals. Executives can then use this summary to allocate resources, adjust tactics, or launch targeted interventions where action will yield the greatest impact.
Frequently Asked Questions
What is a dumbbell chart used for?
A dumbbell chart is used to compare two related values across multiple categories, with each category shown as a pair of points connected by a line segment. It is especially useful for before-and-after comparisons, comparing two groups, or comparing two conditions while highlighting the gap between paired values.
How does a dumbbell chart differ from a bar chart?
A dumbbell chart removes the filled bars used in a grouped bar chart and leaves only the two endpoints and the line joining them. This reduces visual clutter and lets readers compare gap lengths across rows without mentally subtracting bar lengths.
When should you use a dumbbell chart?
Use a dumbbell chart when a dataset pairs two measurements for each category along a shared quantitative scale, such as before-and-after studies, survey result comparisons, or benchmark analyses. It works well when the story lies in how much each category moved between two points.
How should you sort categories in a dumbbell chart?
Categories can be sorted by gap size to highlight the largest changes, by starting value to compare where categories began, or by overall magnitude to show which categories carry the most weight. The right choice depends on the question the chart is meant to answer, and analysts may test several orderings before settling on one.
How do you create a dumbbell chart in Excel?
Excel has no native dumbbell chart type, so one reliable route is to use an XY scatter chart with category positions, a start-value series, and an end-value series, then add custom horizontal error bars to draw the connecting lines. An alternative approach uses a stacked bar chart with a transparent first series.
What are common mistakes to avoid in a dumbbell chart?
Avoid truncated axes, because they can exaggerate or understate the actual difference between values unless the truncation is clearly indicated. Also avoid overcrowded category labels, confusing marker legends, color-only encoding, and connecting lines that are too thick and overpower the endpoint markers.
Tony Astor
Tony writes about data visualization and the tools people use to build charts and dashboards. More about Data Illustrator