Donut Chart: Uses, Examples and Design Tips
 By Tony Astor ·

Donut Chart
A donut chart is a pie chart with the center removed, leaving a ring of colored segments whose arc lengths represent each category’s share of a whole. The hollow center can hold a total, key metric, or label, and the format works best with three to seven mutually exclusive categories that sum to 100%.
Table of Contents
Donut Chart Basics
A donut chart takes the structure of a pie chart and removes the inner portion, leaving a ring of colored segments surrounding an open center. Each slice’s arc length corresponds to its share of the whole, so readers compare categories by tracing the curved distance a segment occupies along the circle. Because segments sit at a uniform distance from the center, the eye can move around the ring and compare arc lengths directly, giving the form a steady, easily scanned rhythm.
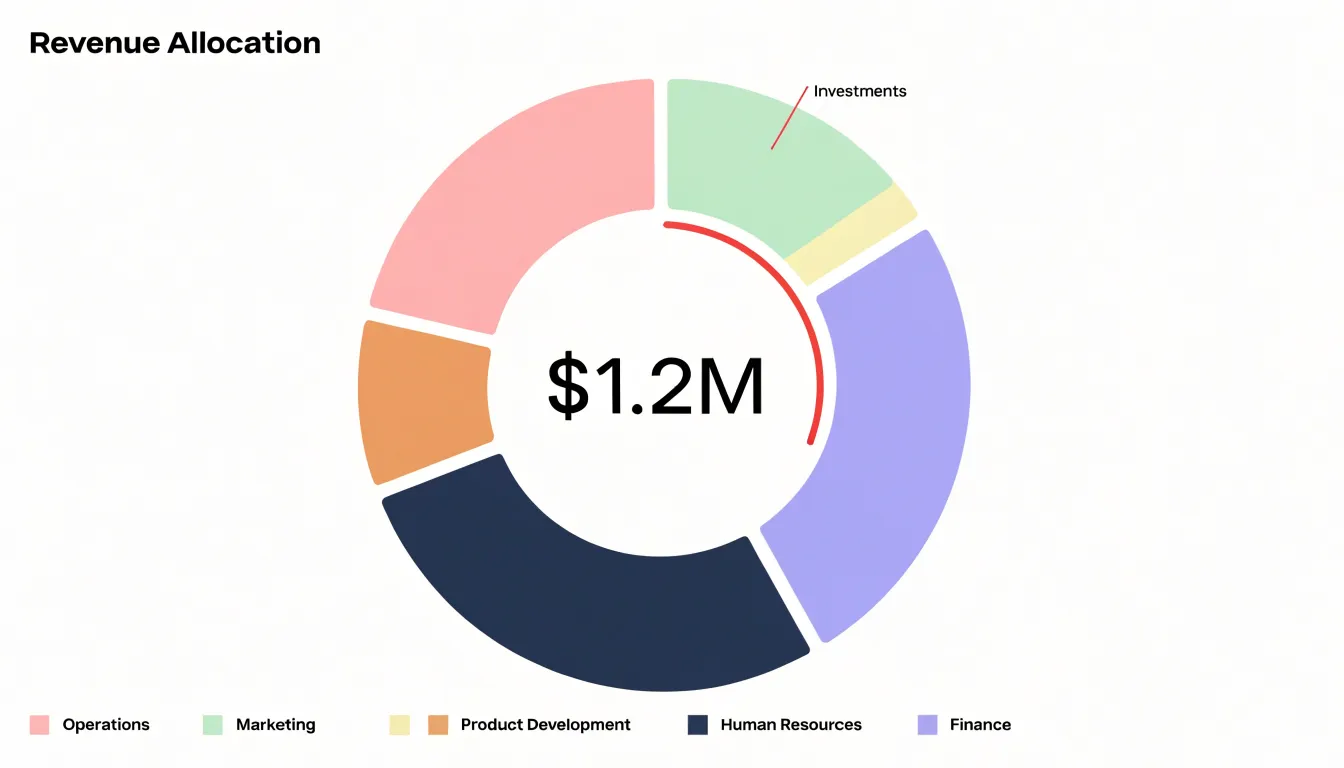
The hollow center changes how attention moves through the graphic. On a filled pie chart, the eye is drawn inward toward the convergence point where all slices meet, and large wedges dominate through sheer visual mass. With the middle removed, that inward pull disappears. Focus settles on the band of color itself, and the comparison happens along the circumference rather than across the interior. The result is a chart that reads as a set of parts arranged in sequence around a common track, which suits percentage breakdowns where the total matters less than the individual contributions.
The empty middle also functions as usable space. Instead of leaving it blank, designers place a headline figure there, such as a total, an average, or the value of the largest category. A single prominent number at the center anchors the chart and gives readers an immediate takeaway before they examine the segments. Smaller supporting text, a unit label, or a short caption can sit beneath that figure. In multi-ring or nested versions, the center can hold the overarching category name that ties the rings together, communicating both the breakdown and its headline in one compact figure.
Donut vs Pie Charts
Both donut and pie charts require comparing segment sizes, but the central hole in a donut chart shifts focus to the arcs and overall shape, often reducing the visual weight of individual slices. This can make small differences harder to discern, yet it creates a cleaner look that directs attention to the whole. Research suggests that people estimate angles similarly in both formats, but the donut’s ring shape may encourage a more holistic comparison of segments around the circle.
Legibility and layout also separate the two formats:
- Donut charts provide an open center for a total value or key metric, turning the chart into a compact dashboard element. They appear less cluttered when displaying several small segments because the empty center reduces visual noise. They also excel when data represents a single share or progress toward a goal, as the ring naturally implies a part of a whole with a clear total, fitting reports where space is limited and a modern aesthetic is desired.
- Pie charts have a solid center that leaves no room for central annotations and can feel denser. However, when the data has few segments and precise comparison of similar-sized slices is critical, pie charts may have a slight edge due to the continuous area from center to edge.
Best Data Types
Ring charts work best with categorical datasets whose values represent parts of a single whole. The ideal candidate has a modest number of clearly defined, mutually exclusive categories—typically between three and seven—where each maps to a meaningful share of a total adding up to 100 percent:
- Budget allocations: Departments such as marketing, operations, research, and administration each claim a portion of total spending, and the arcs together represent the full budget.
- Market share: Competing firms divide an industry, and each company’s arc signals its relative strength at a glance.
- Survey responses: When answers form a closed set, such as satisfaction levels or preferred options, the ring conveys the proportional split among respondent groups.
The key quality to look for is proportionality among a bounded set of categories. Data that describes rates, averages, or values that can exceed the total does not belong in a ring chart, since the form implies a fixed whole. When one or two categories dominate, the ring highlights that concentration effectively, which suits executive summaries and quick comparisons.
Segment Count
The readability of a donut chart depends heavily on how many segments share the ring. Once the count climbs past five, the chart begins to lose instant comprehension. A ring with two to five segments gives every category enough arc length to register at a glance, letting viewers compare proportions and spot the largest and smallest contributors without effort. When the segment count grows, the arcs shrink into thin slivers that are difficult to distinguish, and the eye must work harder to trace each color around the ring, consult the legend, and estimate a proportion that is no longer visually obvious.
Limiting slices also protects the ring from visual clutter. A crowded donut chart turns into a band of many similar colors, and the gaps between segments multiply, breaking the smooth curve that gives the chart its shape. Small categories often end up nearly indistinguishable in size, communicating noise rather than a clear message.
A practical approach is to consolidate. Group minor categories into an ‘Other’ slice, or decide whether the smallest items matter to the story at all. If a dataset genuinely contains many categories, the donut chart is usually the wrong format, and a bar chart will serve the comparison far better. Treat two to five segments as a working guideline, and review any chart that exceeds it before publishing.
Percentage Display
When a donut chart represents parts of a whole, the segments must add up to 100%. Before plotting, sum every value that will appear as a segment and confirm the total matches the figure you intend to treat as the whole. Keep raw values at full precision on the data side and reserve rounding for the display layer only. If rounded percentages shown on the chart add up to 99% or 101%, the chart loses credibility. A common remedy is to calculate each share precisely, round each label, and reconcile the difference by adjusting the largest segment by a single percentage point so the visible labels total exactly 100%. Larger residual differences should be investigated rather than absorbed, since they usually point to a missing category, a duplicated entry, or a filter that removed part of the whole.
Label formatting matters as much as the arithmetic:
- Round to one decimal place when segments are close in size, and to whole numbers when the differences are obvious.
- Place percentage labels directly on or beside their segments so there is no ambiguity about which number belongs to which slice, and include the % symbol consistently.
- When segments are too small for an inline label, pull the label outside the arc with a short leader line rather than omitting it.
- Accompany the chart with a title or subtitle that states the total explicitly, such as the reporting period alongside the overall figure the percentages describe.
- Display the absolute value beside the percentage in tooltips or a small legend for additional context.
Center Hole
A common mistake is to leave the center hole empty rather than using it strategically to reinforce the chart’s message. Beyond displaying a sum or overall percentage—such as total market size in a chart of market share by product—the space can hold KPI callouts that highlight the most important segment or a target achievement. Icons can also be placed in the center to provide quick context; a dollar sign for financial data or a user icon for demographic breakdowns helps orient the audience. In digital dashboards, the hole is a natural place for interactive elements, such as a dropdown to filter data, provided it does not distract from the primary visualization.
When adding text or icons, size them so they are large enough to be readable without overwhelming the ring. Use a font weight and color that contrasts with the background but harmonizes with the chart’s palette. Keep the content minimal: one or two elements at most. Avoid adding legends or multiple labels in the center, as this defeats the purpose of reducing clutter.
Color Choices
Color is your primary tool for grouping segments and guiding interpretation. Limit categorical palettes to five or six colors, using a neutral gray for any consolidated ‘Other’ category.
Distinct contrasts between adjacent segments are crucial. Using colors of similar lightness can blur boundaries; instead, alternate light and dark shades or use a qualitative palette with clear hue differences. Avoid relying solely on red-green contrasts so the chart remains legible for people with color vision deficiencies. Tools like ColorBrewer or online contrast checkers can help select palettes that meet WCAG guidelines for text and graphics, and testing your palette with grayscale conversion ensures that lightness differences alone provide sufficient contrast.
Strategic highlighting is another effective technique: use a single accent color to draw attention to the most important segment while muting others with grays or lighter tints. In a budget breakdown, for example, you might highlight the largest expense in a bold color and render the rest in subdued tones. Finally, maintain color consistency across multiple charts by keeping the same color for the same category to aid comparison.
Slice Order
When segment values are arranged from largest to smallest and placed sequentially clockwise starting from the 12 o’clock position, a donut chart gains a natural visual hierarchy that mirrors how most readers scan a circular graphic. The eye enters at the top and travels clockwise, meeting the most important value first and then moving through progressively smaller segments. This predictable rhythm lets viewers absorb the relative size of each category without hunting around the ring or cross-referencing a legend repeatedly.
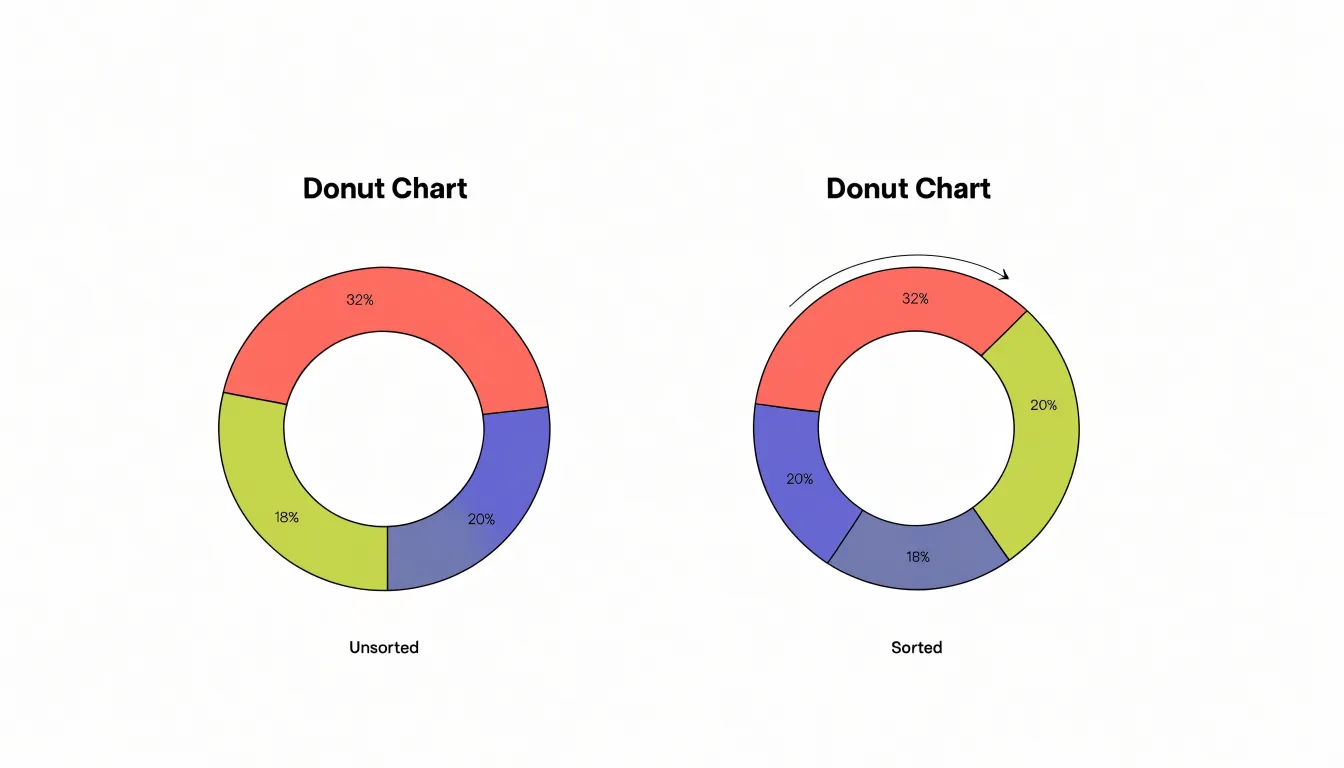
Sorting segments by magnitude produces a descending staircase of arc lengths that is easy to compare at a glance. Large wedges appear together near the top, medium values occupy the middle of the sweep, and the smallest slivers settle near the end of the circuit. Without such ordering, segments of wildly different sizes may sit adjacent in ways that disrupt comparison and make the chart feel haphazard.
Maintaining a consistent sort order across multiple donut charts further strengthens readability. When several rings share the same category sequence, readers can track a category’s position from one chart to the next and spot shifts in proportion more readily.
Multiple Series
Nesting multiple rings in a donut chart allows you to compare several datasets within the same circular space, creating a concentric hierarchy that reveals relationships between categories and subcategories. Typically, two or three rings are manageable, while more can overwhelm the viewer. Each ring should represent a distinct series, ordered logically with the most important or highest-level data on the outer ring, moving inward to more granular details. This outside-in approach aligns with natural reading patterns and helps viewers parse the hierarchy.
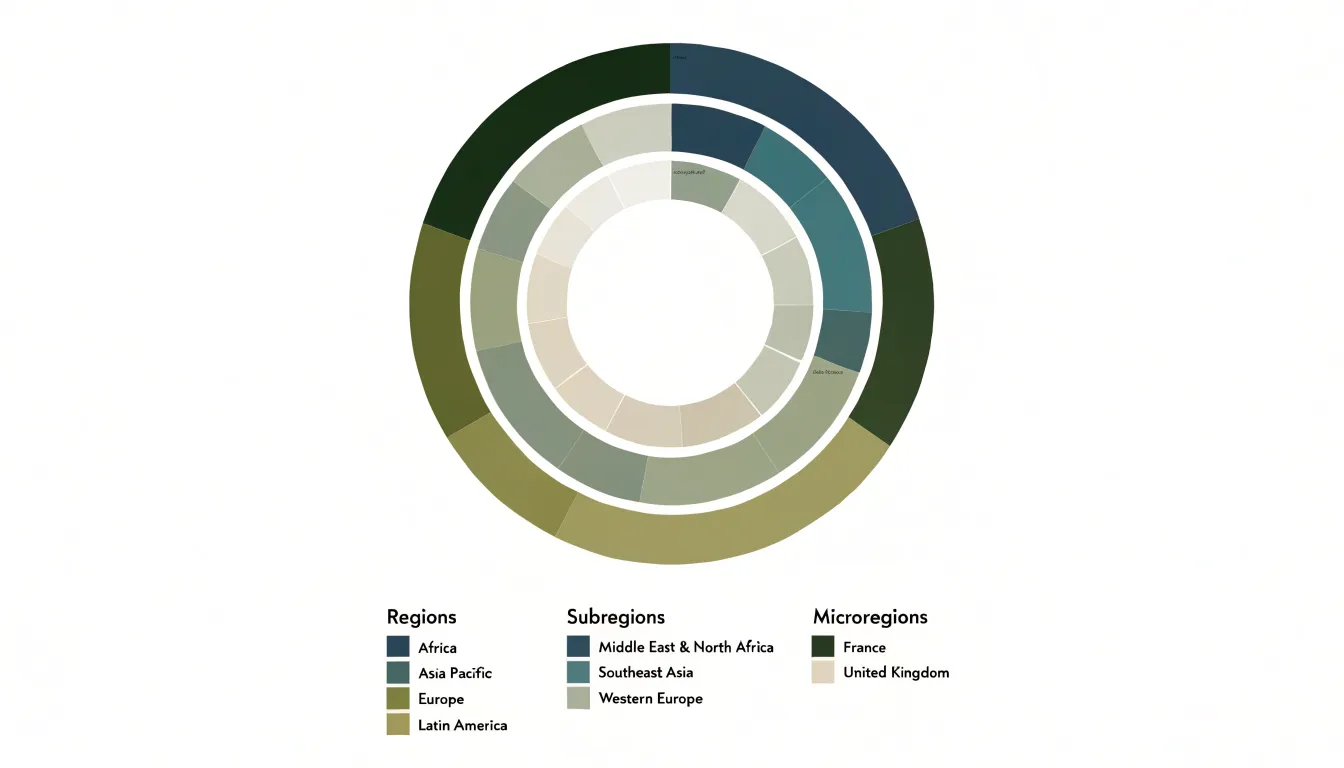
Use a consistent color palette across rings, assigning similar hues to related categories. If the outer ring shows broad regions, the inner rings could use lighter or darker shades of the same color to represent subregions, creating a visual link between them. Alternatively, use a monochromatic scheme with varying intensities to indicate magnitude. Thin white borders or gaps between segments help delineate boundaries between adjacent rings and slices.
Because space is tight in concentric layouts, place labels directly inside larger segments, use callouts or interactive tooltips for smaller ones, and provide a legend that groups related items by ring or color family. Multi-ring donuts are best for showing part-to-whole relationships at different levels rather than precise comparisons, so keep the number of segments per ring below seven to maintain readability.
Common Design Mistakes
Donut charts fail most often through accumulated visual clutter and distortion rather than a single dramatic error:
- Crowded labeling: When slice names and percentages are crammed into thin arcs, readers must trace faint leader lines back and forth. Labels work best when placed outside the ring with generous spacing, or replaced by short numbered keys tied to a clean list.
- Confusing shading: Gradients, drop shadows, and beveled edges distort the reader’s sense of proportion, since darker or glossier segments appear heavier than they are. Flat, solid fills in a restrained palette let the arc lengths carry the message.
- Three-dimensional effects: Tilting the ring foreshortens the far side, so equal values no longer occupy equal visual space.
- Redundant legends: Including a legend when every slice is already labeled directly on the chart wastes space and forces the eye to match colors across the page for no benefit.
- Misaligned callouts: Annotation boxes that drift away from their slices or point at the wrong arc invite misreading. Align callouts precisely and keep annotation text close to its segment.
Accessibility
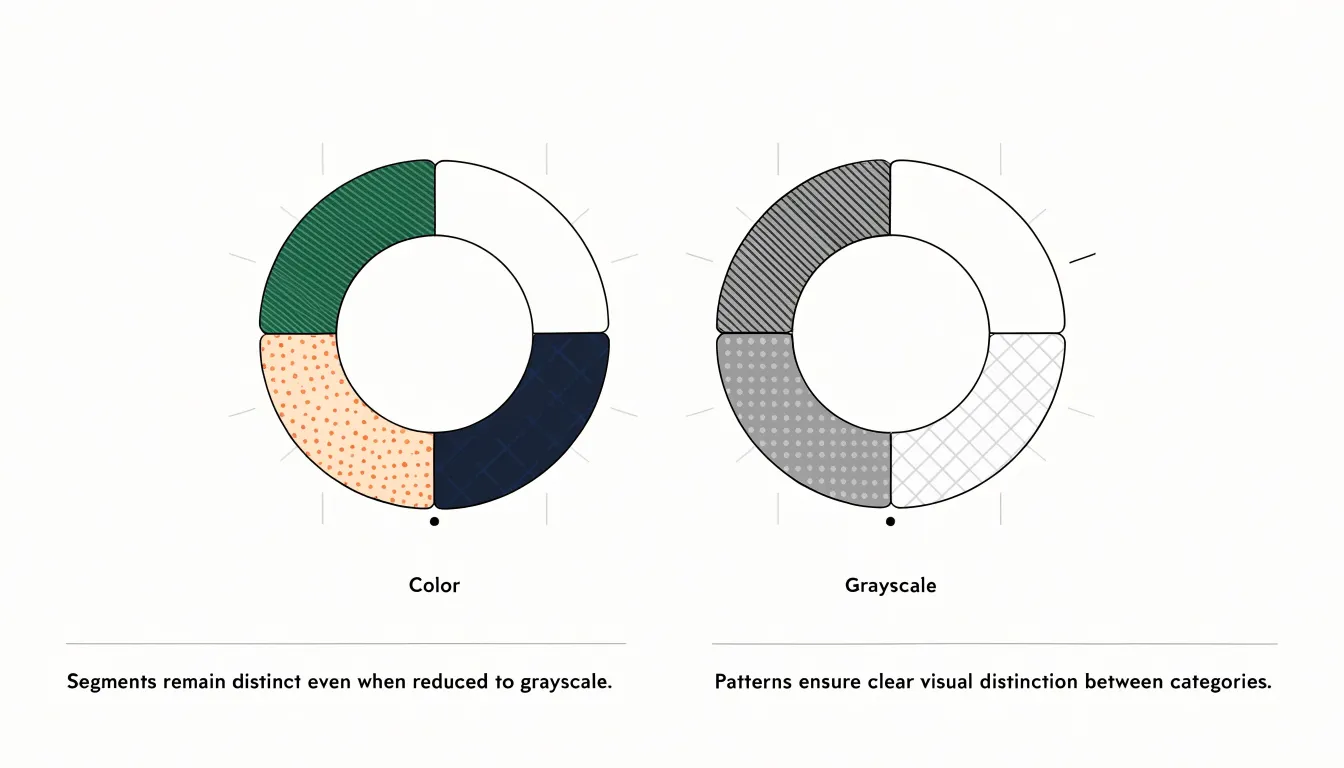
High-contrast palettes ensure that adjacent segments and labels can be told apart by people with low vision, color blindness, or those viewing charts on dimmed screens or in bright outdoor light. Because roughly one in twelve men and one in two hundred women have some form of color vision deficiency, pair strong luminance differences with secondary visual cues rather than relying on hue alone.
Pattern fills—such as diagonal lines, dots, and crosshatching—can distinguish segments even when colors appear similar or disappear entirely in grayscale printing. Patterns work best when they are subtle enough to avoid visual clutter yet distinct enough to be recognized at small sizes. Direct labeling of segments further reduces dependence on color matching.
Screen-reader compatibility requires that chart data exist in a structured, machine-readable form. A donut chart rendered as a flat image offers nothing to assistive technology, so provide an accompanying data table, a descriptive text summary, and appropriate ARIA roles. Alt text should convey the chart’s key message rather than merely announcing that a chart exists. Interactive charts need keyboard navigation and focus states that announce segment values as users move through them.
Text sizing affects every reader. Labels should meet minimum size recommendations, scale with browser zoom settings, and maintain legibility against their backgrounds. Generous spacing between labels prevents overlap when text is enlarged, and responsive layouts should allow labels to reflow rather than shrink.
Interactive Features
Interactive features transform a donut chart from a static illustration into a tool for exploration:
- Tooltips: When a user moves the pointer over a segment, a small floating panel can reveal the category name, exact value, and percentage of the whole. Well-designed tooltips appear close to the cursor, avoid obscuring the hovered segment, dismiss cleanly when the pointer leaves, and remain reachable via keyboard tab focus.
- Segment highlighting on hover: Dimming other segments or slightly expanding the hovered arc draws attention to the relationship between one slice and the rest of the ring, confirming which segment a tooltip describes. A short easing transition keeps the effect from feeling jarring, and a consistent highlight color shows that the emphasized slice corresponds to a single data point.
- Drill-down clicks: Clicking a segment can open a breakdown of its subcategories, filter a companion chart, or navigate to a dedicated report. Each clickable segment should look interactive through cursor changes and hover states, and the drill-down should offer an obvious way back to the parent view.
Mobile Optimization
Small screens impose real constraints on donut charts, starting with the ring itself. Size the chart relative to the viewport rather than fixing pixel dimensions, so the donut shrinks gracefully as available width decreases. A viewBox-driven SVG approach lets the graphic reflow while preserving the inner radius ratio, which keeps the hole large enough that the ring does not collapse into a heavy blob on narrow displays. Reduce stroke width proportionally alongside diameter so segments remain distinguishable without crowding, and consider trimming labels or moving values into a tooltip or center readout when space is tight.
A horizontal legend along the bottom often wraps into several rows on phones, pushing the chart upward or off-screen. Convert the legend into a responsive format: a scrollable horizontal strip, a compact grid, or an interactive list beneath the chart that highlights the corresponding segment on tap. Where categories are numerous, collapsing secondary entries behind a ‘show more’ control keeps the mobile layout clean.
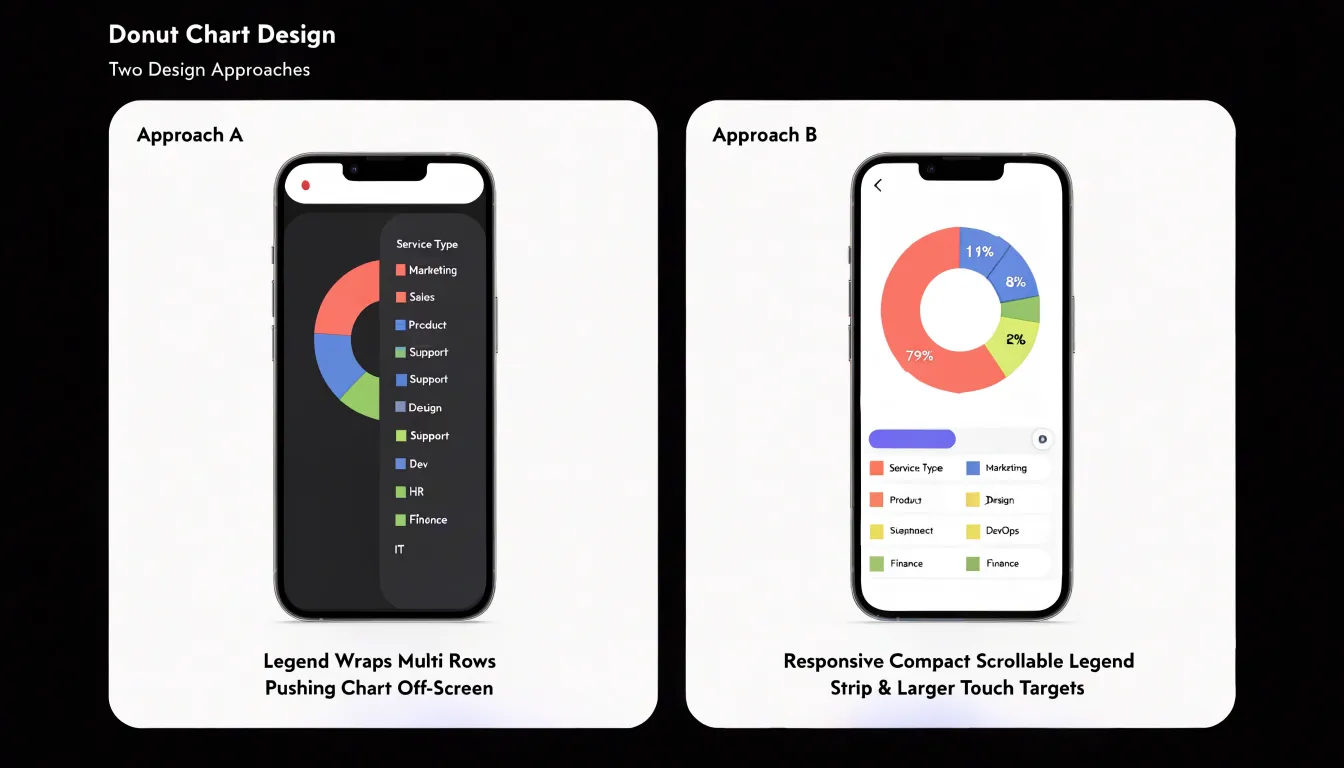
Touch targets also need deliberate adjustments:
- Expand tappable areas on thin segments—which can be only a few millimeters thick—using transparent hit regions or invisible arcs layered over each slice.
- Ensure interactive legend items meet minimum target dimensions, add spacing between them, and provide clear pressed and selected states.
- Trigger tooltips on tap rather than hover, positioned to avoid covering the ring.
- Add padding around the chart container and safe-area insets to prevent accidental edge gestures from interfering with exploration.
Software Tools
Creating a donut chart begins with preparing your data in a simple two-column layout: one column for category labels and another for the corresponding values.
- Excel: Select your data range, navigate to the Insert tab, and choose the doughnut icon within the charts group. Pick from the available ring thickness variants, then right-click any slice and choose Format Data Series to adjust the hole size. You can add data labels, modify the color palette, and set a chart title directly from the ribbon.
- Google Sheets: Highlight your data, click Insert, select Chart, then open the Chart Editor and change the chart type to Doughnut. The customization panel lets you control slice colors, label placement, and the size of the center hole in real time.
- Tableau: Build the ring using two pie charts layered together. Start with a pie chart showing your measure by category, then place a second pie chart of equal size on top using a dual-axis approach, set the inner chart to a white or background fill, and size the outer ring to create the donut effect. Filters and parameters can then make the ring interactive.
- Power BI: Select the native doughnut visual in the visualization pane. Drag your category field into the Legend well and the numeric field into the Values well, then use the Format pane to adjust inner radius, colors, and label options.
Dashboard Examples
- Sales dashboards: In an executive overview where revenue is split across four or five product lines, a donut chart can occupy a compact corner of the screen with total quarterly sales in the center, showing at a glance whether one product line dominates the mix.
- Budget trackers: A ring dividing an annual budget into personnel, operations, marketing, and capital expenses can pair with a second ring or an adjacent progress indicator showing how much of each category has actually been spent as the year progresses, turning the chart into a planning tool rather than a static snapshot.
- Survey and feedback reports: When respondents choose among a small set of answers, such as satisfaction levels or preferred communication channels, placing the total response count in the center gives essential context for the proportions, since a 40 percent share of twenty respondents carries different weight than the same share of two thousand.
Frequently Asked Questions
What is the difference between a donut chart and a pie chart?
A donut chart takes the structure of a pie chart and removes the inner portion, leaving a ring around an open center that can hold a total value or key metric. Donut charts can appear less cluttered with several small segments and suit a single share or progress toward a goal, while pie charts may have a slight edge when there are few segments and precise comparison of similar-sized slices is critical.
How many segments should a donut chart have?
A donut chart works best with two to five segments; once the count climbs past five, the chart begins to lose instant comprehension. If a dataset genuinely contains many categories, consolidate minor categories into an “Other” slice or use a bar chart instead.
What should I put in the center of a donut chart?
The center hole can hold a headline figure such as a total, average, or largest category value, as well as KPI callouts, icons, or interactive elements in dashboards. Keep the center content minimal—one or two elements at most—and avoid adding legends or multiple labels there.
Do donut chart percentages need to add up to 100%?
When a donut chart represents parts of a whole, the segments must add up to 100%. Keep raw values at full precision, round only for display, and if rounded labels total 99% or 101%, reconcile by adjusting the largest segment by a single percentage point; larger differences should be investigated.
How can I make a donut chart accessible?
Use high-contrast palettes and pair strong luminance differences with secondary cues such as patterns or direct labels, because roughly one in twelve men and one in two hundred women have some form of color vision deficiency and relying on hue alone can fail. Also provide a data table, descriptive text summary, ARIA roles, meaningful alt text, keyboard navigation, and readable text sizing.
What is the best order for donut chart slices?
Arrange segment values from largest to smallest and place them sequentially clockwise starting from the 12 o’clock position. Maintaining a consistent sort order across multiple donut charts helps readers track a category’s position and spot shifts in proportion more readily.
Tony Astor
Tony writes about data visualization and the tools people use to build charts and dashboards. More about Data Illustrator