Diverging Bar Chart: Showing Positive and Negative Values
 By Tony Astor ·

Diverging Bar Chart
A diverging bar chart is a chart with a central zero axis from which bars extend in two directions: positive values grow one way and negative values the other, so gains and losses are compared side by side on one shared scale. The zero line anchors magnitude, keeping scale honest and comparisons immediate.
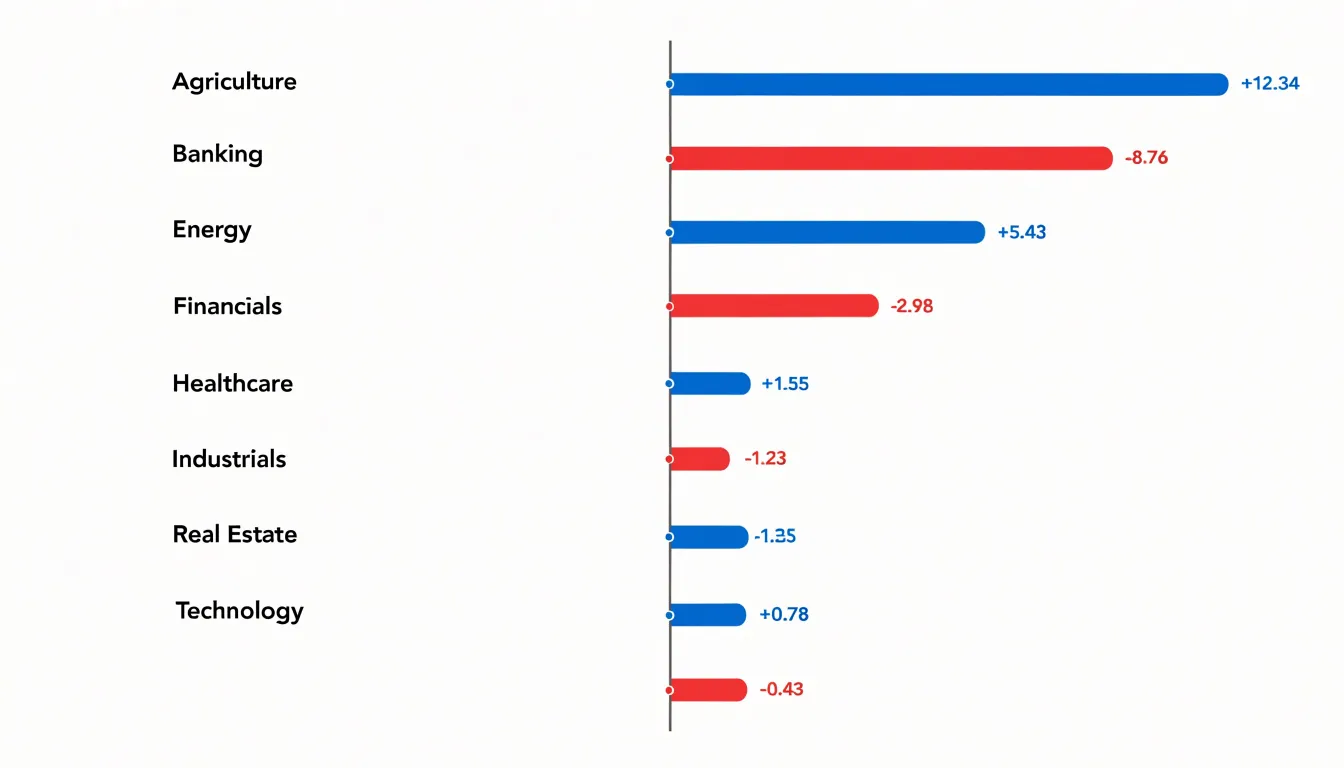
Table of Contents
Diverging Bar Chart
A diverging bar chart places a central axis at zero and extends bars outward in two directions, so every positive value grows in one direction and every negative value grows in the other. This layout turns the center line into a natural dividing point for the eye. Readers can compare a surplus against a deficit, a gain against a loss, or a rise against a decline by looking at which side of the axis each bar occupies and how far it reaches. The contrast is immediate because opposing values sit next to each other along the same baseline, sharing one visual frame rather than being scattered across separate panels.
The central axis also protects against a common misreading of scale. When positive and negative quantities share a single line, the units on both sides are drawn from the same measure, so a bar of equal length on either side represents an equal magnitude. A gain of ten units and a loss of ten units appear as equal-length bars on opposite sides, making the symmetry of the data legible at a glance. This shared scale prevents viewers from overstating or understating differences that arise from mismatched axes. The zero line gives everyone a fixed anchor point, and distance from that anchor communicates magnitude consistently across the chart.
Sorting categories along the central line further strengthens the comparison. Bars arranged from largest positive to largest negative, or grouped by sign, let readers scan the full spectrum of values in one pass. Labels placed at the ends of bars keep the numbers close to the shapes they describe, so the length and the value reinforce each other.
The result is a compact display where positive and negative values are read side-by-side against a common reference, keeping the scale honest and the comparisons clear.
Center Zero Line
Establishing the zero line begins with treating it as a deliberate design element rather than an incidental gridline. Without a well-established center, the bars lose their interpretive power. The line should be visually distinct from other gridlines, often rendered slightly thicker or in a darker tone, so the eye registers it as the anchor of the entire composition. This visual weight signals to readers that the baseline carries special significance and deserves attention before they examine individual bars. Labeling the axis at the zero point reinforces this role, removing any ambiguity about where the neutral threshold sits.
The zero benchmark additionally protects against misreading when values are close to neutral. Small bars near the center line can be difficult to interpret, and an explicit baseline clarifies whether a value represents a modest gain or a modest loss. By anchoring the chart on this neutral reference, the designer gives every bar a clear starting point.
Color Choices
Color choices in a diverging bar chart carry much of the interpretive load, because readers absorb the direction of each bar long before they read a single number. A palette built on cool blues for one side and warm reds or oranges for the other aligns with associations most audiences already hold. Cool tones tend to read as calm, stable, and often positive in financial or performance contexts, while warm tones carry urgency, caution, or loss. Leaning on these ingrained associations lets the chart communicate polarity instantly, without requiring a legend lookup for every bar.
The core requirement is that the two hues remain clearly distinguishable at a glance, even for viewers scanning a printed page or a small screen. Blues and reds sit far apart on the color spectrum, so they stay separable under most viewing conditions. Saturation matters as well; muted or mid-tone shades tend to feel balanced, whereas fully saturated colors can make one direction feel louder than the other and imply a priority that the data does not support.
Consistency across the chart matters as much as the individual hues. Applying one color strictly to positive values and another strictly to negative values, across every bar and every panel, removes ambiguity and lets the reader build a reliable mental map. Where magnitude also needs emphasis, varying lightness within each hue rather than switching hues preserves the signal while showing intensity. A neutral midpoint, often a light gray or white zero line, anchors the two directions and reinforces the sense of divergence.
Baseline Alignment
When the central axis sits at the same horizontal position in every row, the reader can scan down the figure and compare bar lengths directly, trusting that a longer bar genuinely represents a larger value. Offset zero lines break that assumption invisibly, because the eye compares bar tips rather than measuring each bar against its own origin.
The most reliable technique is to fix the axis position in chart configuration rather than letting it float with the data. In most libraries this means setting an explicit domain that spans the maximum absolute value on both sides of zero, so the scale is symmetric and the zero line lands in the same place regardless of whether a row’s values lean positive, negative, or both. Calculating that domain from the full dataset before rendering each row keeps every panel on an identical grid.
Where values are plotted as percentages of different totals, converting each row to a common scale before drawing the bars prevents the axis from drifting. Stacked segments should likewise share one zero point, with left-extending and right-extending portions anchored to the same pixel column. Small multiples and faceted layouts deserve particular attention: each facet must inherit the same domain and axis offset, otherwise a row with smaller values will appear to have a shifted baseline.
Visual cues reinforce correct reading. A single continuous vertical rule through all rows, drawn above the bars or in a neutral tone, gives the eye a fixed anchor to follow downward. Gridlines can be aligned to the same center. Rounding and label placement should never push the axis aside; reserve consistent space for category labels and value annotations on both sides so the rule stays visually centered. Testing the chart with rows of wildly different magnitudes confirms that the axis holds its position, and that no bar appears longer merely because its origin moved.
Stacked Diverging Bars
Stacked diverging bars offer a powerful way to move beyond simple yes-or-no feedback by allowing each bar to carry several layers of information at once. When survey respondents answer Likert scale questions—strongly disagree through strongly agree—their answers can be grouped into negative, neutral, and positive bands, then plotted as segments extending left and right from a shared zero axis. The result is a single chart where every category of feedback is visible simultaneously, and the reader can compare both the overall balance of sentiment and the internal composition of each response group.
Structuring the data correctly is the foundation of this approach. Each survey question or respondent group becomes a row, and within that row the individual response levels are stacked as separate segments. Negative responses accumulate on the left side of the axis, positive responses on the right, and neutral responses can sit at the center or be split between both sides depending on the design. Consistent color assignment across every row lets a viewer track the same segment type from top to bottom without re-reading the legend.
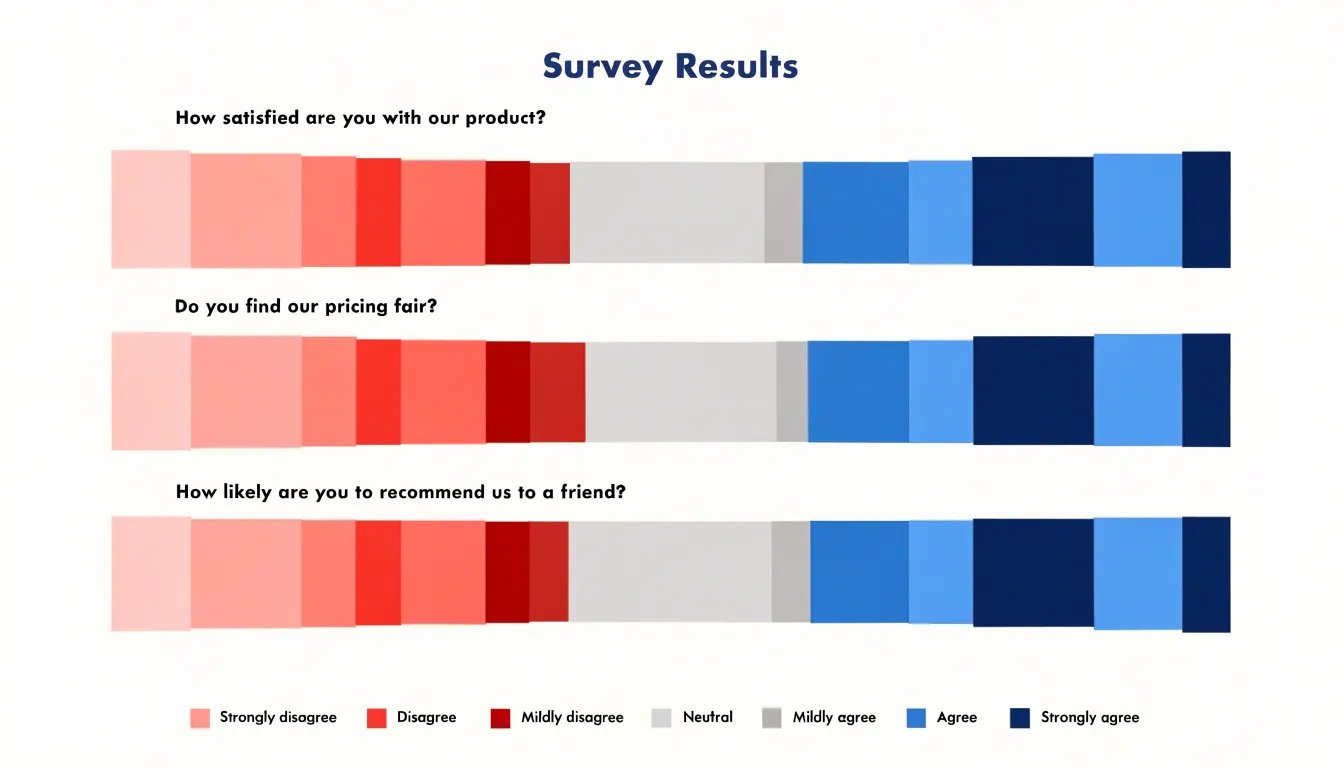
Stacking adds a second dimension of insight beyond overall directional lean: within a single bar, a category might show a broad spread of mild agreement rather than a concentrated block of strong agreement, and the segmented structure makes that distinction visible. This supports multi-tiered survey analysis, where understanding the intensity of sentiment matters as much as its direction.
For more complex instruments, such as questions with five or seven response levels, stacked diverging bars preserve the granularity of each level while still producing an at-a-glance summary of group-level attitudes.
Simple Two-Sided Bars
Simple two-sided bars form the backbone of clear executive reporting. In this layout, each category occupies a single row, with one bar extending left and another extending right from the central baseline. Because every row shares the same axis and visual grammar, scanning across dozens of categories becomes effortless. A viewer can sweep down the chart and instantly identify which items lean left, which lean right, and where the extremes cluster.
Keeping the layout unstacked is central to this readability. When segments are layered within each bar, the viewer must decode color keys, estimate partial lengths, and hold several quantities in mind at once. A single respondent value per side removes that cognitive load. Each bar answers one question: how large is this quantity in this direction? The result is a chart that communicates in seconds, which suits briefing materials where decision-makers need the headline pattern rather than a granular breakdown.
Streamlined formatting reinforces the effect. A thin central axis, consistent bar thickness, and restrained color use let the data shapes speak for themselves. A compact category column on the far left keeps the eye moving horizontally without detours. Gridlines, when present, should be faint and evenly spaced so they guide length judgments without competing with the bars.
In executive summaries, this simplicity translates directly into speed. A clean two-sided layout supports quick triage: which divisions are ahead, which are behind, and how wide the gaps are. When the message must land in a glance, the unstacked two-sided bar delivers clarity that more elaborate designs often dilute.
Label Formatting
Placing value labels directly on the chart, rather than relying on axis ticks, eliminates the need for readers to trace back to an axis and allows for immediate side-by-side comparison. The key decision is whether to position labels outside or inside the bar ends.
Outside labels sit just beyond the tip of each bar, in the whitespace of the chart area. This placement keeps the label clear of the bar’s fill color, ensuring high contrast and legibility regardless of bar length. For negative bars extending to the left, the label appears to the left of the bar end, mirroring the positive side. However, outside labels require sufficient margin space; if bars are long, labels may collide with the chart edges or with labels from adjacent categories.
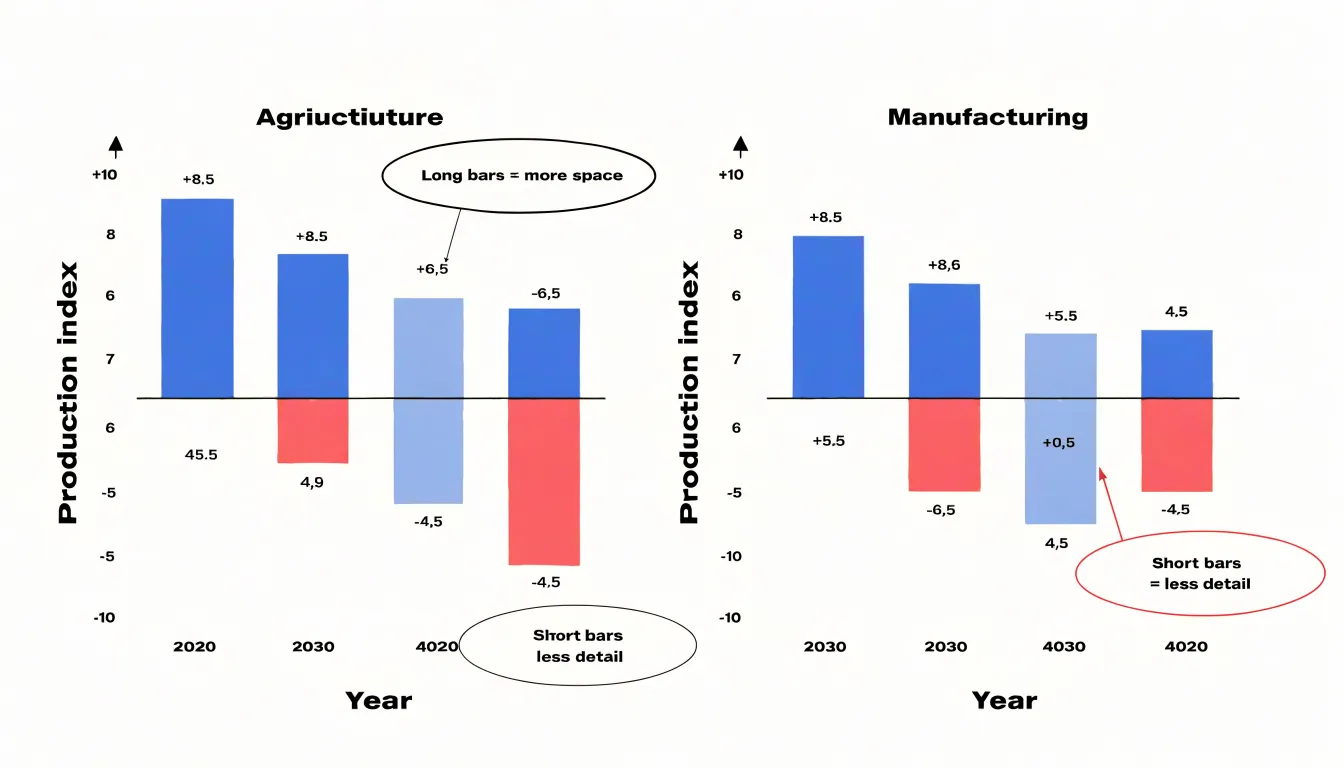
In such cases, inside labels—placed just within the bar end—can be a better choice. Inside labels use the bar itself as a background, which works well when the bar fill is light or when the label color contrasts strongly. The risk is that short bars may not have enough room for the label, leading to truncation or overlap with the baseline. A common solution is to use outside labels for short bars and inside labels for long bars, with a consistent rule to avoid confusion.
Regardless of placement, labels should be aligned horizontally (for horizontal bars) or vertically (for vertical bars) and positioned at a consistent offset from the bar end. Font size should be small enough to avoid clutter but large enough to read without zooming.
Bar Sorting
When rows are ordered systematically—typically from the largest positive value at the top to the largest negative value at the bottom—the chart produces a smooth, cascading waterfall effect. This arrangement guides the viewer’s eye naturally from the most substantial positive contribution down through smaller positive values, across the zero baseline, and into progressively larger negative values. The result is a visually intuitive gradient that makes the distribution of values immediately apparent.
By placing extreme values at the ends of the sorted sequence, the chart draws attention to the most significant data points. The largest positive bar stands out prominently at the top, while the largest negative bar anchors the bottom, creating clear visual bookends. This structure allows viewers to quickly grasp the range and skew of the data without needing to scrutinize each individual bar.
Moreover, sorting facilitates comparisons across categories. When bars are ordered by magnitude, patterns such as clusters of similar values or gaps between groups become evident. Viewers can easily identify where the data transitions from positive to negative and observe the relative frequency of values in different ranges. This orderly progression reduces cognitive load, as the brain can process the gradual changes in bar length more efficiently than a random arrangement.
In practice, sorting from largest positive to largest negative is straightforward to implement in most charting tools. The key is to define a consistent sorting rule based on the signed values, ensuring that positive values are ranked in descending order and negative values in ascending order (i.e., from least negative to most negative). This approach maintains the waterfall effect while preserving the integrity of the diverging structure.
Common Mistakes
When readers scan a diverging bar chart, they rely on the visual geometry to compare magnitudes quickly. Uneven axis increments break this contract. If the tick marks on the positive side advance in steps of five while the negative side jumps by tens, a bar that appears twice as long may represent four times the value. Viewers rarely stop to read every label; they judge by relative length. Keep increments uniform across both directions, and confirm that the scale on the left mirrors the scale on the right. A symmetric axis with evenly spaced ticks lets the visual comparison match the numeric comparison.
Inconsistent bar padding creates a similar distortion. When the gap between bars varies, or when a bar’s thickness changes from one row to the next, the eye reads the irregular spacing as meaningful variation. Bars of equal value should share identical thickness, and the space between them should remain constant along the entire chart. Padding that drifts draws attention to the wrong rows and makes the chart feel unstable, which undermines trust in the data.
Misleading zero offsets are perhaps the most serious issue. If one side starts at a non-zero value, or if the central axis is shifted, bars on one side will look disproportionately short or long. Choose a zero point that reflects the data honestly, and use the same reference line for every category. When negative and positive values coexist, the center should represent zero unless a clearly labeled alternative justifies itself.
Each of these flaws compounds the others. Even increments, constant padding, and an honest zero point keep the focus on the data rather than on the mechanics of the drawing.
Accessible Design
Accessible design begins with the recognition that a meaningful share of any audience perceives color differently. Roughly one in twelve men and one in two hundred women experience some form of color vision deficiency, which means red-green distinctions, and to a lesser extent blue-yellow distinctions, can collapse into near-identical tones. When opposing hues are chosen without care, the chart’s central message disappears for part of the readership. The practical remedy is to select opposing colors that differ in lightness as well as hue, so the bars remain distinguishable even when chromatic differences fade. Palettes built around blue and orange, or purple and gold, tend to hold up well because their luminance values sit far apart.
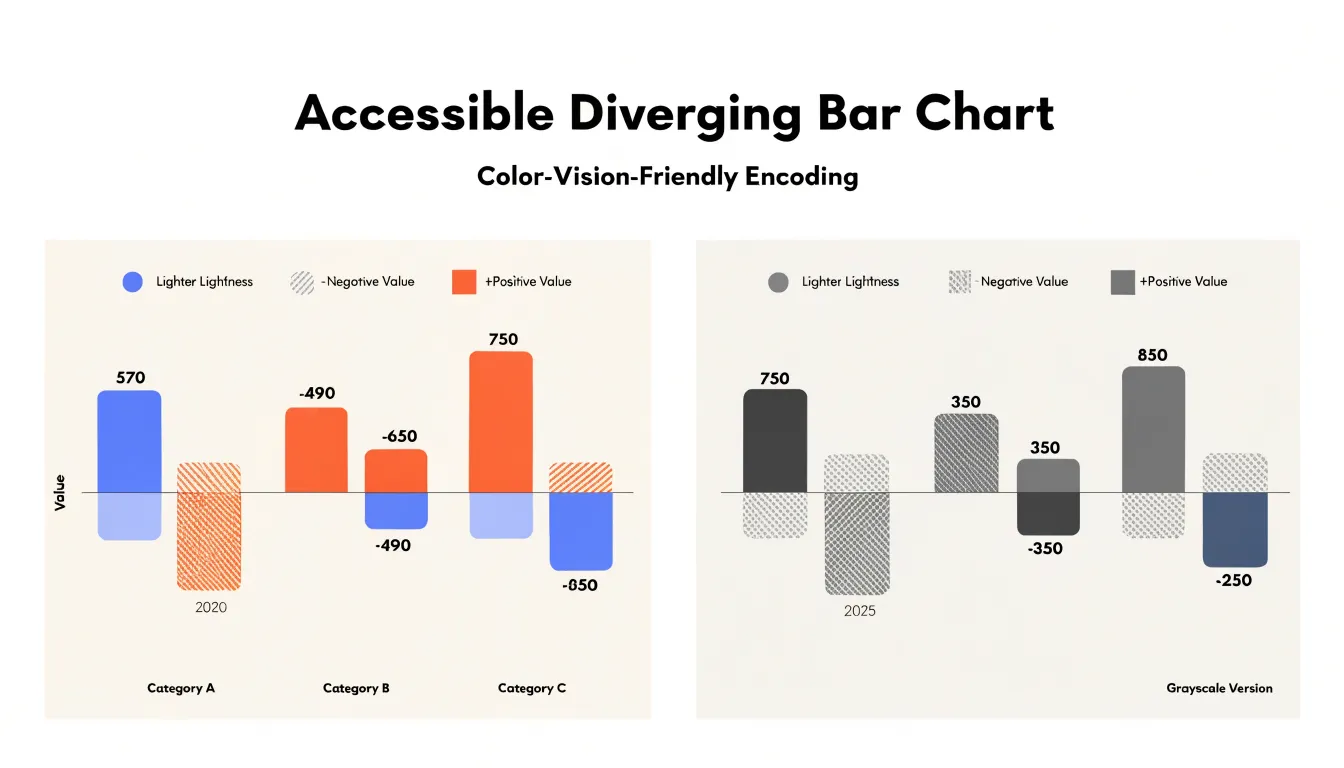
Color alone should never carry the encoding. Texture fills offer a second channel: solid fills for one side of the divergence and hatched, dotted, or cross-hatched patterns for the other. These patterns remain visible in grayscale printing and on monochrome screens, and they give readers a reliable cue independent of hue. Pattern density should stay modest so the bars do not become visually noisy, and the fill styles should be documented in the legend.
Text elements deserve equal attention. Axis labels, data labels, and legend entries need strong contrast against their backgrounds, with a contrast ratio of at least 4.5:1 for normal-sized text and 3:1 for large text, consistent with WCAG 2.1 success criteria. Font sizes should remain legible at typical viewing distances, and labels should avoid placing text directly over busy fills without a backing shape or outline. Gridlines and axis rules should be light enough to recede but dark enough to perceive. Testing the finished chart with a grayscale filter and a colorblind simulation tool catches problems early, and these checks take only minutes while protecting the chart’s usefulness for every reader.
Software Options
Creating a diverging bar chart in Excel begins with structuring your data so that positive and negative values occupy separate columns. A common approach is to place categories in the first column, then use a helper column for the negative values and another for the positive values. Adding data labels, adjusting gap width, and removing gridlines polish the result into a readable diverging visualization. For quick work, Excel’s built-in conditional formatting data bars can also produce a diverging effect when the axis midpoint is set to zero in the formatting rules.
Google Sheets follows a similar logic, though its chart editor handles some steps differently. After preparing the same helper columns with IF formulas, select the data and choose Insert, then Chart, and pick the stacked bar chart type. In the Customize panel, open the Series section to assign separate colors for negative and positive values, and use the Horizontal axis settings to position the zero baseline correctly. Google Sheets also supports SPARKLINE-based approaches and conditional formatting bars with a custom midpoint, which work well for compact dashboards.
Both tools reward a consistent workflow: split the data, stack the series, color them distinctly, and label clearly. Mastering these steps lets analysts build diverging bar charts directly in familiar spreadsheet environments without specialized charting software.
Interactive Features
Interactive hover effects give readers a way to explore underlying detail without cluttering the primary view. When a reader moves the pointer over a bar segment, a tooltip can surface the precise values that the bars represent: the exact magnitude on each side of the diverging axis, the computed difference between them, and any labels or metadata attached to that category. Because this information appears only on demand, the chart itself stays clean while still supporting deeper exploration. Tooltips can also be positioned dynamically so they follow the cursor and remain within the visible area, and they can be styled to match the chart’s visual language so the experience feels cohesive rather than bolted on.
Hover states extend this idea further by providing immediate visual feedback: a highlighted bar, a subtle change in fill opacity, or a dimming of unrelated marks that helps the reader isolate the element under inspection. This kind of emphasis is especially valuable in a diverging chart, where a single row may contain several segments that are easy to confuse.
Dynamic filtering complements these techniques by letting readers narrow the data set on the fly, for example by selecting a subset of categories or toggling specific series so that only the relevant marks remain. The underlying data updates in response, and the tooltip and hover treatments adjust accordingly, giving the reader a guided path from the overview into the specifics. Together, tooltips, hover states, and filtering transform a static graphic into an exploratory instrument.
Mobile Layouts
Mobile layouts for diverging bar charts require thoughtful adjustments so the data remains legible on smaller screens. One of the most effective strategies is vertical stacking, where bars that run horizontally on a desktop view are reoriented so categories stack from top to bottom. This approach takes advantage of the tall, narrow aspect ratio of handheld devices, giving each category more breathing room and reducing the need for horizontal scrolling.
Font scaling is another key consideration. Labels, axis ticks, and annotations that read comfortably on a large monitor can become cramped or vanish entirely on a phone. Responsive typography lets text sizes adapt to the viewport, keeping category names and values readable without overwhelming the chart area.
Simplified axes support this same goal. On mobile, it often makes sense to reduce the number of tick marks, drop redundant gridlines, and shorten or abbreviate long category labels so the chart stays clean and focused. Interactive touches such as tap-to-reveal tooltips can carry the detail that simplification removes from the static view, keeping the chart accurate and easy to explore on any screen size.
Dashboard Overview
When a diverging bar chart is integrated into a business dashboard, viewers can scan a panel and immediately grasp which categories sit above or below a threshold, such as a target, a previous period, or a zero benchmark. A clearly labeled centerline establishes what the split represents, whether that is zero change, budget parity, or a neutral score. When annotations identify notably large divergences, the dashboard communicates where the organization is gaining or losing ground.
Well-executed diverging charts shorten the path from data to insight. A sales dashboard that shows regional performance relative to quota reveals overperforming and underperforming territories within seconds. Similarly, a survey panel that tracks satisfaction changes between two periods highlights the areas where sentiment is improving or eroding. Executives can move past basic data retrieval and spend their time discussing responses, resource allocation, or strategic adjustments.
Strategic decision-making benefits when a dashboard pairs diverging charts with contextual filters and linked detail views. Users can drill into a specific segment, compare periods, and observe how the balance of positive and negative movement shifts. This interactive layer encourages evidence-based conversations in meetings and supports consistent follow-through on the changes the data suggests.
Frequently Asked Questions
What is a diverging bar chart used for?
A diverging bar chart places a central axis at zero and extends bars outward in two directions, so positive values grow one way and negative values the other. It is used to compare a surplus against a deficit, a gain against a loss, or a rise against a decline along the same baseline.
How should I set up the center zero line?
Treat the zero line as a deliberate design element: make it visually distinct from other gridlines, often slightly thicker or darker, and label the axis at zero. This gives every bar a clear anchor and helps clarify whether small bars represent a modest gain or a modest loss.
What colors should I use for a diverging bar chart?
A palette with cool blues for one side and warm reds or oranges for the other aligns with common associations, and the two hues should remain clearly distinguishable. Apply one color strictly to positive values and the other strictly to negative values, using a neutral midpoint such as a light gray or white zero line.
How can I make a diverging bar chart accessible for colorblind readers?
Choose opposing colors that differ in lightness as well as hue—blue and orange or purple and gold tend to hold up well—and do not let color alone carry the encoding. Use texture fills such as solid vs. hatched or dotted patterns, keep text contrast at least 4.5:1 for normal-sized text and 3:1 for large text, and test with grayscale and colorblind simulation tools.
Where should value labels go on a diverging bar chart?
Outside labels sit just beyond the bar tip in whitespace for high contrast, but can collide when bars are long; inside labels sit just within the bar end and work when the fill is light or label color contrasts strongly. A common solution is to use outside labels for short bars and inside labels for long bars, with a consistent rule.
How do I create a diverging bar chart in Excel?
Split positive and negative values into separate columns using formulas of your choice, then insert a stacked bar chart. Format the negative and positive series with distinct colors, set the axis so zero sits in the middle, and add data labels, adjust gap width, and remove gridlines as needed.
Tony Astor
Tony writes about data visualization and the tools people use to build charts and dashboards. More about Data Illustrator