Datawrapper vs Flourish for Charts and Interactive Visuals
 By Tony Astor ·
Datawrapper vs Flourish for Charts and Interactive Visuals
Datawrapper is best for fast, publication-ready standard charts with automatic mobile reflow, built-in accessibility checks, and print-ready PDF/SVG exports, while Flourish suits animated, interactive, and story-driven visuals such as racing bars, scrollytelling, and 3D maps. Datawrapper favors speed and consistency; Flourish favors customization and motion.
Table of Contents
Chart Types
Datawrapper’s chart library centers on a focused set of clean, standard formats that cover the most common editorial and reporting needs. Writers and editors will find bar and column charts, line and area charts, pie and donut charts, scatter plots, dot plots, and simple locator maps. Each chart type is built with a strong emphasis on readability, sensible default typography, and straightforward labeling, so a finished graphic looks polished without manual styling. The library stays deliberately compact, which keeps the interface easy to learn and makes it quick to move from pasted data to an embeddable chart. For routine data stories such as election results, survey breakdowns, or trend lines, this standard set handles the job efficiently.
Flourish takes a different approach by offering a much broader catalog of visualization templates, many of which emphasize motion and complexity. Users can build racing bar charts that animate rankings over time, network diagrams that map relationships between entities, and story-driven scrollytelling layouts. The platform also includes animated Sankey diagrams, chord diagrams, marimekko charts, and a range of map styles alongside its standard chart types. This breadth gives visual journalists and designers room to choose a format shaped around the narrative rather than fitting the story into a basic template. Animated racing bars work well for showing how rankings shift across years, while network diagrams suit relationship-heavy topics like organizational ties or trade flows.
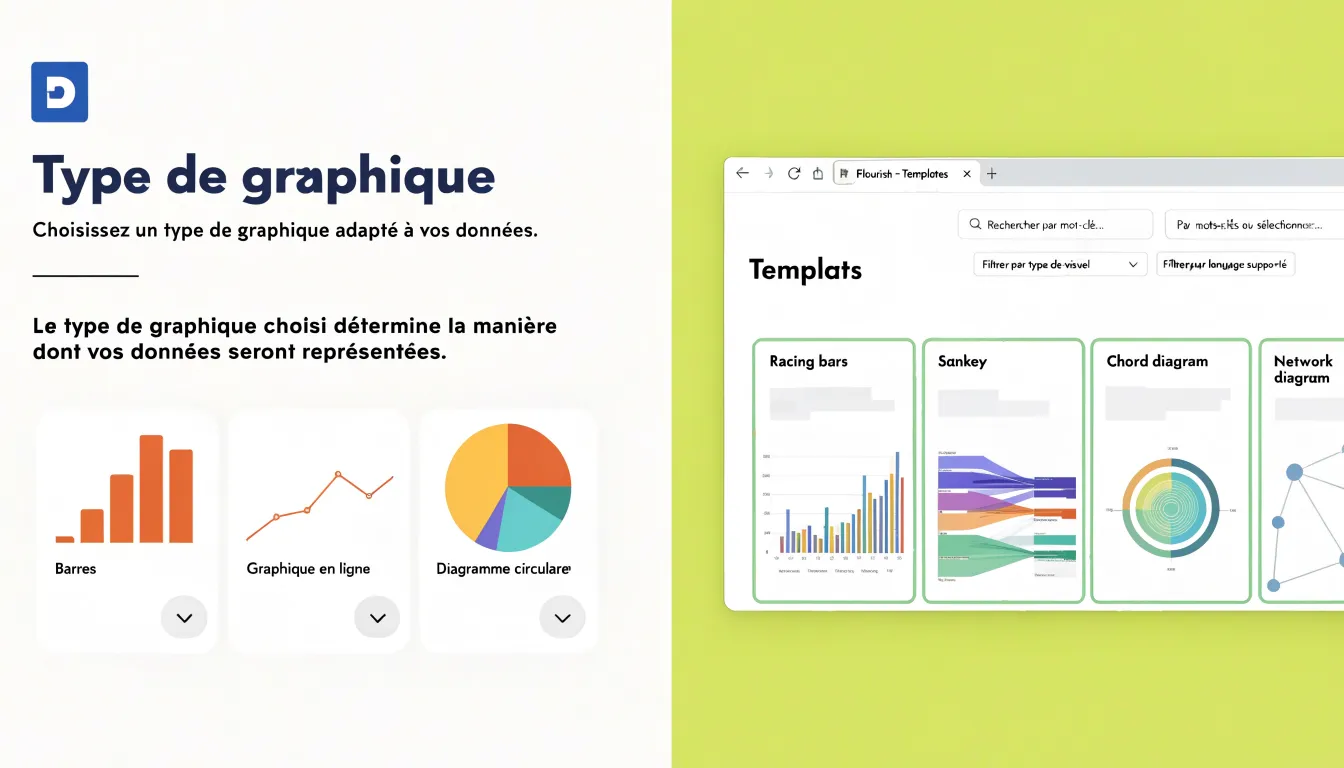
The practical difference lies in scope. Datawrapper’s library favors consistency and speed across familiar chart forms, while Flourish’s catalog leans toward visual variety and motion, offering many templates that go beyond conventional graphs. Teams producing a steady stream of standard graphics will find everything they need in Datawrapper’s focused set, and teams chasing more elaborate animated or relational visuals will find a far wider menu of options in Flourish.
Ease of Use
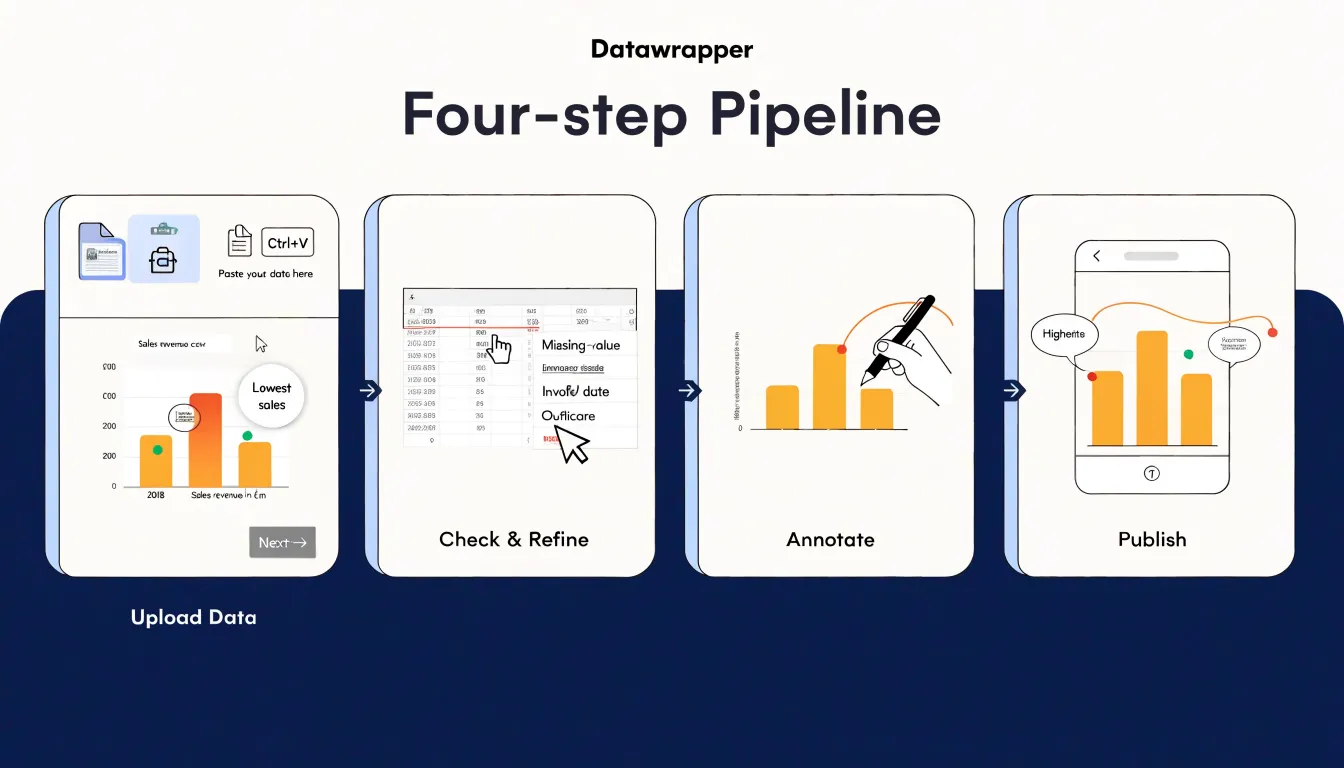
When you open Datawrapper for the first time, the platform guides you through a linear four-step pipeline: upload your data, check and refine the chart, annotate it, and publish. Each step occupies its own screen with a clear forward button, so there is little ambiguity about what comes next. The upload screen accepts pasted spreadsheets or CSV files and attempts to detect column types automatically, which means a simple bar or line chart can often be generated within a minute or two of starting. Annotation tools sit in the same flow rather than in a separate settings panel, letting a first-time user add a title, subtitle, and source line without leaving the main workspace. For newsrooms and communications teams working against a deadline, this linear structure shortens the path from raw numbers to a publishable embed.
Flourish takes a template-driven approach. On opening the tool, you choose from a gallery of chart and story templates, and each template carries its own configuration panels for data binding, colors, labels, and animation settings. This structure offers considerable flexibility once you understand it, yet the initial setup asks more of a new user. You need to identify the right template for your data shape, map columns to the template’s expected fields, and work through several settings tabs before the first preview looks presentation-ready. A simple chart that takes a couple of minutes in Datawrapper may take somewhat longer in Flourish while you learn where each control lives.
The practical difference shows up in time-to-first-chart. Datawrapper’s constrained pipeline reduces decision points, which suits quick turnarounds and users who publish charts occasionally. Flourish rewards a short learning investment with its broader template library, and its interface becomes quick once the mapping conventions are familiar. For a team’s very first session, Datawrapper generally gets a finished chart on screen faster.
Customization
Datawrapper approaches customization from the perspective of editorial polish: its defaults are already tuned for publication, with a restrained color palette, sensible typography, and clean chart layouts that look professional the moment data is dropped in. Adjusting colors, fonts, and layouts is straightforward, typically handled through a neat sidebar of preset options and simple pickers. Users can recolor a series, switch to a brand palette, change the typeface, or reposition labels and legends without digging into code. The trade-off is a bounded set of choices: the tool strongly guides you toward layouts and styles it considers well-designed, which keeps output consistent and reduces the risk of visual missteps, particularly for teams with many contributors producing charts at pace.
Flourish treats customization as an open-ended design surface. Beneath its polished templates sit granular controls for almost every visual element: axis styling, margins, gridlines, label placement, animation timing, and typography at a level of detail that reaches down to individual chart components. For teams with specific brand guidelines or unusual layout requirements, this depth is valuable, since the chart can be shaped closely around a visual identity rather than fitted into a template’s constraints. Flourish also exposes custom CSS overrides, so developers can step beyond the graphical interface and adjust selectors directly, refine spacing, or add bespoke styling that the built-in panels do not cover. That capability suits design-led projects and outlets with in-house web teams, and it rewards experimentation with fine-tuned results. The trade-off runs in the opposite direction from Datawrapper: flexibility brings more decisions, and achieving a polished default look can take more effort. In practice, the choice comes down to how much control a team wants over each chart and how much time it can devote to shaping it.
Interactive Features
Flourish builds a substantial toolkit around hover effects, maps, and animations. Hover interactions extend well beyond simple value reveals: charts can respond to a cursor with pop-up panels containing images, long-form annotations, or linked metrics, and map hover states can highlight regions, surface neighborhood-level statistics, or trigger contextual labels. Animated transitions receive equal attention. Flourish supports time-based playback controls that move a dataset through a sequence of dates while autoplaying on load, letting a line chart trace movement or a bar chart race reorder categories in real time. Scrollytelling templates tie these animations to scroll position, so the visualization evolves as the reader advances through the narrative. Flourish also handles transitions between chart states, such as switching from a map view to a bar view within a single embed, keeping the reader oriented inside one continuous story.
Datawrapper takes a more restrained approach and treats interactivity as a functional layer serving the data. The tooltip is the primary vehicle: hovering a data point brings up a configured readout showing values, labels, and optional highlights, and the layout stays stable so the chart never shifts under the cursor. Hover states on bars, lines, and map regions apply subtle emphasis through dimming or slight highlighting, which helps readers track a series without distracting from the primary message. Datawrapper maps support hover tooltips for regional values and clickable markers with short popups. Animation appears in modest form, mainly as entry transitions and simple timers on select chart types.
For narrative-driven experiences where motion and layered interaction carry the story, Flourish offers the richer set of features; for fast, legible publication charts, Datawrapper’s focused interactions keep the readers’ attention on the numbers.
Map Building
Mapping geographic data has become an accessible entry point for teams who want to add visual context to a story without writing a line of code. Both Datawrapper and Flourish approach this task with distinct strengths that suit different editorial and presentation needs.
Datawrapper’s mapping tools are built around the workflows of newsroom cartography. Its locator maps let you plot points, markers, and annotated locations on a clean basemap, while choropleth maps shade regions according to the values in your dataset. Upload a spreadsheet of countries or postal codes and the tool matches your rows to geographic boundaries automatically, flagging any entries it cannot place so you can correct them before publishing. The output favors clarity and fast reading, with restrained color palettes, sensible legends, and responsive rendering that holds up on mobile. For journalists who need a trustworthy map published within an hour, this pipeline is hard to beat.
Flourish takes the same foundation and pushes toward richer visual experiences. Its projection maps display data across a globe or a flattened world view, letting you rotate, zoom, and animate between points or time periods. Region fills on interactive maps can respond to hover and click, revealing figures, labels, or short descriptions tied to each area. These features make Flourish a strong fit for presentations, embedded storytelling pieces, and dashboards where exploration is part of the appeal.
If the goal is a precise, quickly produced geographic chart that prioritizes legibility, Datawrapper’s mapping module delivers that with minimal friction. If the goal is a visual centerpiece that invites readers to explore geography in three dimensions or through interactive region fills, Flourish offers the expressive range to build it.
Data Input
Both Datawrapper and Flourish are built to accept the data formats teams already use, with CSV and Excel uploads sitting at the center of the workflow. Datawrapper reads pasted data, uploaded CSV and XLSX files, and tables copied directly from a spreadsheet, then runs an automatic check for common issues such as mismatched column counts, text in numeric fields, or inconsistent date formats. Flourish follows a similar pattern: users upload a CSV or XLSX file or paste values into a grid, and the platform maps columns to chart roles through a point-and-click interface. In both tools, the upload step includes a preview so mismatches between the file and the chart template become visible before publishing.
Google Sheets provides the most convenient route for teams that update numbers regularly. Datawrapper can connect a chart to a published Google Sheet and refresh the chart’s data on demand, while Flourish offers a live link to Google Sheets that pulls in changes each time the visual loads or is republished. This distinction matters for newsrooms and marketing teams publishing on a fixed schedule, since the connection determines how much of the refresh process stays manual.
External database connections extend the same logic to larger and more dynamic datasets. Datawrapper provides an API for pushing data programmatically, which supports automated pipelines that refresh charts as underlying records change. Flourish offers API access as well, along with connectors that let teams feed live data into templates designed for real-time displays such as polls, live blogs, and dashboards. For organizations with a data warehouse, both platforms can sit at the end of an automated pipeline, receiving scheduled updates without anyone re-uploading a file.
Embedding
Both tools give you a reliable path from a finished visualization to a live chart on your site. Datawrapper leans on a clean iframe embed: you copy a snippet, paste it into your CMS, and the chart appears with its dimensions locked to the container you specify. The iframe approach isolates the chart’s styles and scripts from the rest of your page, which keeps layouts stable inside systems like WordPress, Squarespace, or a custom CMS. Datawrapper’s embeds also include a responsive resizing behavior that adjusts the chart to the width of its parent element, so a graphic placed in a narrow sidebar and the same graphic in a full-width article both render correctly. Options for automatic height adjustments help when labels or legends change length.
Flourish offers iframe embedding as well, along with a responsive script tag that injects the visualization directly into the page. The script option can let the chart adjust height dynamically, which suits stories where the visual sits inline with text and should flow naturally. Flourish publishes its embed codes with sizing controls, and its responsive mode handles mobile widths without requiring manual duplication. Because the script tag loads the chart from Flourish’s servers, platform updates and accessibility fixes arrive without re-embedding anything.
Across CMS platforms, the practical difference shows up in how each embed handles editors that strip scripts or restrict iframes. WordPress users on managed hosts often need to allow the Datawrapper or Flourish domains before previews render, while Squarespace and Webflow accept iframes more readily. Both tools provide preview modes and shareable links to test a chart before publishing, and both maintain HTTPS assets so mixed-content warnings stay out of the way.
Mobile Responsiveness
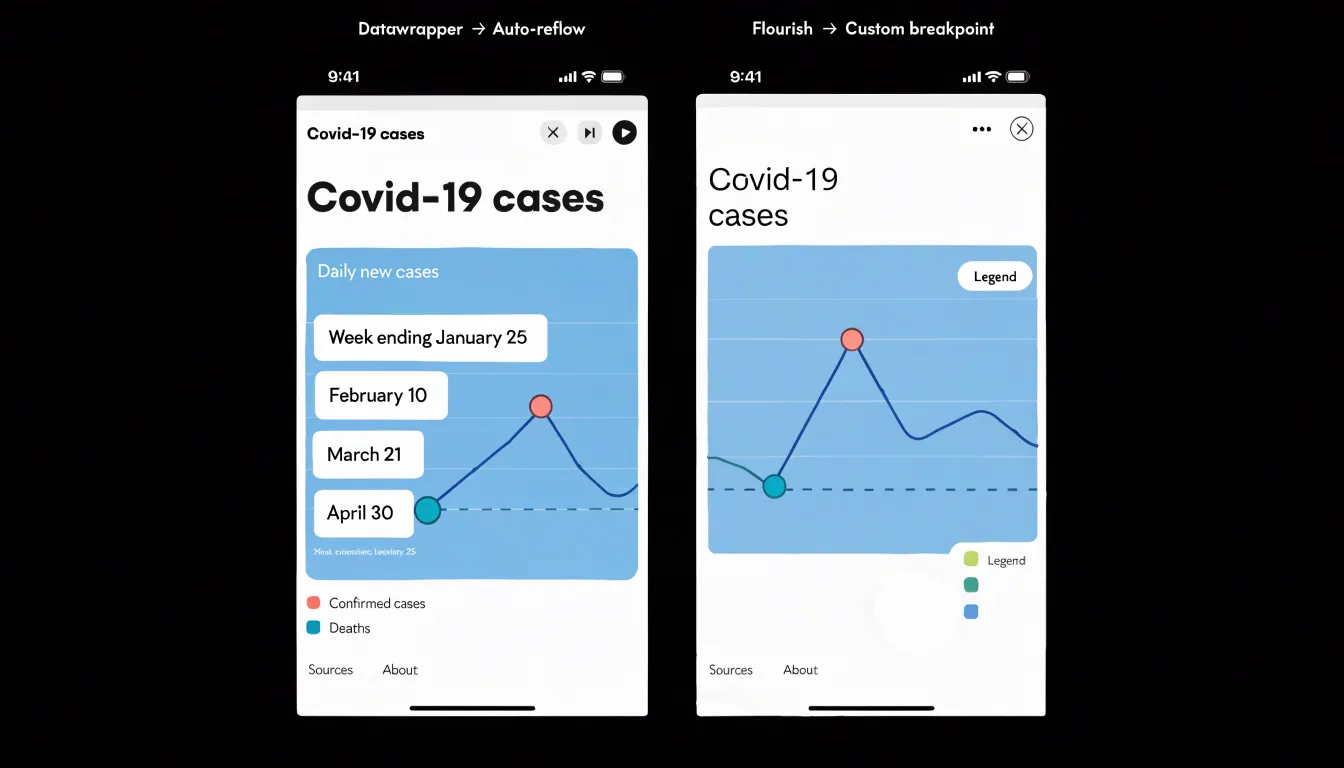
Because a large share of readers encounter online visualizations on phones rather than desktop monitors, mobile responsiveness is a core requirement. Datawrapper approaches this challenge by reflowing charts automatically: when a visualization loads on a narrow viewport, titles resize, axis labels thin out, legends reposition, and annotation callouts shift to remain legible without manual intervention. The platform treats the mobile version as a first-class output rather than an afterthought, which means a journalist can publish once and trust that the chart will hold together across screen sizes. For editors working under deadline pressure, this default behavior removes an entire layer of testing and adjustment from the production workflow.
Flourish offers viewport scaling options and a set of custom layout tweaks that give the author more direct control over how a visualization behaves at different breakpoints. Users can define how a story or chart scales within its container, adjust sizing behavior for embedded contexts, and fine-tune layouts so that specific elements respond in specific ways. This flexibility suits projects with unusual compositions, such as scrollytelling pieces or full-bleed visual stories where standard reflow logic would not produce the intended result. The tradeoff is that more of the responsive behavior depends on the author’s choices, so teams need to preview output on actual devices and confirm that text, touch targets, and interactive controls remain usable on small screens.
In practice, both platforms produce mobile-ready output, and the distinction comes down to workflow philosophy. Datawrapper front-loads responsive decisions into sensible defaults, saving time for organizations publishing frequent, straightforward charts. Flourish exposes knobs for teams building bespoke interactive features who want to shape the mobile experience themselves.
Brand Consistency
Brand consistency across a team’s published visuals depends heavily on how each platform handles templates and custom themes. Datawrapper allows users to define a custom theme that stores brand colors, fonts, and a logo in one place, so every new chart inherits those settings automatically. Teams can build multiple themes for different brands or publications and switch between them per project, while individual charts can also override a theme when a one-off exception is needed. Typography is managed through curated font lists and custom font uploads on higher tiers, and logos can be positioned with control over placement and sizing. Enterprise plans extend this by letting administrators set a default theme for the whole team, restrict member-created themes, and lock certain styling options so charts leaving the organization consistently match corporate design guidelines.
Flourish takes a template-driven approach with its custom themes and brand settings, which can predefine colors, fonts, and annotations for chart and story templates. Account holders can create a branded theme that applies to every visual built from those templates, and teams can share themes so members produce matching outputs. Enterprise-level controls add workspace-wide defaults, shared asset libraries for logos, and permissions that limit who can edit template styling. For organizations managing many contributors, the practical difference lies in how granular the enforcement is: Datawrapper leans toward per-chart theming with admin-level locking, while Flourish leans toward template scaffolding that guides contributors through a fixed visual structure. Both route brand fonts and colors through centralized settings, which removes the need for each author to remember hex codes or font names. Mapping these capabilities against internal brand governance requirements helps teams decide which platform keeps published visuals closest to their design system with the least manual oversight.
Team Collaboration
Both platforms offer shared workspace folders that let newsrooms and agencies organize visual projects by beat, client, or campaign, keeping related charts together and making them easy to locate later. Editors can browse a colleague’s folder without requesting individual file links, which streamlines review and handoff during tight publishing cycles. User permission management is another shared strength. Both tools allow administrators to assign roles with different levels of access, so freelancers or junior staff can draft visuals while senior editors retain control over publishing and final sign-off. This separation of drafting and publishing rights supports editorial accountability without slowing down production.
Multi-user workflow features round out the collaboration story on both platforms. Teams can share reusable templates, maintain consistent styling across projects, and comment on work in progress so feedback stays attached to the visual it concerns. For agencies juggling multiple clients, separate workspaces keep deliverables organized and prevent accidental cross-client sharing. Datawrapper and Flourish each handle these collaboration needs with their own interface conventions, and the choice often comes down to how closely the tools match existing editorial processes. Newsrooms with frequent live coverage may prioritize fast folder sharing and quick permission adjustments, while agencies may value clear workspace separation and template reuse across client accounts.
Export Formats
Export Formats — Downloading Images, PDFs, and Code
Datawrapper’s export options stand out for anyone who needs to move a finished chart into print, a slide deck, or a web project. From the publish screen, you can download a high-resolution PNG suitable for Retina displays and print layouts, an SVG file that stays sharp at any scale, or a vector PDF designed specifically for print workflows. That PDF export is where Datawrapper pulls ahead. It produces a print-ready document with properly embedded vector elements, so the chart remains crisp when scaled up on a poster, placed in a magazine layout, or run through a professional print pipeline. You also get control over the export dimensions, letting you match the aspect ratio and size your publication requires.
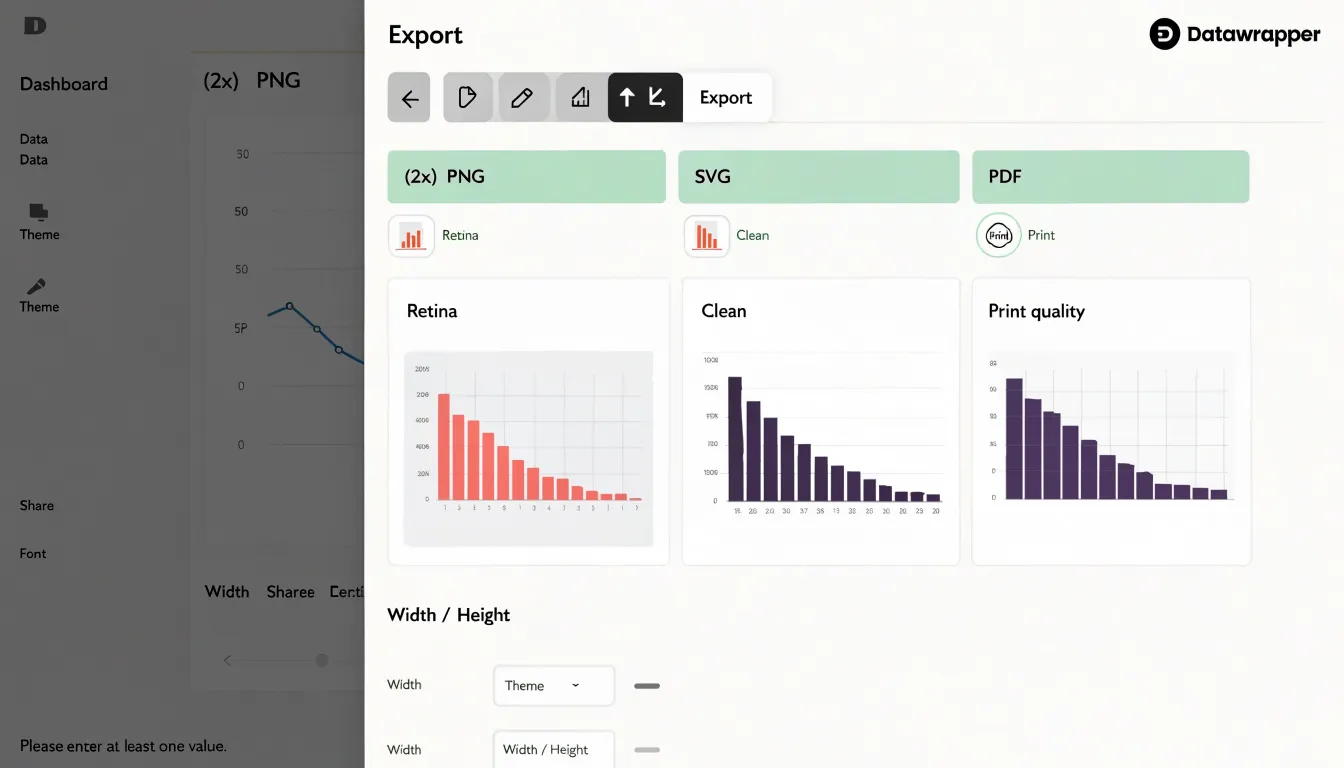
Alongside live web embeds, the downloaded image files let a newsroom grab the same chart in PNG for social media, SVG for a web page, and PDF for the print edition without rebuilding it. Labels, annotations, and source lines carry through each export.
Flourish also covers the essentials with PNG and SVG downloads, but its range skews toward the screen. Static image options exist, and interactive stories embed cleanly, yet the dedicated print-ready PDF path is less prominent, which matters when a chart has to survive an offset press or a large-scale layout. When the deliverable includes something you can hand to a print designer, Datawrapper’s export menu keeps that option front and center, alongside the PNGs and SVGs most projects need day to day.
Accessibility
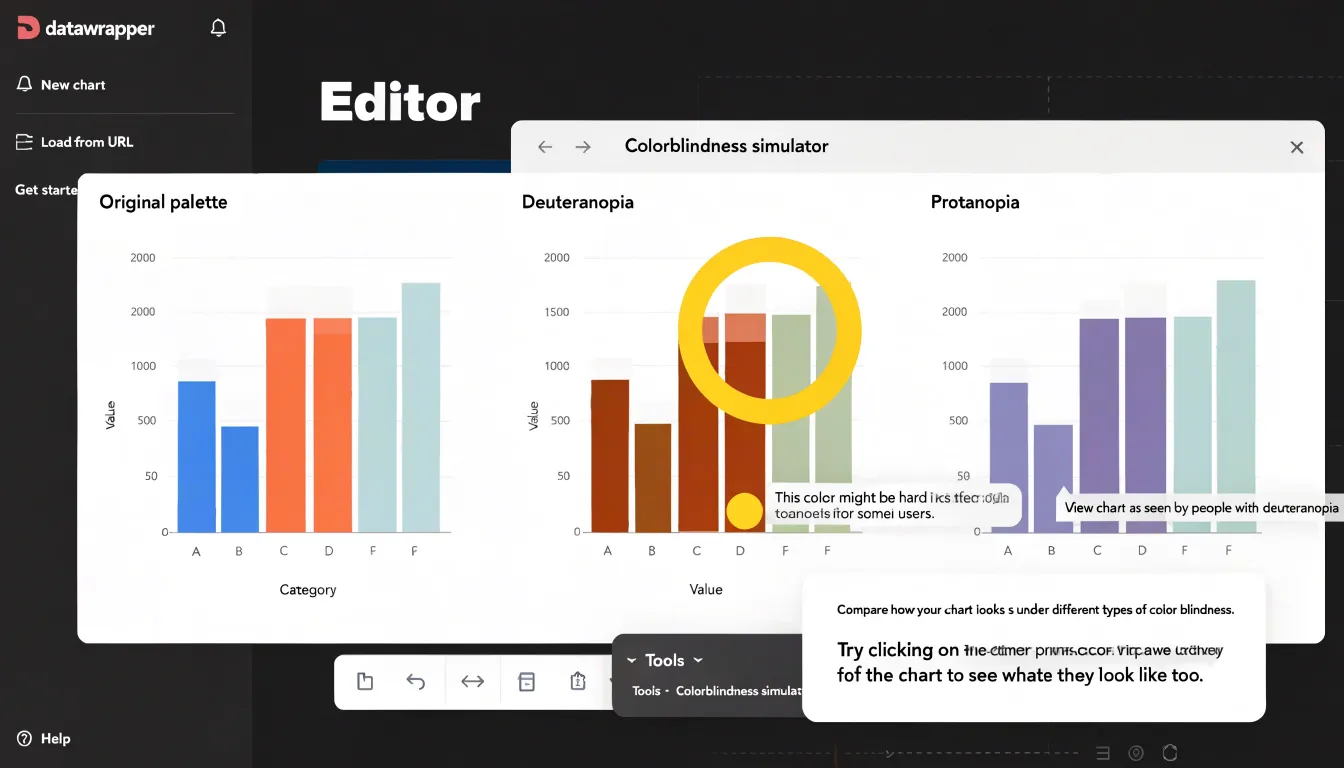
Both Datawrapper and Flourish build features into their web graphics that support readers who rely on assistive technology. Datawrapper includes a colorblindness simulator directly in its editor, so you can preview a visualization against common forms of color vision deficiency before publishing; this helps editors catch palettes that collapse into indistinguishable shades, a common failure in categorical charts. It also generates automated ARIA tags and descriptive alt text fields for each chart, giving screen readers meaningful context about the data being displayed. These elements ship with the exported graphic, which means the accessibility work carries through to the final embedded chart without extra manual coding.
Flourish approaches accessibility through its story and template system, offering screen-reader-friendly output for many of its interactive templates and letting authors add descriptive text that assistive technologies can announce. Because Flourish visuals are often more interactive, its features focus on making those interactions navigable, with fallback descriptions and structured markup for the underlying data. For teams producing charts at scale, the automated ARIA generation in both tools reduces the risk of publishing graphics that are invisible to screen readers. The practical difference lies in how much control each tool gives you over the final markup: Datawrapper exposes alt text and ARIA details in a fairly direct way, while Flourish wraps accessibility support inside its template and story structure. Testing the exported graphic with a screen reader remains worthwhile regardless of the tool, since automated tags cover the basics but human verification confirms the reading order and descriptions make sense in context.
Pricing
The pricing comparison between Datawrapper and Flourish comes down to how each platform structures its free and paid tiers. Datawrapper’s free plan is notably generous for individuals getting started: it allows unlimited public charts, which makes it a practical entry point for freelancers, students, and small editorial teams testing the waters. The constraints appear once you need private charts, custom branding, or team collaboration, at which point the paid tiers scale upward in a fairly linear way. Flourish takes a different approach, offering a free account that caps the number of published projects but gives access to much of the template library, which suits users who publish sparingly or want to experiment before committing.
For freelancers, the calculus usually centers on how many client projects require private hosting and removal of platform branding. Datawrapper’s per-seat pricing tends to be predictable, while Flourish’s tiers bundle features like private projects and advanced templates at higher price points. Newsrooms often weigh the free tier’s public-only limitation against the need for embargoed or premium content, which pushes them toward paid plans on either platform; Datawrapper’s newsroom-friendly pricing and unlimited public charts have historically appealed to smaller desks, while Flourish’s visualization variety can justify its cost for larger graphics teams. Corporations and enterprise buyers look beyond the sticker price to single sign-on, custom domains, usage analytics, and dedicated support, and both vendors offer enterprise arrangements that bundle seats and advanced controls. The practical advice is to map your publishing volume, privacy requirements, and branding needs against each free tier’s ceiling, then project costs at the scale you expect within a year, since the cheapest entry point is rarely the cheapest long-term fit for teams that grow quickly.
Support
Both platforms invest heavily in teaching users how to get the most from their tools, and each has built a distinctive support ecosystem. Datawrapper’s Academy stands out as a deep, searchable knowledge base. It combines written walkthroughs, annotated screenshots, and practical exercises that cover everything from uploading a dataset to refining axis labels and color scales. The documentation is organized around specific tasks, so a user hunting for guidance on a particular chart type can move quickly from question to answer. Because the material is text-based and versioned alongside the product, it tends to stay current and is easy to skim or link to when training colleagues.
Flourish takes a more multimedia route. Its video tutorials demonstrate chart creation step by step, which suits visual learners who prefer to watch a workflow unfold rather than read about it. The company also publishes case studies showing how newsrooms, nonprofits, and brands have used its templates in real projects, offering inspiration alongside instruction. For users who get stuck, Flourish provides dedicated support channels, including responsive help from the team and an active community forum where users exchange templates and troubleshooting tips. Datawrapper likewise maintains responsive support and a community space, though its written Academy remains the centerpiece. In practice, the choice comes down to learning style: those who like to read, search, and reference documentation will find Datawrapper’s Academy exceptionally thorough, while those who learn by watching and want to see finished examples from other organizations may prefer Flourish’s video library and case studies.
Overview
When picking between Datawrapper and Flourish, map your project’s needs onto a few concrete questions before you open either tool:
- Output format: If your primary deliverable is a static or lightly interactive chart for an article page, Datawrapper’s fast workflow, automatic mobile reflow, and built-in accessibility checks make it a natural fit for publishing at scale. If your deliverable is a scrolling story, an animated sequence, or an embed that behaves like a mini-presentation, Flourish’s templates give you motion and transitions that would otherwise require custom code.
- Team capacity: Datawrapper rewards consistency, letting small editorial teams standardize styles and publish repeatedly with minimal overhead. Flourish rewards exploration across maps, racing bars, and animated transitions, though that flexibility can mean more time spent tuning.
- Data and geography: Datawrapper handles uploaded files and live links well for routine reporting and standard cartography, while Flourish offers robust support for larger datasets and elaborate 3D or animated geographic layers.
- Project lifecycle: One-off news graphics favor Datawrapper’s speed and defaults. Campaign pages, annual reviews, and presentation decks favor Flourish’s visual polish and motion.
Use these criteria as a starting checklist, then let your deadline, audience, and editorial standards make the final call.
Frequently Asked Questions
What types of charts can you make with Datawrapper vs Flourish?
Datawrapper focuses on clean, standard formats such as bar and column charts, line and area charts, pie and donut charts, scatter plots, dot plots, and simple locator maps. Flourish offers a broader catalog that includes racing bar charts, network diagrams, scrollytelling layouts, animated Sankey diagrams, chord diagrams, marimekko charts, and a range of map styles.
Is Datawrapper or Flourish easier to use for beginners?
Datawrapper uses a linear four-step pipeline—upload data, check and refine the chart, annotate it, and publish—and a simple bar or line chart can often be generated within a minute or two. Flourish is template-driven and asks more of a new user, so a simple chart may take somewhat longer while you learn where each control lives.
Does Flourish have more interactive features than Datawrapper?
Flourish builds a substantial toolkit around hover effects, maps, animations, time-based playback, scrollytelling, and transitions between chart states. Datawrapper takes a more restrained approach, with tooltips, subtle hover emphasis, clickable map markers, and modest entry animations.
Can Datawrapper and Flourish connect to Google Sheets?
Datawrapper can connect a chart to a published Google Sheet and refresh the chart’s data on demand. Flourish offers a live link to Google Sheets that pulls in changes each time the visual loads or is republished.
Which platform is better for print-ready PDF exports?
Datawrapper lets you download a high-resolution PNG, an SVG, or a vector PDF designed for print workflows, with control over export dimensions. Flourish also covers PNG and SVG downloads, but its range skews toward the screen and the dedicated print-ready PDF path is less prominent.
How do Datawrapper and Flourish handle accessibility?
Datawrapper includes a colorblindness simulator and generates automated ARIA tags and descriptive alt text fields for each chart. Flourish offers screen-reader-friendly output for many interactive templates and lets authors add descriptive text, while both tools reduce the risk of publishing graphics that are invisible to screen readers through automated ARIA generation.
Tony Astor
Tony writes about data visualization and the tools people use to build charts and dashboards. More about Data Illustrator