Data Visualization Principles for Clear Charts
 By Tony Astor ·

Data Visualization Principles for Clear Charts
Effective charts match the format to the data structure: line charts and scatter plots for continuous data, bar charts for categorical comparisons, and pie charts for part-to-whole composition with few slices. Always start bar axes at zero, keep scale intervals even, use colorblind-safe palettes, label elements directly, and remove non-data ink to maximize clarity.
Table of Contents
Chart Selection
Selecting a chart begins with identifying the structure of your data. Continuous data, such as measurements that can take any value within a range, call for visual representations that preserve flow and magnitude. Line charts and scatter plots map individual values to positions along a continuous axis, allowing viewers to perceive trends, rates of change, and correlations. For a single continuous variable over time, a line chart is often the most direct choice; for the relationship between two continuous variables, a scatter plot reveals patterns that a table cannot.
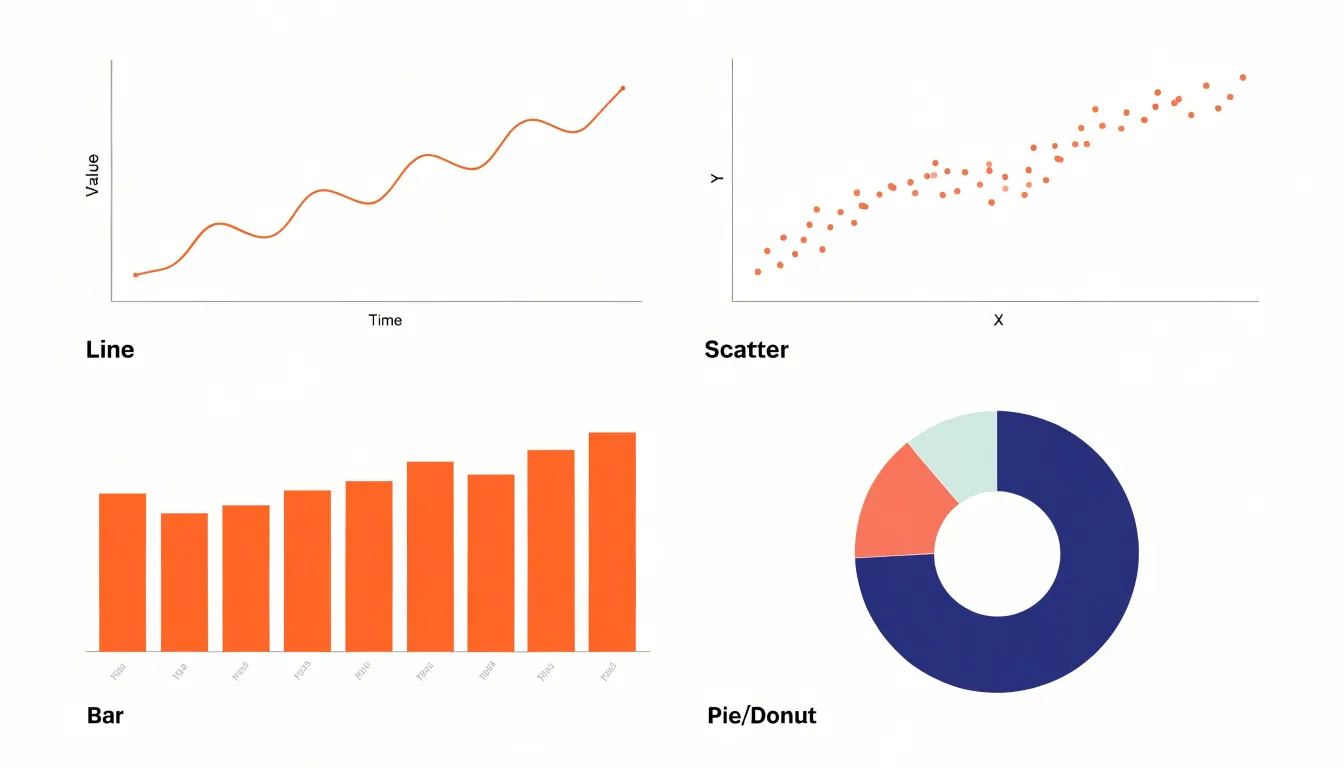
Categorical data consists of discrete groups or labels. Bar charts are the workhorse for comparing quantities across categories, as the length of each bar encodes magnitude clearly. For ranked categories, a horizontal bar chart sorted by value is usually the most readable option.
Compositional data, where parts sum to a meaningful total, benefits from formats that make the part-to-whole relationship obvious without mental arithmetic. Stacked bar charts or pie charts show static composition (though pie charts work best with a few slices). Stacked area charts show how composition changes over time, while treemaps or sunburst charts represent hierarchical composition in a compact space.
A practical decision framework starts with three questions:
- Is the data continuous or discrete?
- Are you comparing values, showing a trend, or revealing composition?
- How many variables or categories need to be displayed simultaneously?
Answering these narrows the options to a chart that aligns with both the data structure and the audience’s task.
Bar Charts
A bar chart’s effectiveness depends on orientation, ordering, and spacing.
Vertical bars suit short category labels that fit easily beneath each column. Horizontal bars work better when labels are long or numerous, since text reads naturally from left to right without rotation. Horizontal layouts also accommodate many categories without crowding, making them a practical default when the list grows beyond a handful of items.
Ordering categories requires deliberate choice:
- Alphabetical order helps readers locate a specific item.
- Sorting by value (ascending or descending) reveals ranking patterns that random ordering obscures.
- Natural order preserves inherent sequences, such as age ranges or satisfaction levels, respecting reader expectations.
Spacing between bars must remain consistent. Keep gaps at roughly half the bar width, with slightly wider separation between groups when categories are clustered, to prevent accidental visual groupings. Bars that touch create a histogram-like appearance, which implies continuity between categories and misleads readers about the underlying data.
Line Graphs
Line graphs suit continuous time-series data, where each point represents a measurement at a specific moment and the connecting line communicates the trajectory between them. Because the eye follows the line, readers grasp direction, acceleration, and turning points without interpreting individual markers. This makes line charts ideal for tracking revenue, temperature, website traffic, or patient counts across weeks, months, or years.
Choosing proper axis intervals keeps trends honest and readable. The horizontal axis should use consistent, evenly spaced time units so that equal distances represent equal durations. On the vertical axis, starting at zero is often appropriate for magnitude-based measures, while a truncated axis can be justified when small variations carry real meaning, provided the truncation is clearly labeled.
Limit the number of lines to prevent visual clutter. A chart with two to five lines remains legible, especially when each line has a distinct color and a direct label at its end. Beyond that, overlapping lines force readers to trace paths and consult a legend repeatedly. When more series must be shown, use small multiples, highlight one or two key series while fading the rest, or aggregate minor categories into a single group.
Pie Charts
Pie charts require disciplined design when showing parts of a single whole. The primary constraint is slice count. Above five or six slices, the eye struggles to compare wedge angles, and small differences become impossible to perceive. Consolidate minor categories into a single combined slice or move excess detail into a table or secondary chart.
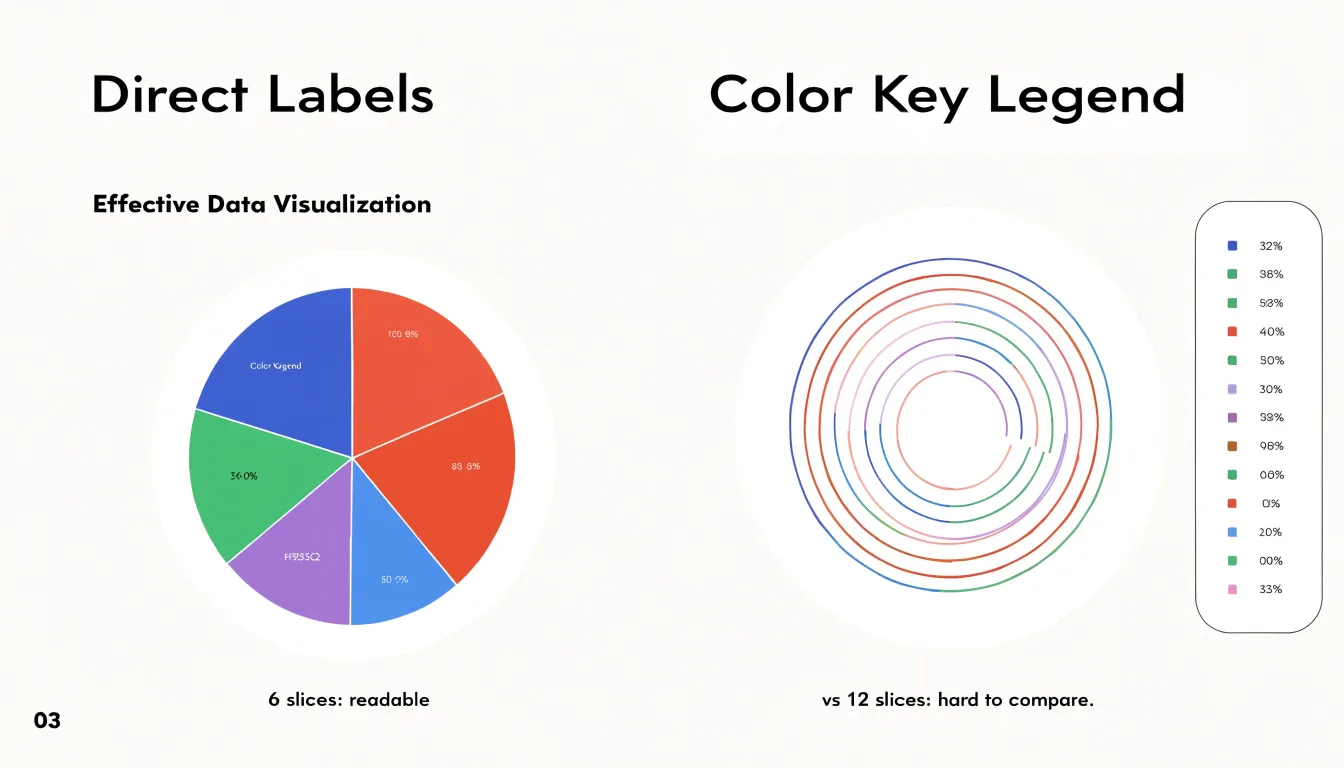
Distant legends force readers to shuttle their gaze between a color key and the chart, inviting errors when hues sit close together. Instead, label slices directly by placing category names and values next to or inside each wedge. When space is tight, use leader lines to connect labels to slices, or place percentage values inside the wedges.
The donut variation offers an open center for a headline figure, total value, or concise summary that anchors the chart’s meaning. Thinner rings also reduce the visual weight of the colored area, which sometimes makes segment comparisons feel lighter. Donut charts require the same slice and labeling discipline as standard pies.
Scatter Plots
Scatter plots place each observation as a point on a two-dimensional plane, mapping one variable to the horizontal axis and the other to the vertical axis. Readers can see at a glance whether values rise together, move in opposite directions, or show no pattern, while outliers stand apart as individual marks. Place the presumed explanatory variable on the x-axis to make the chart easier to interpret.
In dense datasets, overlapping points can obscure how many observations sit in a given region. To fix this:
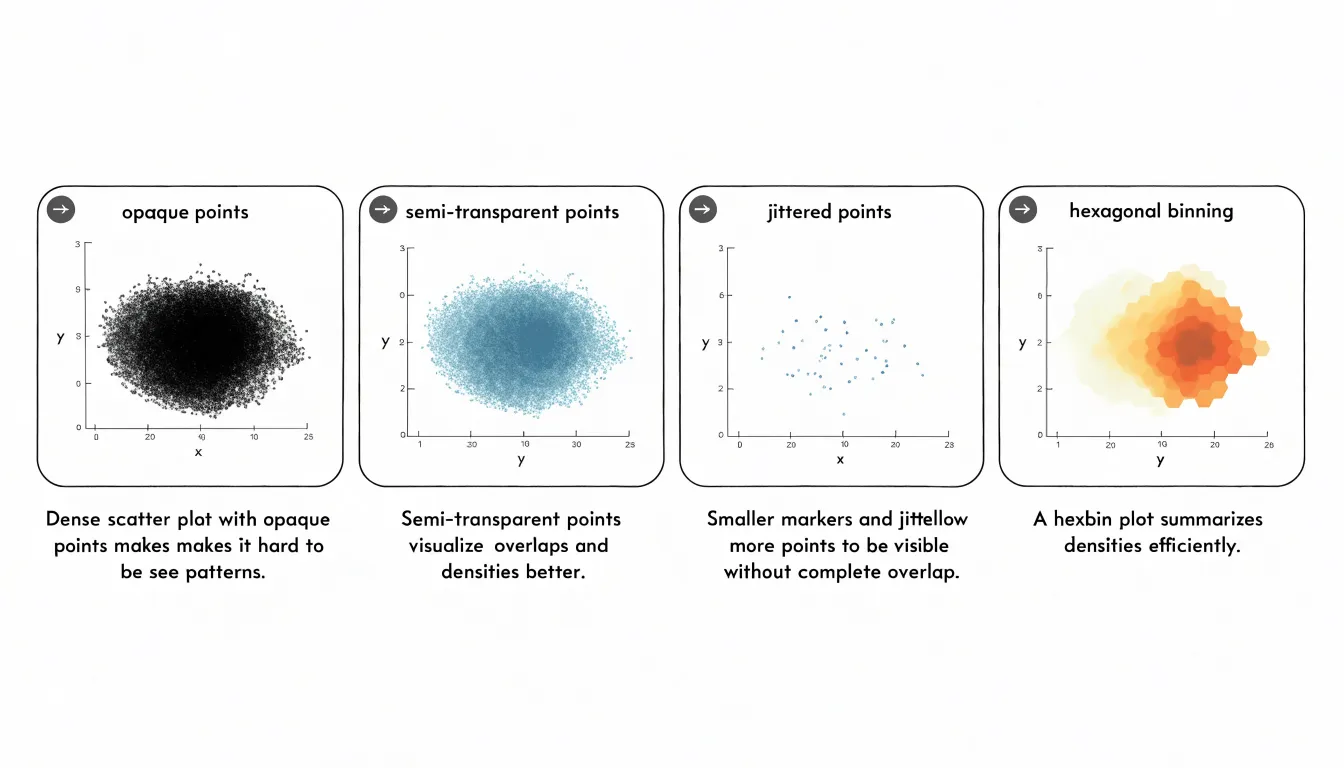
- Adjust point opacity: Semi-transparent markers accumulate visually, so darker areas signal higher concentration.
- Reduce marker size: Smaller points overlap less.
- Add jitter: Slightly shifting coordinates separates points that would otherwise stack exactly.
- Switch to density plots: For very large datasets, hexbin plots or two-dimensional histograms convey concentration clearly.
Trend lines add interpretive structure. A linear regression line summarizes the general direction of the relationship, while smoothed curves such as LOESS fit more flexible patterns when the association bends. Keep trend lines visually distinct from data points, state clearly what the line represents, and annotate notable points so readers can connect the visual pattern to the underlying data.
Color Palette
A strategic color palette depends on how the data is structured:
- Categorical schemes suit distinct, unordered groups such as product lines or regions. They rely on distinguishable hues so viewers can match a mark to its category without effort. Keep the number of categories modest to preserve clarity.
- Sequential schemes serve ordered data progressing from low to high, such as income brackets or temperature ranges. A single hue varying in lightness and saturation lets readers perceive magnitude intuitively, with darker or more saturated tones signaling higher values on a map or heatmap.
- Diverging schemes apply when data has a meaningful midpoint, such as a break-even threshold or an average. Two contrasting hues extend outward from a neutral center, separating values above and below the benchmark.
Beyond encoding data, palettes establish emphasis. Use reserved, muted tones for background structure, and apply a single saturated color to draw attention to the metric that matters most.
Color Contrast
Standard contrast ratio guidelines, such as the Web Content Accessibility Guidelines (WCAG), provide a benchmark for keeping chart elements distinguishable to all readers, including those with low vision or color vision deficiencies. Check background fills, data elements, and text labels as a connected system:
- Data elements: Aim for a contrast ratio of at least 3:1 against the background (the standard threshold for graphical objects and interface components).
- Text labels: Aim for at least 4.5:1 for normal-sized text so axis titles, data labels, and annotations remain readable on small screens or printed pages.
Contrast also matters within the chart. Overlapping series, gridlines, and shaded regions should differ enough in luminance that boundaries remain clear without relying on hue alone, since lightness differences survive most forms of color blindness. Verify ratios early using contrast checkers, browser developer tools, and built-in accessibility inspectors.
Labeling Essentials
Start with a title that delivers the chart’s central takeaway rather than merely describing its contents. “Sales rose 20% in Q3 after the spring promotion” tells readers what to remember; “Quarterly Sales” forces them to infer the point.
Axis labels must specify units unambiguously. Include currency symbols, measurement units, or multipliers such as “Thousands” or ”%” directly in the axis title. For time-based axes, state the interval (e.g., “Month”), include the time zone where relevant, and format dates consistently.
Avoid angled or crowded axis text, which slows reading. Keep text horizontal; if category names are long, abbreviate sensibly, wrap text onto two lines, or switch to a horizontal bar chart. Test your chart by asking someone to state its main point in five seconds; if they cannot, refine the title and axis labels.
Gridlines and Scales
Gridlines should guide the eye while staying in the background. Use light gray lines at low opacity against a white or near-white background, marking only the major increments a reader needs. Heavy black gridlines pull attention away from the data marks.
Choose round, logical scale increments—such as 5, 10, 25, or 100—so readers can estimate values between ticks without mental arithmetic. Keep the number of ticks modest, typically four to six across an axis, to avoid crowding the chart edges. Even when the data range is uneven, maintain a consistent interval across the axis.
Keep the plotting area calm by removing unnecessary borders, heavy axis lines, and alternating shaded rows. Place axis labels close to their ticks in a restrained font size and color.
Data Ink Ratio
Edward Tufte’s data-ink ratio principle states that the proportion of ink used to present actual data should be maximized relative to the total ink in a chart. Every mark either conveys data or adds noise.
Non-essential elements actively compete with the data and can distort perception:
- 3D effects: A 3D pie chart distorts slice sizes because perspective makes closer slices look larger. Replace 3D effects with flat, two-dimensional representations.
- Decorative fills and shadows: Gradients, background patterns, and shadows reduce contrast between data marks and the background. Strip them away.
- Redundant colors: Use a single, consistent color for data marks unless color encodes a variable.
- Gridlines: If direct data labels or axis ticks provide enough reference, eliminate gridlines entirely.
Start with a default chart and ask whether each element carries data. If it does not, remove it. A high data-ink ratio also makes charts easier to maintain, since fewer decorative elements need adjustment when data changes.
Visual Hierarchy
Visual hierarchy arranges chart elements so the reader’s eye lands first on the most important information and then moves through supporting details.
- Strategic sizing: A larger headline number, an enlarged marker on a critical data point, or a slightly thicker line for the primary series signals importance immediately. Keep size differences noticeable but restrained so the chart remains unified.
- Callout badges: A small badge near a peak, dip, or threshold crossing flags the exact moment to notice. Limit badges to two or three points per chart to avoid clutter, and pair each with a short label or highlighted value.
- High-contrast focal points: Render the full dataset in a neutral gray and apply a saturated accent color, darkest tone, or sharpest edge only to the series or segment carrying the main message.
Common Pitfalls
Three scale and sizing errors frequently mislead readers:
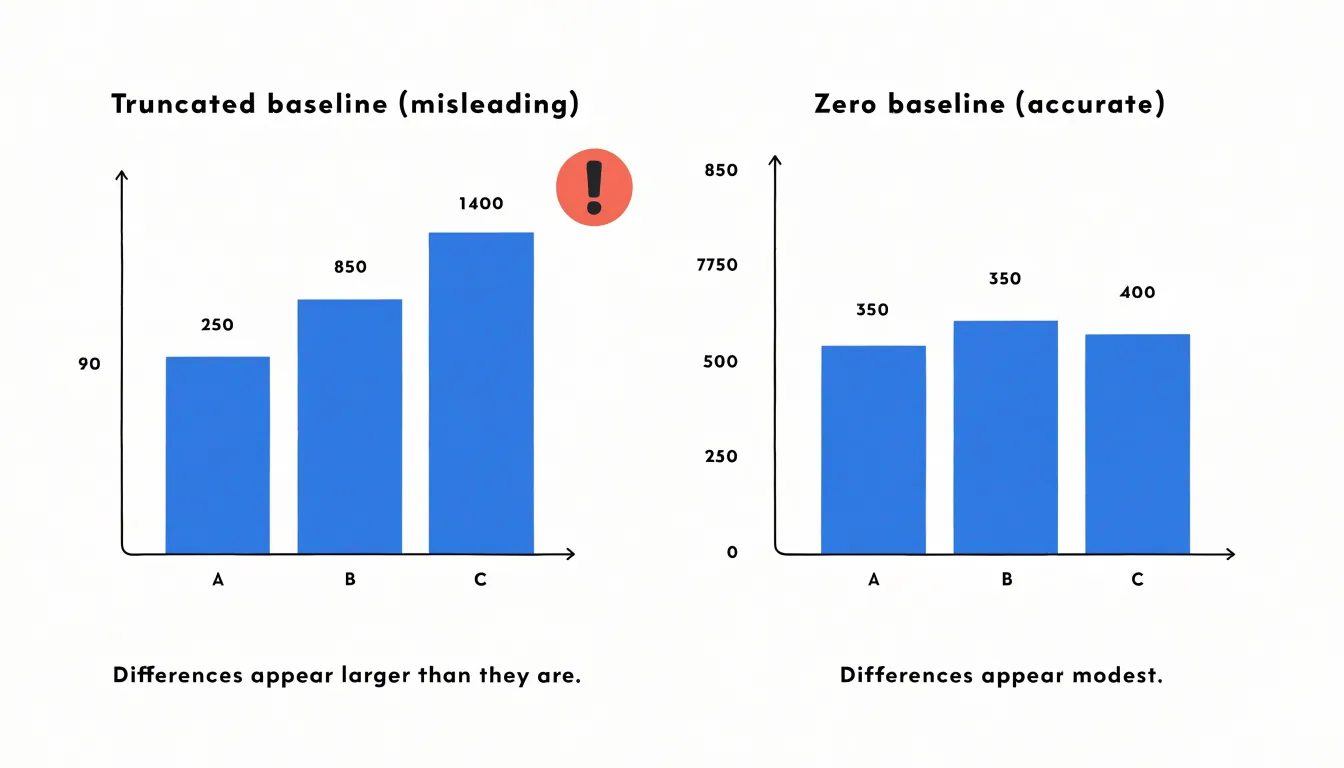
- Truncated y-axis: When a bar chart’s vertical scale starts above zero, small differences look dramatic—a bar for 52% beside one for 50% appears twice as tall if the axis starts at 48. Because readers interpret bar length as proportional to quantity, always anchor bar chart y-axes at zero.
- Irregular interval scaling: Plotting years like 1990, 1995, 2000, and 2010 at equal visual intervals makes a five-year gap look the same as a ten-year gap. The same distortion occurs when categories are spaced unevenly or when logarithmic scales are used without disclosure. Ensure each step along an axis represents the same increment, and explicitly label any non-linear scale or compression.
- Area-based distortions: Scaling both the width and height of a symbol to represent a value causes the perceived area to grow with the square of the change—doubling a value produces an icon four times larger. Scale area rather than linear dimensions, or use bars where length alone encodes value. Compare the visual size of the largest and smallest elements against their numeric ratio before publishing.
Accessibility Tips
Roughly one in twelve men and one in two hundred women experience some form of color vision deficiency, meaning palettes built on red-green contrasts can collapse into ambiguity. Tools such as ColorBrewer and the Okabe-Ito palette offer colorblind-safe hues that remain distinguishable by favoring lightness differences and blue-yellow separation over fine red-green distinctions.
Never let color carry the full burden of meaning. Pair each color with a redundant visual cue:
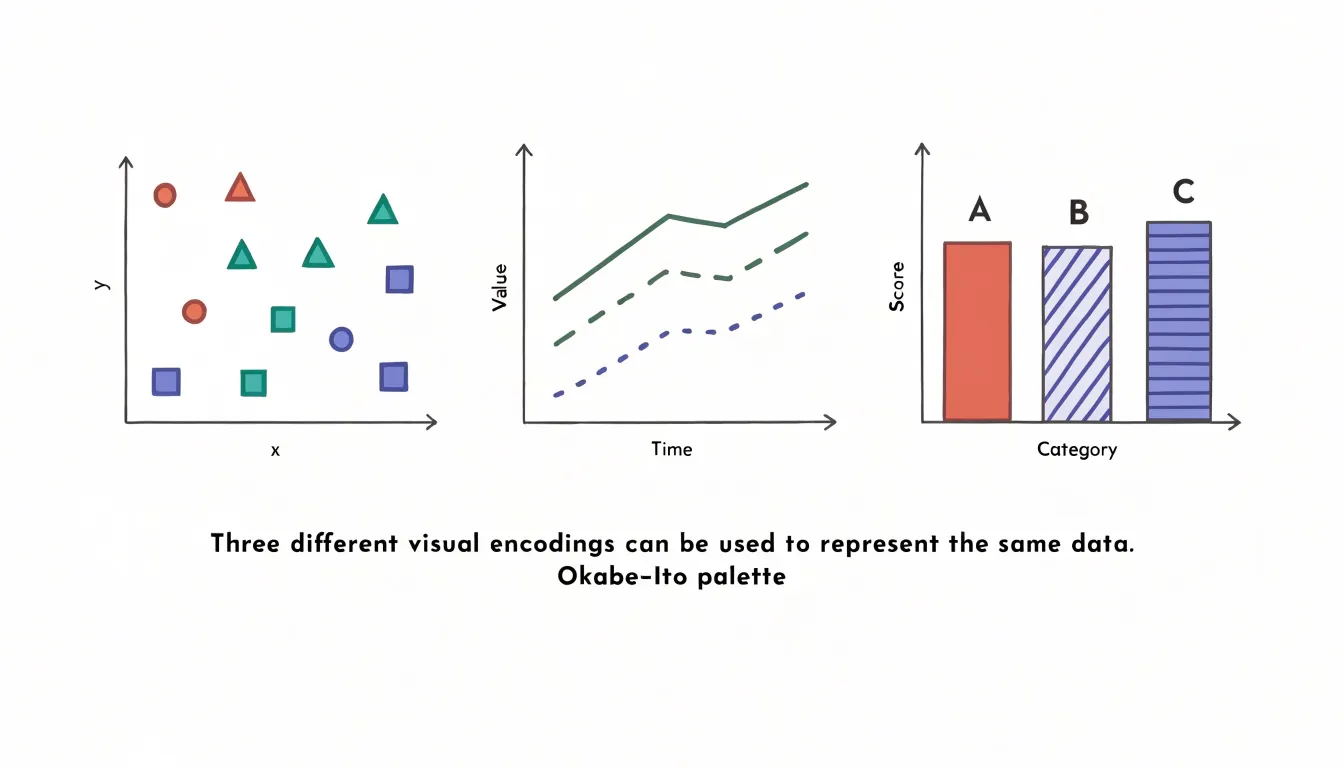
- Scatter plots: Vary marker shapes (circles, triangles, squares, crosses).
- Line charts: Vary stroke patterns (solid, dashed, dotted).
- Bar charts: Add texture or direct labels.
Finally, run finished charts through simulation tools—via browser extensions or built-in charting features—that render figures as they appear with deuteranopia, protanopia, or tritanopia. This reveals hidden collisions, such as two categories reading as the same muddy tone, so you can adjust palettes, shapes, or patterns before publishing.
Interactive Dashboards
Interactive dashboards succeed when the interface loads in a calm, legible default view: a small set of key metrics, a clear time range, and filters reflecting the most common user questions. Reserve secondary options for expandable panels or a dedicated settings area.
- User-driven filters: Show each control’s current value plainly, order options logically (recent dates first, common categories near the top), and provide a brief loading cue when updates take a moment. If a filter combination yields no results, display an explanatory message rather than a blank canvas.
- Hover tooltips: Place tooltips near the cursor to summarize the single data point under inspection with a label and formatted value, without covering the element itself. On touch devices, use tap-and-hold behaviors and clearly sized hit targets.
- Drill-down capabilities: Let users click a bar or region to refine the underlying series and move from overview to specifics. Provide breadcrumbs or a reset control so users can retrace their steps, and keep the overall layout stable as interactions unfold.
Frequently Asked Questions
How do I choose the right chart for my data?
Start by identifying whether your data is continuous or discrete, whether you are comparing values, showing a trend, or revealing composition, and how many variables or categories need to be displayed. Continuous data can call for line charts or scatter plots, categorical comparisons often use bar charts, and part-to-whole data can use formats such as stacked bars, pie charts, stacked area charts, treemaps, or sunburst charts.
When should I use a horizontal bar chart instead of a vertical one?
Horizontal bars work better when labels are long or numerous, since text reads naturally from left to right without rotation, and they accommodate many categories without crowding. Vertical bars suit short category labels that fit easily beneath each column.
How many lines should I put on a line graph?
A chart with two to five lines remains legible, especially when each line has a distinct color and a direct label at its end. When more series must be shown, use small multiples, highlight one or two key series while fading the rest, or aggregate minor categories into a single group.
How many slices should a pie chart have?
Above five or six slices, the eye struggles to compare wedge angles, and small differences become impossible to perceive. Consolidate minor categories into a single combined slice or move excess detail into a table or secondary chart.
How can I fix overlapping points in a scatter plot?
You can adjust point opacity so semi-transparent markers accumulate visually and darker areas signal higher concentration. You can also reduce marker size, add jitter, or switch to density plots such as hexbin plots or two-dimensional histograms for very large datasets.
What contrast ratios should chart data elements and text labels meet?
Aim for a contrast ratio of at least 3:1 against the background for data elements, the standard threshold for graphical objects and interface components. Aim for at least 4.5:1 for normal-sized text labels so axis titles, data labels, and annotations remain readable.
Tony Astor
Tony writes about data visualization and the tools people use to build charts and dashboards. More about Data Illustrator