Data Storytelling: How to Turn Charts Into a Narrative
 By Tony Astor ·

Data Storytelling
Data storytelling is the practice of combining data visualization with narrative context so that insights drive decisions. It pairs charts and dashboards with framing, annotations, and plain language so audiences can interpret numbers quickly. Effective data storytelling matches visuals to the audience, highlights one focal point per view, declutters charts, uses honest scales, and tests the story before publishing.
Table of Contents
Context
Raw numbers arrive stripped of context, which drains them of persuasive power. A statistic presented on its own — a percentage, a dollar figure, a count of users — carries meaning only for the person who already understands the conditions around it. For everyone else, it sits inert on the page. The audience has no way to judge whether the figure is large or small, alarming or routine, because there is nothing nearby to compare it against. Without that surrounding information, even accurate data can be dismissed, misread, or forgotten by the time the meeting ends.
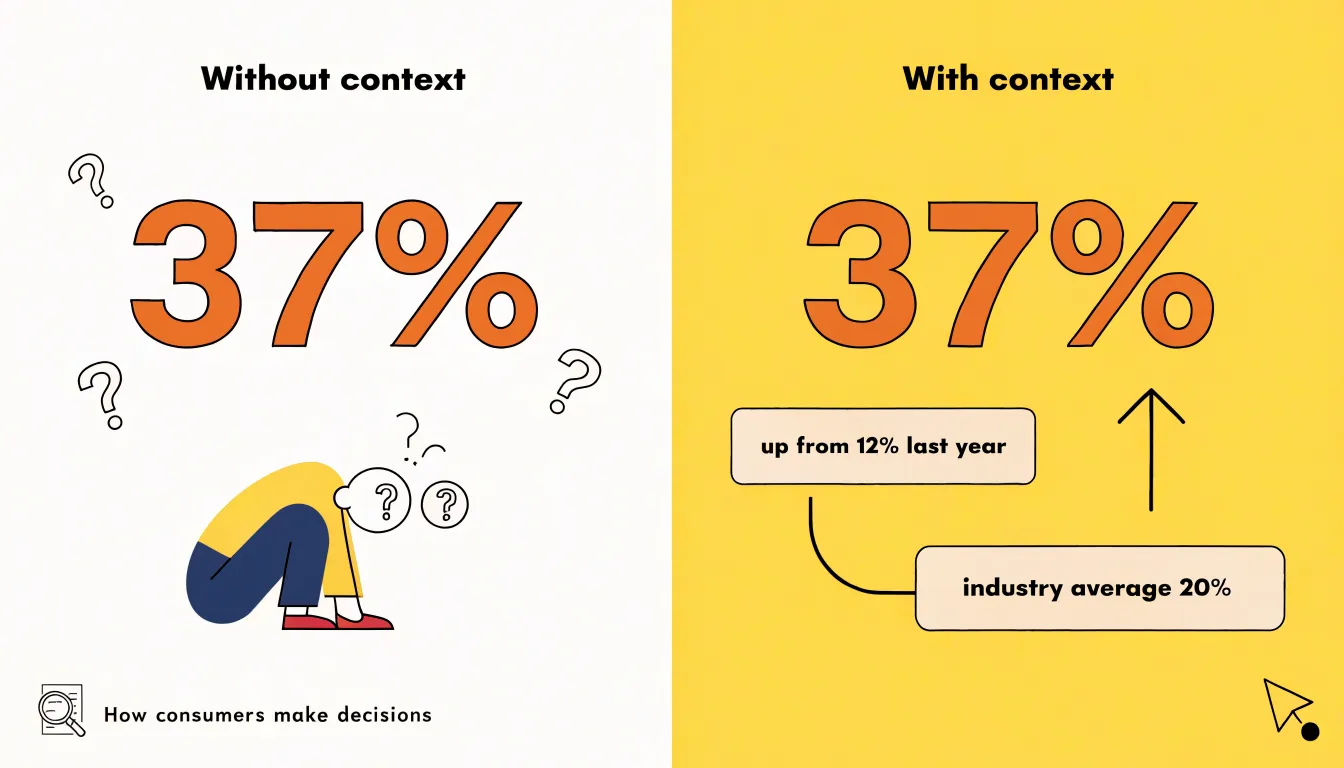
Background information turns a figure into a fact the audience can reason with. When a number is anchored to something familiar — a prior year, a typical household, a known threshold — the listener can slot it into an existing mental model and weigh its significance. This framing gives stakeholders the logical foothold they need to follow the argument and test it against their own experience. A count becomes meaningful once the audience knows what it represents and why that quantity matters to the decision in front of them.
Real-world framing also supplies the emotional texture that makes an insight stick. A statistic describing affected customers is abstract; the same figure situated in the daily routine of one such customer becomes vivid, and the audience can feel the stakes rather than merely compute them. Stakeholders rarely act on comprehension alone. They act when an insight feels relevant to people and outcomes they care about, with the surrounding story providing the bridge between a number on a slide and a decision worth making.
Audience
Before designing any visual, consider who will be viewing it: executives, technical experts, or general consumers. Each group has distinct backgrounds, expectations, and levels of technical literacy that should shape your visual choices.
Executives typically seek the big picture to grasp key insights quickly and make decisions. Their time is limited, so visuals should highlight the most critical metrics and trends without unnecessary detail. Use clear, concise charts with bold headlines that state the takeaway. Avoid clutter and technical jargon; instead, focus on strategic implications. For example, a line chart showing revenue growth over time with a single annotated point of inflection can communicate more than a complex dashboard.
Technical experts, such as engineers or data scientists, demand precision and depth. They are comfortable with detailed charts and will scrutinize the methodology. Provide them with interactive visualizations or comprehensive dashboards that allow exploration. Include error bars, confidence intervals, and clear axis labels. They appreciate transparency, so link to raw data or include notes on data sources and transformations to enable them to verify findings and understand the nuances.
General consumers, like customers or the public, need simplicity and context. Because they may not have domain knowledge, visuals should be intuitive and self-explanatory. Use familiar chart types, plain language, and relatable examples. Incorporate annotations or callouts to guide interpretation. For instance, a bar chart comparing product features could be paired with icons and a brief explanation of why it matters.
To assess your audience, ask: What is their role? What decisions will they make? What is their familiarity with the data? When in doubt, err on the side of clarity.
Chart Selection
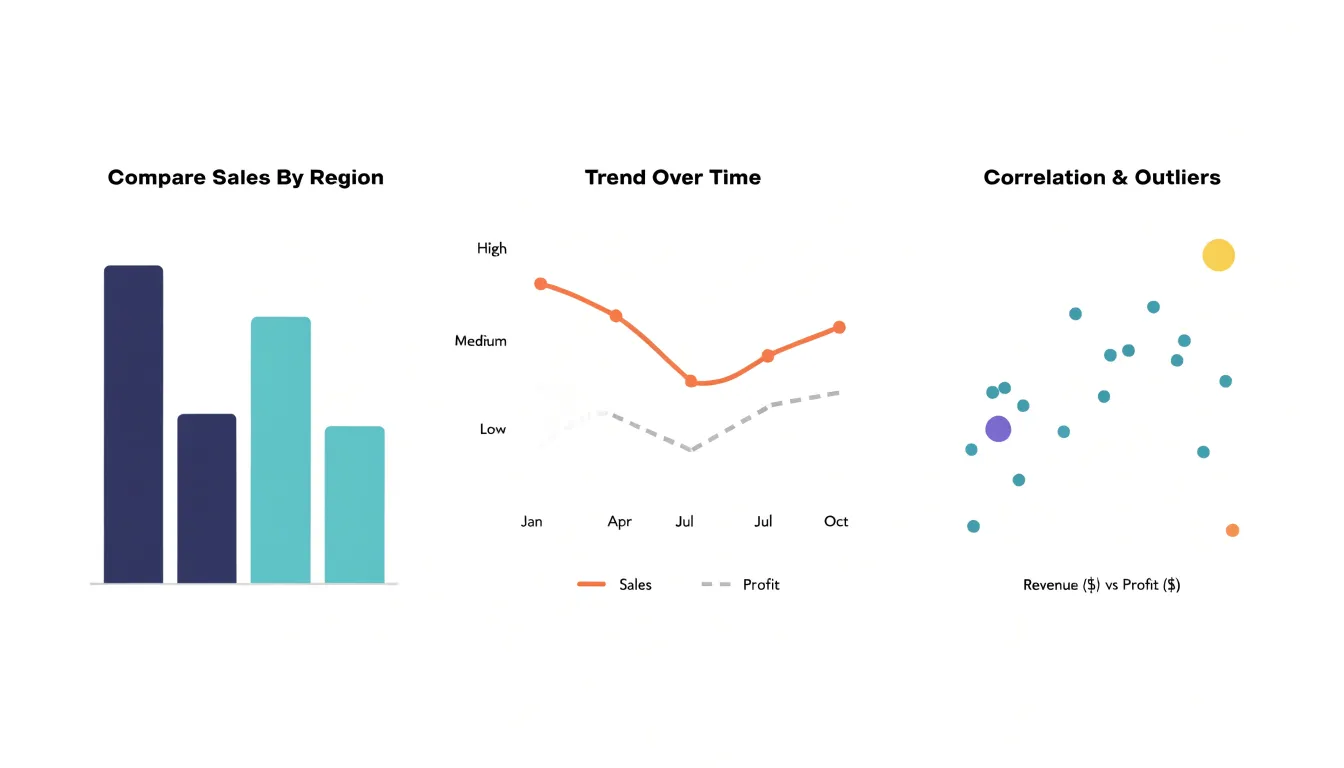
The choice among bar graphs, line charts, and scatter plots should be guided by the specific relationship you want to emphasize.
- Bar graphs: When your goal is to compare discrete values across categories, bar graphs are often the most effective. Their length or height provides a clear visual encoding of magnitude, making it easy to see which category is largest or smallest. For example, a bar graph works well for comparing sales figures across different regions or survey responses across demographic groups. The gaps between bars also reinforce the categorical nature of the data.
- Line charts: When your focus is on showing trends over time, line charts are typically the best choice. The continuous line connects data points in a sequence, naturally implying progression and direction. This makes line charts ideal for time series data, such as monthly revenue or website traffic over a year. The slope of the line communicates the rate of change, allowing viewers to quickly grasp whether values are increasing, decreasing, or fluctuating.
- Scatter plots: For highlighting correlations between two variables, scatter plots are the most suitable. Each point represents a pair of values, and the overall pattern of points reveals whether there is a relationship—positive, negative, or none. Scatter plots are particularly useful for identifying clusters, outliers, and the strength of an association, such as the correlation between advertising spend and sales.
Matching the chart type to the intended message ensures that your audience can easily perceive the patterns and insights you want to convey.
Highlighting
Highlighting controls where a reader looks first. In any visualization, the eye lands on some elements before others, and highlighting makes that natural scanning behavior work in service of the message. The goal is to ensure that the single most important metric or takeaway registers within the first second of viewing, before the reader has to consciously parse axes, legends, or labels.
Strategic contrast is the foundational technique: a value rendered in a saturated color against a muted field of grays pulls the gaze immediately, while surrounding context remains visible but recedes. Bold typography works in a similar way, giving a headline number or key label enough visual weight that it reads as the anchor of the composition rather than one data point among many. Focal shapes such as circles, callout boxes, or shaded bands can isolate a specific region and signal that this area deserves attention.
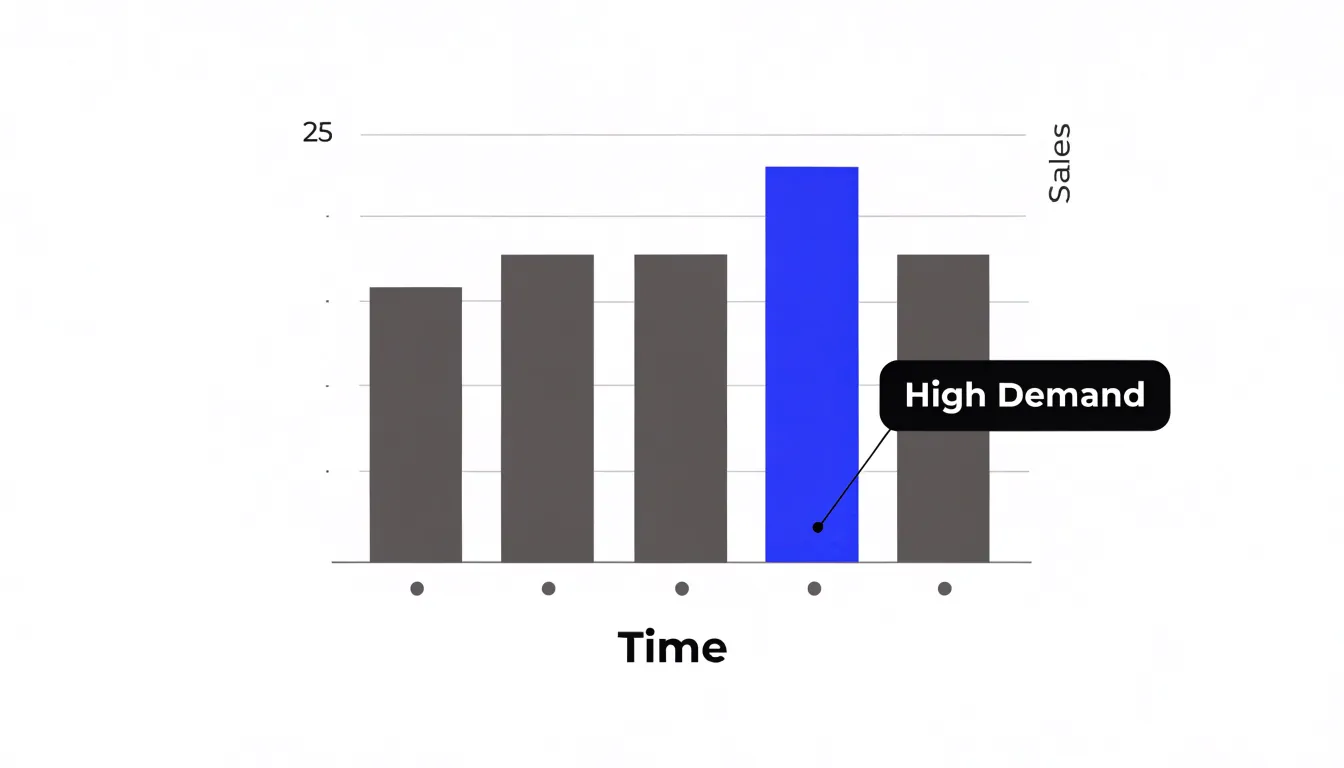
These techniques create a deliberate hierarchy of emphasis, where one element is clearly primary and everything else is supporting context. Used well, highlighting reduces cognitive load because the design has already made the judgment of relevance visible. Apply highlighting sparingly, since emphasizing too many elements at once flattens the hierarchy and returns the viewer to an undifferentiated field. A single focal point per view, occasionally two when a direct comparison is the point, tends to be most effective. When highlight and message align, the chart communicates its takeaway almost instantly, while the surrounding detail remains available for readers who want to dig deeper.
Decluttering
Every chart carries a fixed budget of visual attention, and each element on the canvas draws from it. Decluttering is the discipline of deciding where that budget goes.
Gridlines are a familiar example: a full lattice of them adds dozens of competing lines that the eye must sort through before reaching the data. Reducing them to a few faint reference marks, or removing them entirely when data labels make them redundant, leaves the bars and points as the unambiguous subject of the graphic. Heavy borders around plots and table cells act the same way. A thick frame turns the chart into a boxed object, pulling the eye toward the boundary rather than the trend inside. Removing the frame, or thinning it, lets the content sit forward without a competing edge to track.
Decorative backgrounds introduce a subtler cost. Gradients, textures, and brand-colored fills behind the plotting area create tonal variation that the visual system keeps trying to interpret, competing with the actual comparison the reader needs to make. A flat, quiet surface makes the data marks stand out by contrast and gives the reader nothing else to decode. When a viewer spends mental effort filtering out chart junk, that effort is unavailable for holding information in working memory and understanding the numbers.
In practice, decluttering is iterative. Build the chart, then ask of each element what it contributes to the specific decision the reader needs to make. Gridlines that aid estimation stay, faint. Borders that separate but do not distract remain, thin. Anything purely ornamental goes, leaving only the features that carry meaning.
Flow
Flow refers to the deliberate arrangement of visual components so that the audience moves through the data in a sequence that feels natural and intuitive. In left-to-right reading cultures, viewers tend to begin at the top left of a composition and scan across and downward, giving weight to the elements placed early in that path. A well-structured layout respects these habits by positioning the entry point, the context, and the supporting evidence in the order the eye is likely to encounter them. The opening visual typically establishes the question or the headline finding, subsequent panels unpack the contributing factors, and the final element delivers the conclusion or recommended action.
Building flow also involves sequencing data points as steps in an argument. Each visual component should follow from the one before it, so that a viewer can progress from the first observation to the final conclusion without backtracking or re-reading. This often means grouping related metrics together, using consistent ordering across charts, and arranging comparative elements so that the baseline appears before the variation. Visual cues such as consistent color usage, numbered stages, or directional arrows reinforce the intended path.
Flow benefits from deliberate pacing as well. Dense charts placed early can overwhelm a viewer before the narrative has taken hold, while gradual escalation from simple to complex keeps attention engaged. Designers frequently test flow by walking through their layout from the perspective of a first-time reader, noting where the eye pauses, where it jumps, and where the narrative thread breaks, then adjusting alignment, spacing, and panel order until the sequence reads cleanly.
Color
Color is one of the fastest channels into a viewer’s attention and deserves deliberate handling rather than default palettes. Hue carries meaning before words are read: a warm red or orange reads as alarm or urgency, which suits a chart flagging a missed target or a sudden spike, while cooler blues and greens settle the eye and signal stability or baseline conditions. Saturation works alongside hue as a volume knob; reserving fully saturated fills for the single series or point that matters lets everything else recede into supporting context.
When a chart holds several related variables, grouping them under one hue family and separating the groups by lightness or saturation keeps the relationship visible without adding visual noise. Diverging and sequential schemes should match the data’s structure, so a scale running from negative to positive pivots around a neutral midpoint, and an ordered measure steps smoothly from light to dark.
Accessibility belongs in the same decision. Text and key marks need enough contrast against their backgrounds to stay legible for viewers with low vision or color vision deficiency, and relying on hue alone to distinguish categories excludes a meaningful share of any audience. Pairing color with labels, shape, or position provides a second cue. A restrained palette, typically a handful of hues with a neutral for context, keeps the page calm. Testing the chart in grayscale is a quick check that the hierarchy survives when color cues fade.
Annotations
Annotations are short, direct notes placed on a chart or dashboard to explain the moments that matter most. When a line spikes or dips unexpectedly, a brief callout positioned right beside that point can tell the reader what happened in a single sentence. A small label near a sudden drop might read “site outage, 6 hrs” or “competitor price cut”; a note beside a sharp rise might say “spring campaign launch” or “policy change announced.” These short phrases sit directly on the visual where the reader’s eye is already drawn, so the explanation arrives at the moment of curiosity rather than in a separate document.
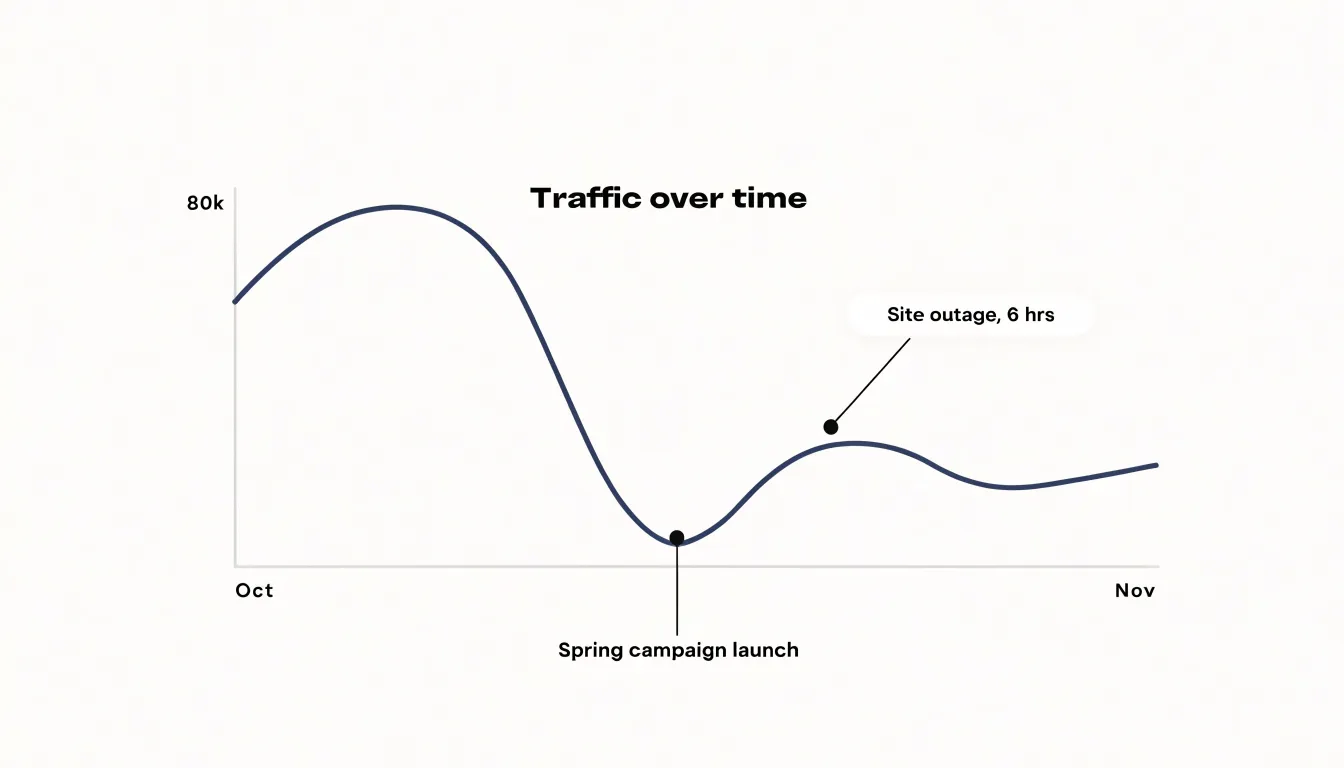
Readers scanning a chart naturally pause at anomalies, and an annotation answers the question they are already forming without requiring them to leave the visual, open a methodology appendix, or search footnotes. For economic shifts, a callout such as “rate hike announced” attached to a turning point gives context that raw numbers cannot supply. For campaign events, a marker flagging the launch date allows viewers to connect cause and effect at a glance, replacing pages of side documentation with a few well-placed words.
Good annotations stay short—typically a phrase or single sentence—and attach only to the points that genuinely need explanation. Too many notes clutter the visual and dilute attention, while a handful of carefully chosen callouts turns an unexplained fluctuation into a clear, self-contained narrative.
Narrative Arc
A narrative arc gives a data presentation direction, borrowing from classic storytelling: a situation is established, tension builds, and a resolution arrives to release that tension. In a data context, this means beginning with the current state as the audience recognizes it, then introducing the trends that reveal something shifting beneath the surface. A rising line of customer complaints, a widening gap between demand and capacity, or a gradual decline in retention all serve as the rising action. Trends are shown in an order that intensifies concern, with each data point raising the stakes a little further so the audience feels the urgency of the situation before any solution is presented.
Once the tension has been established, the presentation pivots to resolution. Here, data-backed solutions offer evidence that the problem can be addressed and show the projected impact of specific interventions. A forecast line that bends toward improvement, a comparison with a pilot program that produced measurable gains, or a scenario model demonstrating reduced risk all function as the resolution.
The resolution feels satisfying because the audience has traveled through the tension with the presenter. Without that arc, data can feel like a flat inventory of facts; with it, each number carries logical purpose, giving stakeholders both a reason to care and a clear path forward.
Honest Layouts
When you design a chart, the choices you make about scales and proportions directly affect how viewers interpret the data. Starting a bar chart’s axis at zero is a fundamental practice because bars represent magnitude through their length. If the axis is truncated, the visual difference between bars becomes exaggerated, leading viewers to perceive a larger gap than actually exists. For example, a bar chart showing sales figures of 100 and 105 with a y-axis starting at 95 would make the 5% difference appear as a 100% increase, which can lead to incorrect conclusions and poor decisions.
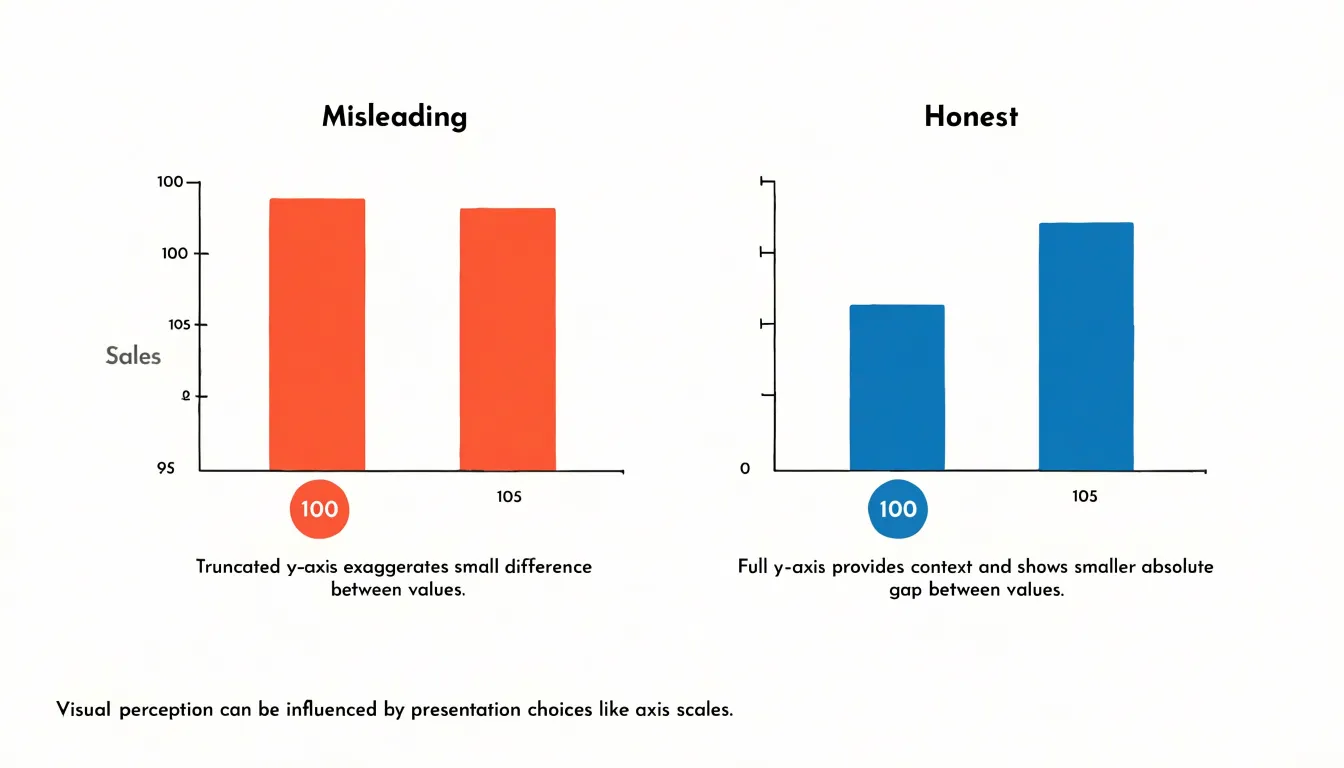
Avoiding distorted proportions in other chart types is equally important. Pie charts should represent parts of a whole accurately, with slice angles proportional to the values they represent. Line charts, while sometimes needing non-zero baselines to show trends, should clearly indicate when the axis is broken to prevent misinterpretation. The goal is to maintain visual integrity so that the graphic accurately reflects the underlying numbers.
When stakeholders see that you present data transparently, they are more likely to accept your insights and recommendations. Conversely, misleading visuals, even if unintentional, can damage credibility and lead to skepticism. By adhering to fair scaling practices, you respect your audience’s ability to understand the data correctly and empower them to make informed choices.
Plain Language
Plain language is the bridge between a statistical finding and the people who need to act on it. When an analyst reports that “the p-value fell below 0.05 for the treatment cohort,” most readers outside the research team will not know how to interpret it. Translating that result into everyday terms, such as saying the improvement was large enough that it is unlikely to be a coincidence, gives any reader a fair chance to understand what happened without removing precision.
Dense jargon and unexplained acronyms create distance between the data and its audience. A dashboard labeled with KPIs, CAGR, and YoY deltas may be clear to a finance team and opaque to everyone else. Replacing each acronym with its plain equivalent, or spelling it out on first use, removes a barrier that would otherwise stop a reader cold. Likewise, statistical terms such as standard deviation, confidence interval, and statistically significant can be paired with short, concrete descriptions. A confidence interval, for instance, can be introduced as a range that likely contains the true figure.
The most effective translations connect numbers to lived experience. A statistic stating that average response times dropped by 40 percent becomes far more useful when paired with a sentence explaining that a customer who once waited five days for a reply now hears back in about three. This restatement preserves accuracy while making the consequence of the data concrete, turning a statistic into something a person can picture, remember, and discuss with colleagues.
Text and Imagery
When a chart is presented without commentary, viewers are left to guess at the significance of a trend, the reason a metric was chosen, or the caveats that qualify the data. Conversely, a page of written explanation without a visual anchor forces readers to hold numbers and relationships in their heads, which quickly becomes exhausting and error-prone. In an effective pairing, each element does a distinct job: the graphic shows the shape, scale, and pattern of the data at a glance, while the prose supplies the interpretation, framing, and context.
Achieving this balance requires restraint on both sides. Written commentary should be concise, guiding attention to the salient feature of each visual and then stepping back, rather than restating every value the reader can already see. Visuals should carry the quantitative weight with clean labeling and a clear focal point, so they do not require lengthy captions to be legible.
Practical techniques help maintain this equilibrium:
- Place explanatory text directly adjacent to the visual it describes.
- Limit each graphic to one central message.
- Use annotations within the chart to connect words to specific data points.
- Sequence text and image so the narrative flows naturally from one to the next.
A well-composed pairing allows someone to scan the visual for the big picture and read the commentary for the why, without feeling overloaded with prose or stranded among unlabeled marks.
Interactive Elements
Interactive elements let readers move from passive recipients of a data story into active explorers of it.
- Tooltips: Hovering over a bar or a point surfaces the exact figure, label, or unit behind it without cluttering the chart itself, keeping the main visual clean while preserving precision for anyone who wants it.
- Dynamic filters: A dropdown for region, a date slider, or a toggle between segments lets a reader reframe the view around the question they care about—whether their own market, a recent quarter, or a particular customer group. The underlying message stays anchored in the annotations, headline figures, and guided sequence of charts, while filters operate as optional layers of detail beneath it.
- Drill-down features: Clicking a category can open a breakdown by product line, then by individual item, following a hierarchy that mirrors how analysts investigate a result. Each level carries its own context, so the reader never loses the thread of the larger argument even as they go deeper.
What ties all three together is a deliberate separation between narrative and evidence. The story remains legible to someone who never touches a control, while the interactive layer rewards curiosity with specificity. Designers can guide this balance by placing affordances where questions naturally arise, keeping default views aligned with the central claim, and making it easy to reset or return to the original state.
Testing
Testing a data story before publication confirms whether the message lands as intended. Recruit three to five colleagues from different departments who are not subject-matter experts, give them the chart or slide deck with no narration, and ask them to say aloud what they see and what they think it means. Their first reaction reveals the story a visual tells on its own, before any presenter has a chance to explain it away.
Structure the session around a few simple prompts:
- What is the main takeaway here?
- What is this chart showing?
- Where did your eye go first?
- Which part is confusing?
Ask participants to describe the message in their own words, then compare what they say with the intended takeaway. Gaps point directly to fixes, such as an ambiguous title, an unlabeled axis, a color choice that implies the wrong ranking, or too many elements competing for attention. Capture exact quotes where possible, since a participant’s phrasing often becomes a better headline than the original draft.
Keep each session short, roughly ten to fifteen minutes, and run participants individually so that one person’s interpretation does not anchor the others. If several people make the same error, the visual is the problem rather than the audience. After revisions, run a fresh round of quick checks to confirm that the changes resolved the confusion. Schedule testing alongside design review and data validation so that feedback arrives early enough to shape the final visuals.
Dashboards
A dashboard draws together charts, key figures, and contextual annotations into a single view. Start by identifying the two or three questions the dashboard must answer immediately, then position the visuals that address those questions in the upper portion of the page where the eye lands first. Large summary metrics or a single trend line often work best as the opening statement, with supporting breakdowns arranged beneath or beside them in a logical reading order.
Grouping related visuals close together lets viewers trace a narrative without hunting across the page, and consistent use of color, typography, and axis conventions keeps the reader oriented as they move between panels. Filters and interactive controls belong in a predictable location, typically along an edge, so that deeper exploration feels like a natural extension of the overview rather than a separate task.
Each panel should earn its place; a visual that does not advance the story competes for attention and dilutes the message. Provide brief labels or short captions that explain what each element shows and why it matters, since a dashboard often travels without its author. Test the finished layout by asking someone unfamiliar with the data to summarize the main takeaway within seconds, then to drill into a specific detail. When the high-level insight is clear and the path to finer detail is obvious, the dashboard succeeds as a cohesive narrative surface.
Frequently Asked Questions
What is data storytelling and why does context matter for raw numbers?
Raw numbers lack context and persuasive power until background information anchors them to something familiar, such as a prior year or known threshold. Real-world framing also gives the audience emotional texture so they can understand why the figure matters and act on it.
How should I choose between bar graphs, line charts, and scatter plots?
Use bar graphs to compare discrete values across categories, line charts to show trends over time, and scatter plots to highlight correlations between two variables. Matching the chart type to the intended message helps the audience perceive the patterns you want to convey.
How should data visuals differ for executives and technical experts?
Executives typically need the big picture quickly, so visuals should highlight critical metrics and trends with clear, concise charts, bold headlines, and strategic implications without clutter or jargon. Technical experts demand precision and depth, so provide interactive visualizations or comprehensive dashboards with error bars, confidence intervals, clear axis labels, and notes on data sources and transformations.
How can highlighting improve a chart?
Highlighting controls where a reader looks first and helps the most important metric or takeaway register within the first second of viewing. Use strategic contrast, bold typography, and focal shapes sparingly, with a single focal point per view or occasionally two when a direct comparison is the point.
Why should bar charts start at zero?
Starting a bar chart’s axis at zero is a fundamental practice because bars represent magnitude through their length. If the axis is truncated, the visual difference between bars becomes exaggerated and can lead viewers to incorrect conclusions and poor decisions.
How can I test whether a data story communicates clearly?
Recruit three to five colleagues from different departments who are not subject-matter experts, give them the chart or slide deck with no narration, and ask them to say aloud what they see and what they think it means. Use prompts such as “What is the main takeaway here?” and “Which part is confusing?”, keep sessions short, and run participants individually so one person’s interpretation does not anchor the others.
Tony Astor
Tony writes about data visualization and the tools people use to build charts and dashboards. More about Data Illustrator