Data Illustrator Alternatives: Tools for Designing Custom Charts
 By Tony Astor ·

Data Illustrator Alternatives
Data Illustrator alternatives include RawGraphs for SVG chart export, Charticulator for rule-based custom glyphs, Datawrapper for responsive publication-ready embeds, and Flourish for animated storytelling templates. Other options are Plotree, Illustrator plugins like Datylon, Figma plugins, Canva, Vizzlo, D3.js, Tableau, and Infogram—chosen by skill level, timeline, and design control.
Table of Contents
RawGraphs
RawGraphs is an open-source tool built for designers who want to create custom visualizations without writing code. The workflow begins with raw data: users paste values directly from a spreadsheet or upload a file, and RawGraphs parses the rows and columns into a structured dataset ready for mapping. From there, the interface presents a library of chart types that go well beyond basic bars and lines, covering alluvial diagrams, treemaps, bump charts, circular dendrograms, and other layouts suited to complex or hierarchical data. Each chart is assembled by dragging data dimensions onto visual properties such as the x-axis, y-axis, size, and color, which makes the relationship between the underlying numbers and the finished graphic visible at every step.
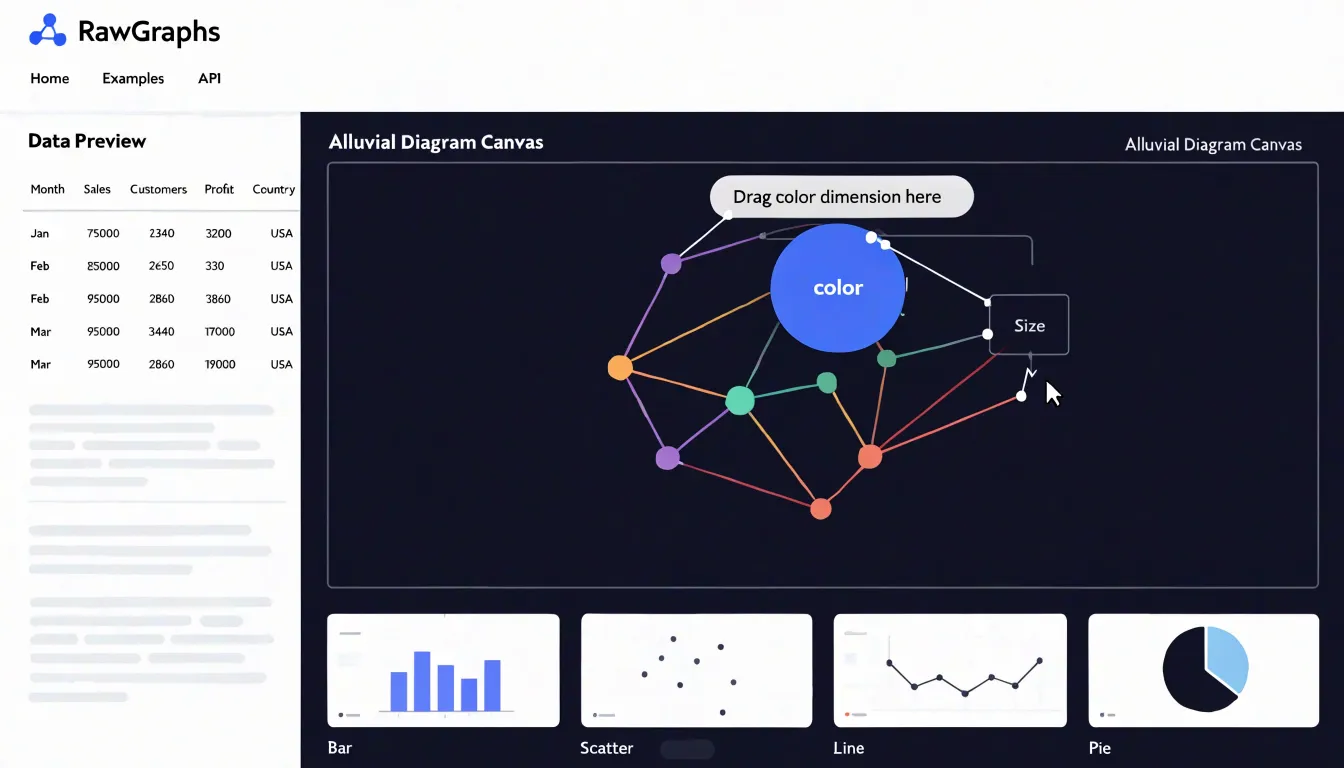
Because the output is vector-based, everything RawGraphs produces is rendered as SVG. Designers can export the chart and open it in tools like Illustrator, Inkscape, or Figma, where individual shapes, labels, and paths can be restyled, recolored, or combined with other artwork. This gives the tool a natural place in a design workflow, since the chart becomes an editable asset rather than a locked image or an embedded widget. The export options also include PNG and JSON, and the SVG path supports further refinement in publication or presentation layouts.
The open-source nature of RawGraphs means the tool runs in a browser, keeps data local to the user’s machine by default, and can be self-hosted or modified by teams that need it. There is no subscription or account requirement, which lowers the barrier for occasional use or for studios working with sensitive data. For designers who think visually but lack programming experience, RawGraphs offers a direct route from a plain data table to a polished, customizable chart that fits neatly into existing design software.
Charticulator
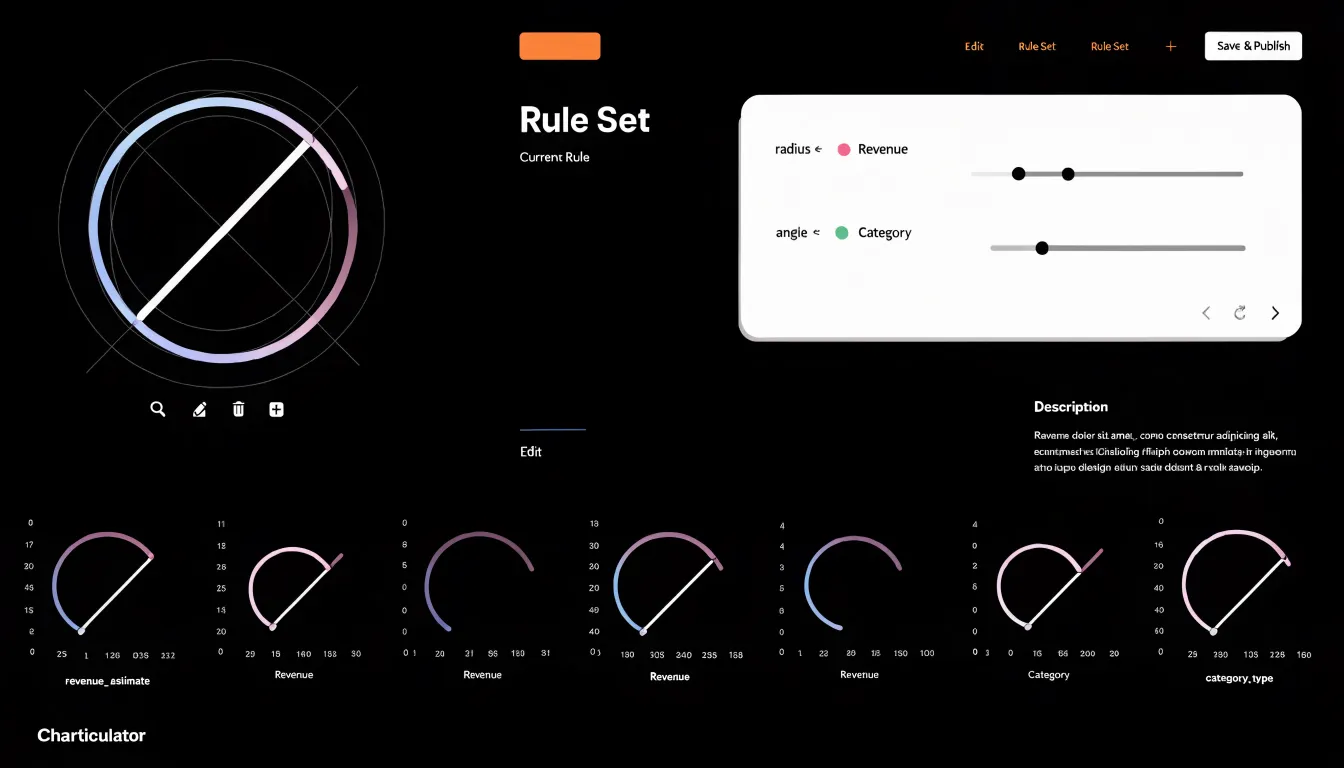
Microsoft’s Charticulator offers a distinctive approach to visualization by letting users construct custom chart layouts through a rule-based system. At its core, Charticulator treats chart design as a process of binding data attributes to visual shapes and glyphs. Users begin by selecting a set of marks, such as rectangles, circles, or lines, and then define how these marks are positioned, sized, and styled based on data fields. This binding process is governed by constraints and rules that specify relationships between data and visual properties. For example, a user might create a glyph composed of a circle and a line, then bind the circle’s radius to a quantitative field and the line’s angle to a categorical field. These bindings are expressed through a visual interface that allows for direct manipulation and immediate feedback.
Charticulator’s rule-based approach extends to layout constraints, enabling the creation of complex compositions like small multiples, nested charts, or custom glyph-based visualizations. Users can define rules for aligning, spacing, and arranging marks, which are then automatically applied across the entire chart. This makes it possible to generate intricate designs that would be tedious to create manually. The tool also supports the creation of reusable templates, so once a custom layout is defined, it can be applied to different datasets. By separating the specification of visual structure from the data itself, Charticulator empowers users to experiment with novel encodings and layouts without programming while maintaining a systematic and reproducible design process.
Plotree
Plotree focuses on turning a plain spreadsheet into a balanced visual composition. Users begin by importing a CSV or Excel file, and the tool reads the tabular structure directly, mapping columns to visual properties without requiring a separate data preparation stage. From there, Plotree offers chart types that go beyond standard bar and line options, guiding users through choosing fields for axes, grouping, and labels so that even a straightforward dataset can be turned into a graphic with a considered layout.
A central part of Plotree’s approach is aesthetic control. Users can adjust color palettes, typography, spacing, and annotation styles to match a publication’s visual identity or a presentation’s tone. These settings are applied consistently across a chart, helping a series of graphics feel like a coherent set rather than a collection of unrelated images. The tool also handles the small details that make a chart feel finished, such as axis formatting, legend placement, and label alignment, reducing the manual cleanup that often follows chart generation.
Output quality is another area where Plotree aims for publication readiness. Exported graphics are designed to hold up in print and on high-resolution screens, with vector or high-DPI options available for final delivery. This matters for researchers, journalists, and analysts who need figures that can move directly from a working file into a report, article, or slide deck rather than an interactive dashboard. Its spreadsheet-first workflow keeps the process familiar, while its styling tools give the finished result a level of craft that plain spreadsheet charts rarely achieve.
Datawrapper
Datawrapper has earned a strong reputation among journalists, analysts, and communications teams who need to publish charts quickly without compromising on quality. The platform is built around a browser-based workflow that keeps the distance between raw data and a finished graphic remarkably short. Users paste or upload their data, choose from a curated set of chart types, and refine labels, colors, and annotations through a straightforward editor. Because the tool handles layout and typography automatically, even users with limited design experience can produce polished results in minutes.
One of Datawrapper’s standout strengths is its responsive styling. Charts are generated as responsive embeds by default, meaning they adapt gracefully to different screen sizes, from wide desktop displays to narrow mobile screens. This matters for anyone distributing content across the web, where a fixed-width graphic can break layouts or become unreadable on phones. The platform also builds in accessibility features, such as automatic alt text generation and color palettes designed to remain distinguishable for viewers with color vision deficiencies, helping publishers meet inclusive design expectations without extra effort.
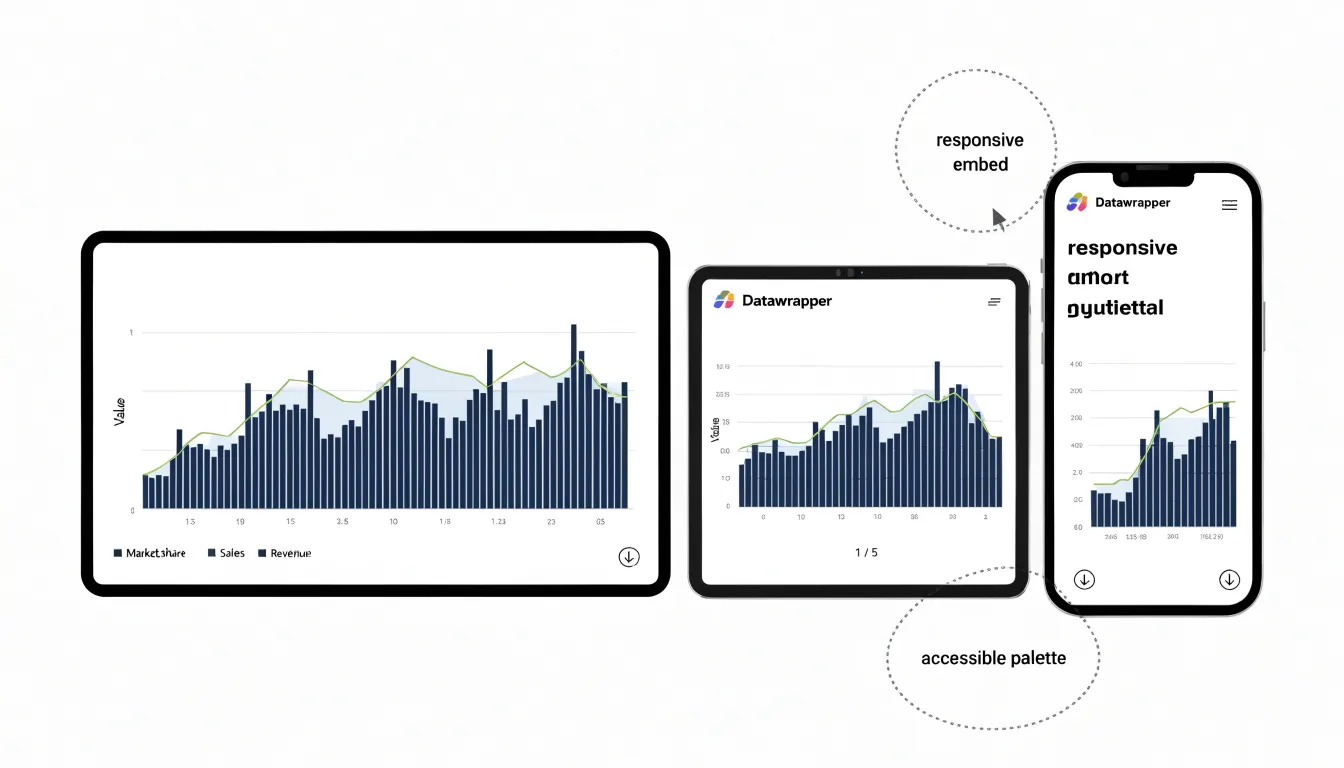
Export options round out the package. Datawrapper supports clean vector export formats, so charts stay crisp at any resolution and slot neatly into print materials, slide decks, and design software. Combined with its speed and its emphasis on accessible, responsive output, Datawrapper serves as a practical alternative to heavier desktop tools for teams that prioritize efficient, publication-ready web charting.
Adobe Illustrator Plugins
Adobe Illustrator plugins expand the native toolset for designers who want to produce charts inside a familiar vector environment. Extensions such as Chartagraph and Datylon allow users to import spreadsheet data and bind it to vector shapes, so bars, lines, and pie segments are generated as editable artwork rather than as static images. Once the data is linked, adjustments to values or categories update the chart geometry automatically, which keeps revisions fast during iterative design work. Plugins like Ai Charts and Scriptographer scripts offer lighter options for simpler graph types, while more specialized modules support statistical layouts such as scatter plots and bubble charts.
The main advantage of chart plugins is continuity of workflow: colors, strokes, type styles, and artboards all remain consistent with the surrounding document, and charts can be grouped, masked, or styled with gradients in the same way as any other vector object. Designers who already rely on Illustrator for brand assets can therefore assemble infographics without exporting to a separate application or converting between file formats. Some plugins also add data-handling features like CSV import, cell-level sorting, and legend generation, reducing manual repetition.
The tradeoff is that each extension carries its own learning curve and licensing model, and complex data transformations may still require external processing before import. Performance can slow on documents containing many linked chart objects, particularly when datasets are large. Despite these limits, Illustrator chart plugins remain a practical route for teams that prioritize visual consistency and precise typographic control over dedicated analytics tools.
Flourish
Flourish occupies a distinct corner of the data visualization landscape, one built around narrative impact rather than chart construction alone. The platform ships with a large library of animated templates covering everything from racing bar charts and line charts that draw themselves into view to scatter plots, projections, and map-based stories. Each template is configured through a visual editor, so a writer or designer can drop in a spreadsheet, adjust labels, colors, and timing, and publish an embeddable graphic without writing code. The animation layer is central to the appeal: transitions guide a viewer’s attention from one state of the data to the next, which makes abstract numbers easier to follow and gives presentations a sense of momentum.
This focus on storytelling has made Flourish a familiar tool in newsrooms, where deadlines are tight and editors need graphics that read clearly on both desktop and mobile. Its templates are tuned for publication contexts, with responsive layouts and embed options that slot into content management systems. Beyond journalism, the same features serve analysts building presentation decks, marketing teams assembling annual reports, and educators who want an explorable visual rather than a static slide.
The template-driven approach lowers the barrier to entry while preserving a professional finish. Users can choose a starting layout, customize branding, and hand off finished pieces as links or embedded frames. Collaboration features and the ability to organize projects into folders help teams manage multiple graphics at once. Flourish also supports a range of data inputs and offers some flexibility for more advanced customization when a template’s defaults are not enough.
Canva
Canva has become a familiar entry point for people who need to produce polished visuals without formal design training, and its chart tools extend that same accessibility to data presentation. The platform treats charts as design objects rather than statistical instruments, which shapes how users interact with them. A person building a quarterly report or a social media post can select from bar charts, line graphs, pie charts, and progress rings, then drop the result directly onto a canvas alongside headings, imagery, and branded color palettes. The drag-and-drop interface means adjustments happen visually: resizing a chart, nudging a data label, or swapping a color requires no knowledge of formulas or layout grids.
For non-designers, the value lies in how little setup the process demands. Canva provides pre-built templates organized around common formats such as presentations, one-page reports, and Instagram posts, so a user begins with a layout that already accounts for spacing, typography, and hierarchy. Charts inherit the palette of the chosen template, keeping the visual language consistent across an entire document or campaign. Editing the underlying numbers happens through a simple data table, and the chart updates in place, letting someone iterate on a figure without rebuilding the graphic.
This approach suits fast, everyday communication: a team lead summarizing weekly metrics, a small business owner sharing sales trends, or a marketer assembling a lightweight infographic. The tradeoff is depth. Canva’s charts cover common chart types well, yet they offer limited control over axis scaling, statistical annotation, and complex multi-series layouts, so the tool fits clear, simple messages better than dense analytical work.
Figma Plugins
Figma has become the central workspace for a large share of UI and product designers, and a growing ecosystem of plugins now lets teams build charts without leaving that canvas. Charts arrive as native, editable layers rather than flat images, so a designer can adjust colors, spacing, and labels using the same tools already in the file.
Plugins such as Chart and Visualis generate vector-based charts from pasted data or manual input. Chart focuses on speed, converting CSV values or typed numbers into bar, line, pie, and area graphics that inherit the document’s typography and color styles. Because the output is vector, resizing and restyling remain straightforward, and components can be detached or regrouped to fit a design system. Visualis takes a similar approach with a broader set of chart types and finer controls over axes, gridlines, and labeling, which suits dashboards and data-dense interfaces. Other plugins fill niche roles, from sparkline generators to maps and progress visualizations.
Designers can iterate on chart appearance alongside the surrounding interface, test different data scenarios, and hand off files where engineers can inspect exact values and layer structure. Styling with shared color tokens keeps charts consistent with the rest of the product, and plugins that support live data links reduce the manual work of refreshing numbers.
There are limits worth knowing. Plugin output varies in how faithfully it maps to production charting libraries, so teams often redraw final charts in code. Complex datasets can exceed what a plugin handles comfortably, and heavy plugin use can affect file performance. For early-stage exploration, mockups, and presentation-ready visuals, though, Figma plugins offer a fast, low-friction path from raw numbers to editable charts inside the design file.
Vizzlo
Vizzlo approaches chart creation with an emphasis on automated formatting, handling much of the layout and typographic decision-making on the user’s behalf. When you begin a chart, Vizzlo applies built-in rules that govern spacing, alignment, color application, and font choices, so the resulting graphic looks consistent without requiring manual adjustment of every element. This automation extends to label positioning, legend placement, axis formatting, and the proportions between chart elements and surrounding white space, all managed through predefined templates and smart defaults.
For corporate users, Vizzlo includes brand compliance features that let organizations lock in their own color palettes, typefaces, and logo placement, ensuring every chart produced by team members adheres to the same visual identity. Charts can be exported for slide decks, documents, and reports with styling intact. Users select a chart type, input or paste their data, and fine-tune the rendered result with simple controls rather than deep formatting menus. This makes Vizzlo particularly suited to business contexts where numerous charts need to be produced quickly and consistently, such as quarterly reports, marketing summaries, and internal presentations. Because the system enforces shared standards rather than relying on each individual’s judgment, it reduces the risk of visual inconsistency across a team.
D3.js
D3.js gives web developers and data specialists full creative control over every element of a visualization by treating charts as documents built from code. Instead of starting from a template or a preconfigured chart type, users begin with data and write the logic that binds that data to HTML, SVG, or Canvas elements. This data-driven approach lets the developer decide exactly how values map to shapes, colors, positions, and interactions, producing visuals that match a specific design system or answer a very particular analytical question.
The library provides a rich toolkit of methods for selecting elements, joining data to them, applying scales and axes, interpolating transitions, and handling events. Developers can load data from CSV, JSON, or remote APIs, transform it with array utilities, and then render it with fine-grained control over layout and animation. Because the output is standard web technology, the resulting visualizations behave like native parts of a webpage: they respond to resizing, support custom hover and click behavior, and can be embedded in web applications without plugins or proprietary runtimes.
D3.js shines when the visualization requirements are unusual or when off-the-shelf tools cannot express a design idea. Teams that already have JavaScript skills can build bespoke dashboards, interactive explainers, geographic maps, network diagrams, and animated stories. The tradeoff is that every detail, from axis formatting to tooltip behavior, comes from code the user writes, which means a steeper learning curve and more development time than chart builders.
Tableau
Tableau has established itself as one of the most capable platforms for turning complex datasets into interactive business intelligence dashboards. At its core, the software provides enterprise-grade analytics that let teams connect to a wide range of data sources, from spreadsheets and cloud warehouses to live database queries, and then explore that data through drag-and-drop visual exploration. Calculations, trend lines, forecasting, clustering, and statistical summaries are built into the workflow, so analysts can move from raw numbers to actionable insight without exporting to separate tools. This depth makes Tableau well suited to organizations that need to answer layered business questions across sales, operations, finance, and marketing.
What distinguishes Tableau in day-to-day use is the polish of its visual output alongside its analytical power. Analysts can build calculated fields and aggregated measures while using extensive formatting controls for colors, fonts, tooltips, labels, and dashboard layouts to align charts with brand guidelines. Dashboards can combine multiple views, filters, and parameters into a single interactive surface, and users can drill down or highlight related data points with a click. Story points add a narrative layer, guiding executives and stakeholders through a sequence of insights rather than leaving them to interpret isolated charts.
Infogram
Infogram offers a workflow built around connecting directly to live data sources, allowing marketing teams to generate infographics and reports that update automatically as the underlying numbers change. Rather than manually importing a spreadsheet each time a campaign metric shifts, users can link a chart or map to a database feed via supported integrations, API access, or scheduled data pulls, letting the platform refresh the visual whenever the source data updates.
For marketing teams, this real-time capability changes how recurring deliverables like social media summaries, ad spend breakdowns, and audience reports are produced and shared. A dashboard summarizing weekly performance can pull from a live feed and publish updates on its own, so stakeholders see fresh figures whenever they open the link. Interactive elements such as hoverable data points and filterable charts let viewers explore the numbers themselves instead of reading a static snapshot.
The platform also supports embedding these visuals into websites, emails, and presentations, extending a single live data connection across multiple channels. Teams can create a template once, bind it to a data source, and reuse the structure for different campaigns or time periods. Collaboration features allow designers and analysts to work on the same project, with the live data layer handled separately from the visual styling.
Exporting Vector Assets
Exporting vector assets is the final step that determines whether a custom chart looks sharp in every context or falls apart the moment it leaves the design tool. SVG is the most versatile format for digital work, since it scales losslessly on screens of any resolution, remains editable in code, and stays lightweight enough for web embedding. When exporting to SVG, convert text to outlines only when font licensing or consistency demands it; otherwise keep live text so collaborators can still adjust labels. Flatten stray layers, remove hidden objects, and run the file through an optimizer to strip metadata without altering geometry.
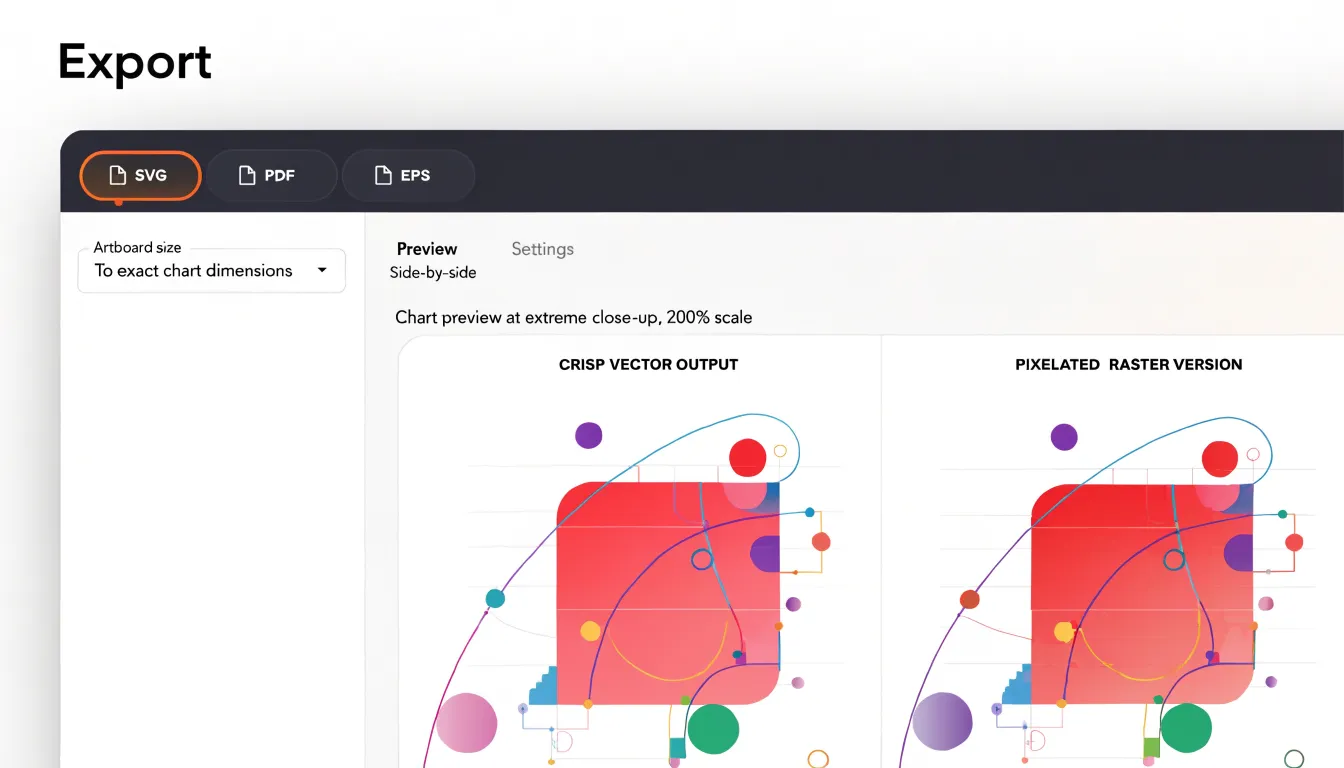
For print workflows, EPS and PDF are the standard choices. PDF preserves vector geometry and embeds fonts reliably, which makes it ideal for charts headed to professional printing or academic publication. EPS remains useful for legacy layout software, though it handles transparency and modern color spaces less gracefully, so check that gradients and drop shadows survive the conversion.
A few practices apply across all three formats:
- Set the artboard to the exact chart dimensions to avoid clipping or unexpected whitespace.
- Define colors in the appropriate space: RGB for screen exports, CMYK for print-bound PDFs.
- Verify that strokes do not scale disproportionately by disabling the relevant option or converting thick strokes to outlines where needed.
- Open each exported file in a neutral viewer to confirm that text, strokes, and transparency render as intended, and keep a master layered source so future edits do not require rebuilding from scratch.
Free vs. Paid Tools
When building a visualization workflow, the cost of software quickly becomes a practical consideration alongside the feature list. Free and open-source tools offer an attractive entry point for teams working with limited budgets. Applications built on open standards often provide core charting, mapping, and design capabilities without licensing fees, and the source code remains accessible for customization. Community forums, shared plugins, and public documentation supply ongoing support at no charge. The trade-off appears in the time required to learn the interface, configure integrations, and troubleshoot unexpected behavior. Teams with technical members can absorb this learning curve comfortably, while others may find the hidden labor outweighs the savings.
Paid subscription platforms bundle convenience into the price. Vendor support channels, curated template libraries, guided onboarding, and regular feature updates reduce the friction of adoption. For organizations that bill client hours or coordinate large teams, the predictability of a maintained product often justifies the recurring cost. Subscription tiers also scale with seat counts, so growing teams can forecast expenses with reasonable accuracy.
A useful comparison weighs three factors: the total cost of ownership, the pace of the project timeline, and the skill mix inside the team. Open-source tools excel in long-horizon projects where customization matters and internal expertise exists. Subscription platforms suit fast-moving teams that prioritize reliability and vendor accountability. Many groups settle on a hybrid model, using free tools for prototyping and exploration while reserving paid licenses for production work.
Choosing a Tool
A structured decision framework helps teams avoid adopting visualization software that looks impressive in a demo but stalls under real project conditions. Start by assessing the technical skill profile of the people who will actually build and maintain the charts. Teams with strong programming backgrounds can lean toward libraries that expose code-level control, while teams dominated by designers, analysts, or communications staff benefit from interfaces that emphasize direct manipulation over scripting. Map the spectrum of chart types the team produces most often, from standard bar and line charts to complex network diagrams or custom annotated graphics, and verify that a candidate tool handles the core set natively rather than through fragile workarounds.
Project timelines form the second axis. Short-turnaround work, such as weekly reporting or campaign dashboards, rewards tools with templates, reusable components, and quick data connections. Longer exploratory projects, where a single infographic may evolve over weeks, justify the learning curve of more flexible software. Consider how much time the team can realistically invest in onboarding, since a powerful tool adopted without training often produces worse outcomes than a simpler one used confidently.
Design customization rounds out the framework. Ask how closely output must match brand guidelines, editorial illustration styles, or publication standards. Tools built around chart defaults speed up routine work, while tools with granular control over typography, spacing, color, and annotation suit teams whose visual identity is a central deliverable. Weigh customization against maintenance: heavily customized charts can become difficult to update when data changes or when the original author leaves.
Finally, combine the three axes into a shortlist scored against each dimension, then run a pilot with one real project per candidate. This keeps the decision grounded in observed workflow fit rather than feature checklists.
Frequently Asked Questions
What is RawGraphs and who is it for?
RawGraphs is an open-source tool for designers who want to create custom visualizations without writing code, starting from pasted or uploaded data. It produces SVG output that can be edited in Illustrator, Inkscape, or Figma, with PNG and JSON export options also available.
How does Charticulator build custom chart layouts?
Charticulator binds data attributes to visual shapes and glyphs, with constraints and rules governing positioning, sizing, and styling. Users can define layout rules and reusable templates, separating visual structure from the data itself.
Does Datawrapper create responsive and accessible charts?
Datawrapper generates responsive embeds by default and includes accessibility features such as automatic alt text generation and color palettes designed to remain distinguishable for viewers with color vision deficiencies. It also supports clean vector export formats.
What are the limitations of Figma chart plugins?
Figma plugin output varies in how faithfully it maps to production charting libraries, so teams often redraw final charts in code. Complex datasets can exceed what a plugin handles comfortably, and heavy plugin use can affect file performance.
How do I choose between free and paid data visualization tools?
Free and open-source tools avoid licensing fees but require time to learn, configure, and troubleshoot, while paid subscription platforms bundle support, templates, onboarding, and updates. A useful comparison weighs total cost of ownership, project timeline, and the team’s skill mix.
How do I choose the right data visualization tool for my team?
Start by assessing the team’s technical skill profile and the chart types it produces most often, then consider project timelines and how much design customization is needed. Combine those factors into a shortlist and run a pilot with one real project per candidate.
Tony Astor
Tony writes about data visualization and the tools people use to build charts and dashboards. More about Data Illustrator