Dashboard vs Report: Which Does Your Audience Need?
 By Tony Astor ·
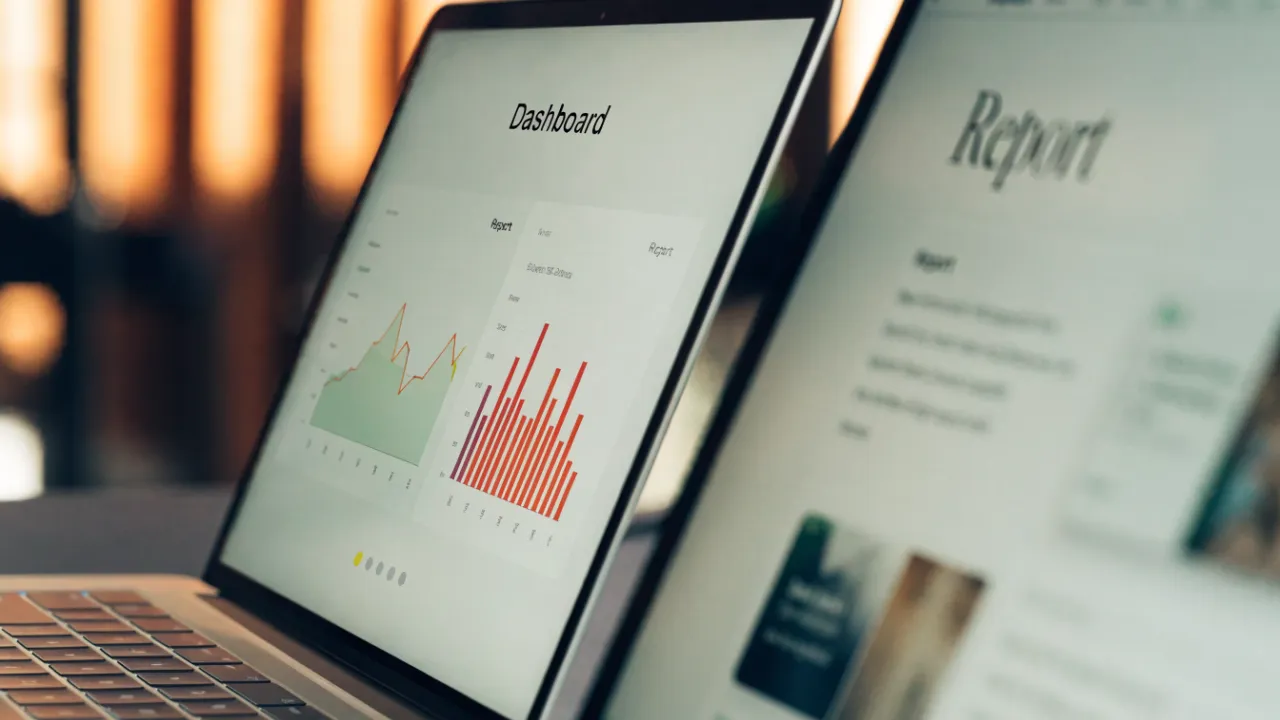
Dashboard vs Report
A dashboard is a live, refreshable view of current operational KPIs built for at-a-glance monitoring and rapid decisions, while a report is a curated, periodic record of historical data with validated figures and narrative explanation. Dashboards prioritize speed and interactivity; reports prioritize depth, context, and reproducibility.
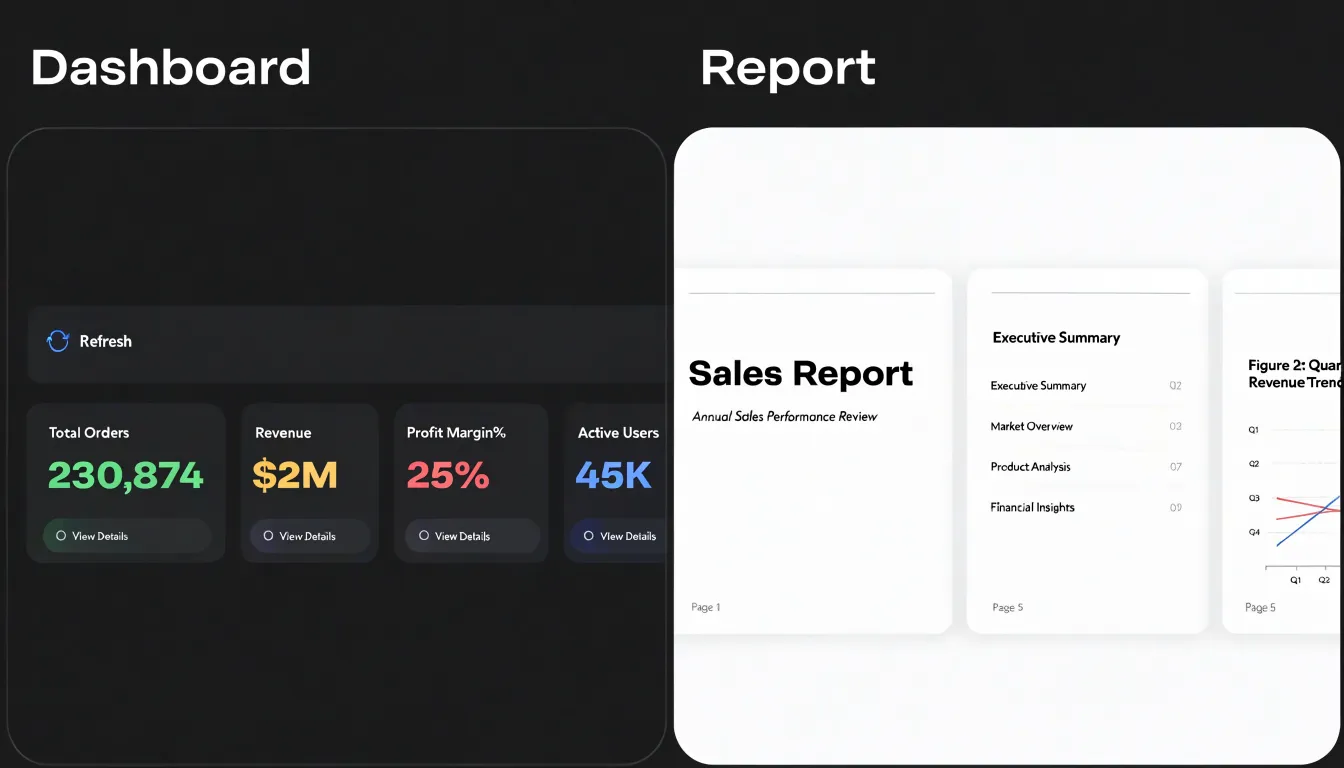
Table of Contents
- Data Communication Basics
- Dashboard
- Report
- Speed vs Depth
- Live Updates vs Static Snapshots
- Interactivity
- Context and Narrative
- Target Audience
- Executive vs Operational vs External Audiences
- Resource and Time Costs
- Maintenance
- Common Pitfalls
- Hybrid Solutions
- Measuring Engagement
- Decision Framework and Action Steps
Data Communication Basics
People process data through two distinct cognitive channels that place very different demands on working memory. Because working memory is limited, every element a viewer must hold in mind while interpreting a display draws on that finite capacity. A chart asking readers to compare values across many categories, track legends, and decode color scales stacks up cognitive load quickly. A well-designed display reduces extraneous load through practical choices such as sorting categories by value, labeling series directly rather than through a legend, and removing decorative elements that compete for attention.
Visual processing follows predictable patterns. Readers typically enter a page at a dominant element, sweep across in familiar reading order, and gravitate toward preattentive cues like color, size, and position that register before conscious analysis. Contrast directs the eye first, which means the most important figure should carry the strongest visual weight. Grouping and proximity signal relationships without explanation. When these cues align with the intended hierarchy, comprehension happens almost effortlessly; when they conflict, viewers spend effort reorienting instead of understanding.
Charts and narrative text also serve different reading modes. A chart supports scanning: the eye moves between marks, compares lengths and positions, and forms a rapid impression of patterns, outliers, and trends. Narrative text supports sequential reading, where each sentence builds on the previous one to explain causality, qualification, and context. Skimmers jump between headings, figures, and captions, often reading the chart before the surrounding prose. Placing clear titles and annotations near the visuals, writing captions that state the takeaway, and structuring the page so the chart and text reinforce the same conclusion rather than duplicating each other helps accommodate both modes.
Dashboard
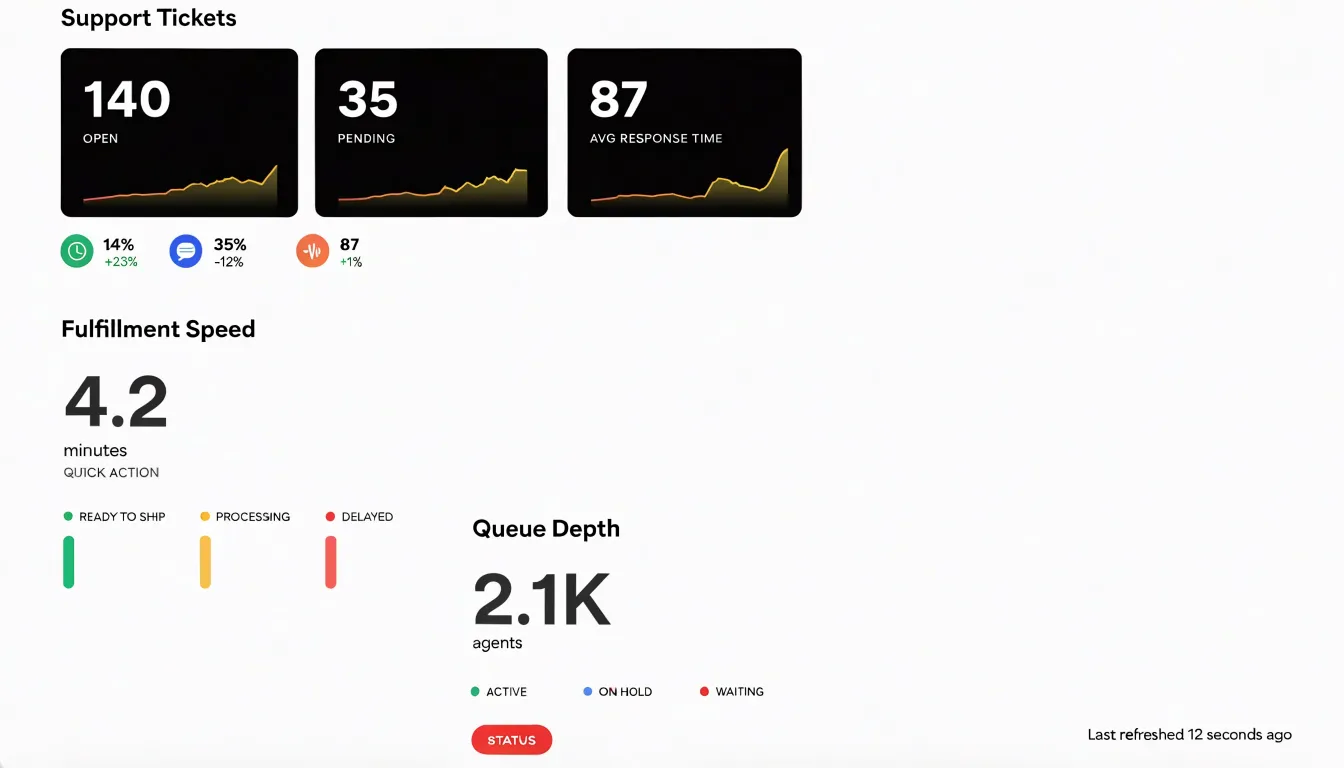
A dashboard is a live window into current operations, pulling data from multiple sources into a single view that refreshes as conditions change. This constant flow of current information makes the dashboard the natural home for operational KPIs: the counts, rates, and thresholds that reveal how well day-to-day activities are running right now.
Charts and gauges condense large volumes of data into visual signals that can be read at a glance, allowing someone to spot a spike in support tickets or a dip in fulfillment speed without running a new query. Because the numbers are current and the display is built for scanning, a manager can notice a problem, weigh the options, and act within minutes rather than waiting for a scheduled report. Tactical choices—such as reallocating staff during a busy shift, adjusting inventory thresholds, or flagging a bottleneck for immediate attention—depend on this timely visibility. Dashboards support rapid, repeated decision-making, keeping teams aligned around live figures so they can respond to conditions as they unfold.
Report
Structured periodic reports serve as the curated record of what happened and why it matters. A report assembles historical context around a defined time frame, drawing on data that has been validated and reconciled before publication. This preparation gives readers a stable foundation for interpretation, since the figures have passed through review and carry notes describing their source systems and calculation methods.
Periodic cadence—whether weekly, monthly, or quarterly—establishes a consistent baseline against which successive editions can be compared. Readers can trace how a metric has moved across reporting cycles and connect present figures to prior benchmarks and the decisions those earlier numbers informed.
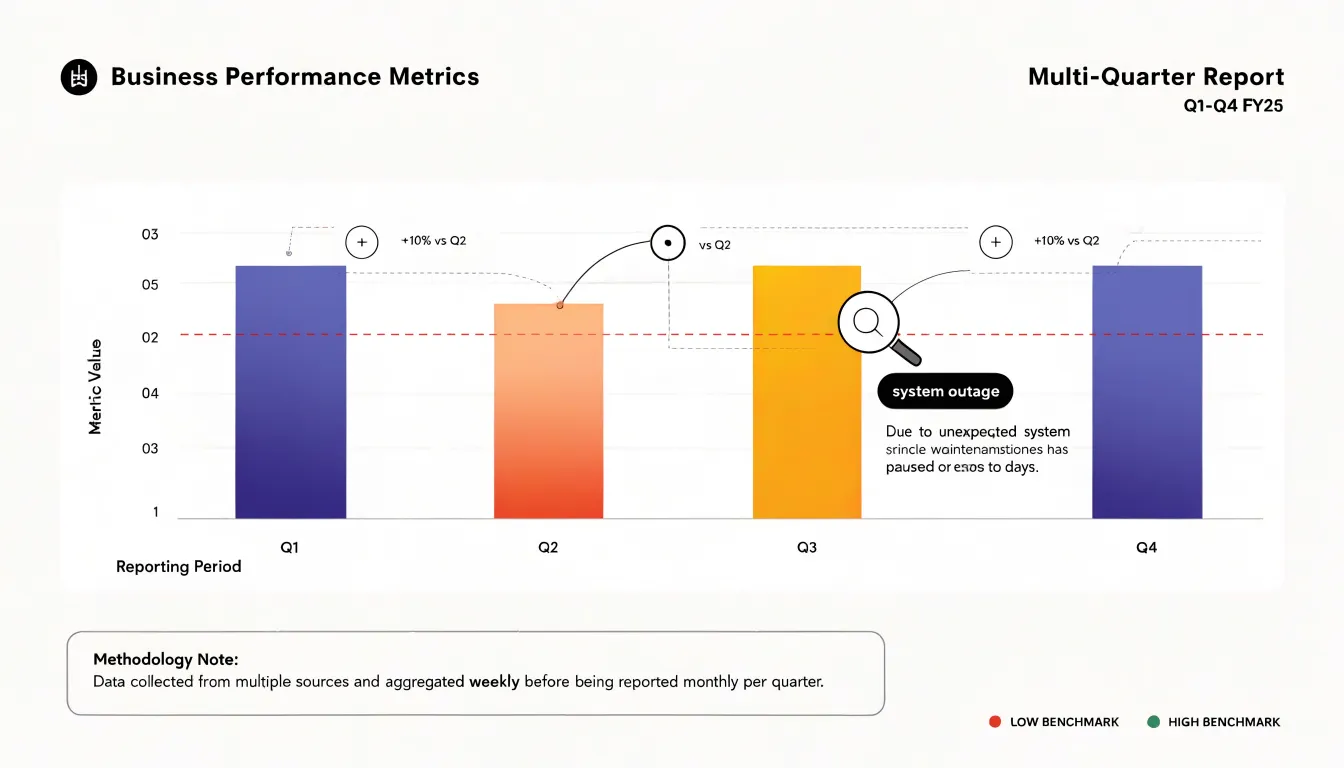
Reports also carry the interpretive work required when trends depart from expectation. A thorough report documents anomalies, identifies the likely drivers behind an unusual spike or dip, and distinguishes genuine shifts from one-off events such as system outages, seasonal distortions, or reclassifications. Narrative commentary, footnotes, and appendices anchor each observation in supporting evidence so a reader can follow the reasoning from raw figures to conclusion. This explanatory depth supports planning, audit, and governance activities, where the reader needs to understand methodology and assumptions rather than simply observe current values.
Speed vs Depth
Speed and depth represent two distinct reader needs. At one end, readers often require immediate, at-a-glance visibility to confirm whether operations are on track, a threshold has been crossed, or attention is needed right now. Dashboards excel here by surfacing critical signals in seconds without requiring navigation or deep interpretation.
At the other end, high-stakes evaluations demand comprehensive analytical breakdowns. Readers need to understand how figures were derived, what assumptions underlie them, and how different variables interact over time. This depth cannot be compressed into a single number or a sparkline; it requires paragraphs, tables, and explanatory text that guide the reader through layered analysis, which reports are built to provide.
Readers move between these modes frequently, and effective information systems manage the tension between them rather than treating it as a flaw. A dashboard might offer drill-down links to detailed reports, while a comprehensive report might open with an executive summary that delivers key metrics at a glance. Allocating information based on when readers need speed versus depth ensures that neither urgency nor rigor is sacrificed.
Live Updates vs Static Snapshots
Data freshness is a critical design decision based on the latency requirements of the decisions being made. Live updates, where data streams automatically and visualizations refresh in near real-time, are valuable when the cost of stale data is high and actions must be taken immediately. Operational monitoring of server health, financial trading, and logistics tracking benefit from live feeds because delays can lead to missed opportunities or increased risk. Automated updates reduce manual refreshes and ensure users see the latest state.
However, live data is not always the best choice. Static snapshots capture data at a fixed point in time, providing a consistent, reproducible view. When users need to compare performance across periods, analyze trends, or share findings, a snapshot ensures everyone looks at the same numbers. This stability is essential for official records or meetings where live updates would introduce variability and complicate interpretation, especially when data sources are prone to delays or corrections. Many organizations combine both: live dashboards for real-time monitoring and static reports for historical analysis.
Interactivity
Interactivity turns a static display into a working surface users can manipulate directly:
- Filters let users narrow a view to a specific segment, such as a region, product line, or time window.
- Drill-downs allow someone to start with a summary figure and move progressively toward the underlying detail.
- Tooltips add explanation on demand, surfacing exact values and definitions without cluttering the main view.
These features shorten the distance between a question and an answer and reduce the burden on analysts who would otherwise field every follow-up. A sales manager who notices an unusual dip can filter to that week, drill into the underlying accounts, and check tooltip values without waiting for a new query. Interactivity also lets different audiences view the same underlying data through their own lens.
However, every filter and drill path is a decision point. Non-technical users can quickly lose track of which selections are active or how the current view relates to the whole, making a dashboard with too many controls feel like a puzzle. Good design addresses this with clear indicators of active filters, a visible reset option, sensible default states, concise tooltips, and drill paths that follow the questions people actually ask.
Context and Narrative
Numbers rarely speak for themselves. A 12% decline in monthly revenue carries little meaning until someone explains what moved it, which segment drove the change, and whether it reflects a seasonal pattern or a genuine shift. Raw data presents outcomes without causes: a reader seeing a spike in support tickets cannot tell whether a product release introduced a defect, a marketing campaign drove an unusual volume of new users, or a reporting rule changed. Written explanation closes that gap by naming the drivers and stating the takeaway so readers do not have to guess.
Several techniques weave explanatory context directly into data displays:
- Annotations placed beside a chart can mark the week a pricing change took effect and describe the resulting effect on conversion, showing cause and outcome together.
- Short narrative summaries at the top of a dashboard can state the headline finding in a sentence or two before the reader encounters the charts.
- Callout boxes can flag anomalies and explain whether they represent a data quality issue or a real event worth attention.
- Footnote-style commentary beneath a table can describe methodology changes that would otherwise distort year-over-year comparisons.
Target Audience
Choosing between a dashboard and a report starts with mapping the user personas who will consume the information. Assess their technical literacy and primary goals:
- Technical comfort: Some users are comfortable with filters, drill-downs, and complex visualizations, while others prefer simple, pre-digested summaries with clear takeaways.
- Primary goals: Users may need to monitor performance in real time, explore trends to make decisions, or comply with regulatory reporting requirements.
Evaluating these factors prevents teams from building a tool that looks impressive but fails to match how its audience actually works.
Executive vs Operational vs External Audiences
Different stakeholders approach the same data with different questions, time budgets, and context. Matching format to the reader requires planning for three distinct layers that can draw from the same underlying data:
- Executive layer: An executive scanning a summary before a board meeting needs headline numbers, trend direction, and exceptions to see whether performance is on track. A dashboard built for daily operational triage will overwhelm them with granularity.
- Operational layer: An operations manager needs granular data and filters to act—seeing which queues are backing up, where cycle times are drifting, and which specific transactions or regions are driving a variance. A one-page executive summary leaves them without the levers to act.
- External layer: A client or partner needs a polished, self-explanatory, and defensible document that leaves no room for ambiguity. Internal working views rarely translate directly into client-facing materials, which require curated framing, clear labeling, and context that internal users already carry in their heads.
Treating these as separate deliverables prevents the common failure of trying to serve every reader with a single artifact.
Resource and Time Costs
Dashboards and manual reports follow very different cost curves. Building a dashboard demands a concentrated upfront investment of engineering effort. Specialists must provision the data pipeline, model and clean source data, configure a visualization tool, and design and test the interface. A production dashboard typically passes through requirements gathering, data validation, user acceptance testing, and deployment—each consuming developer hours alongside ongoing costs for platform licenses, query compute resources, and maintenance when upstream schemas change.
Recurring manual reports distribute labor across time rather than concentrating it at the start. Analysts pull data, paste it into a template, verify numbers, and circulate the result on a fixed cadence. A weekly report taking four hours to produce consumes over 200 analyst hours a year, repeating indefinitely unless automated. This cost is harder to see because it appears as routine operational work rather than a project line item, and it scales with every new request or audience segment. Reports also carry hidden rework when definitions drift or when a recipient questions a figure and the analyst must trace it back through the source data. Comparing the two means weighing a front-loaded engineering outlay against an ongoing stream of skilled labor.
Maintenance
Maintaining data tools is an ongoing discipline built on data governance, which defines who owns each dataset, who can access it, and what quality standards apply. Clear ownership ensures an identifiable person is responsible for investigating and correcting issues when numbers look wrong.
Long-term maintenance requires managing three common failure points:
- Broken API connections: When a third-party service changes an endpoint, a token expires, or a vendor deprecates a field, pipelines can stop delivering fresh data without a dramatic alarm. Teams should monitor every feed, set alerts that name the failing connection and the responder, and document a fallback process—such as pulling from a secondary source or pausing downstream outputs.
- Shifting baseline metrics: What counted as a qualified lead last year may not match this year’s criteria, and seasonality or pricing changes can shift familiar benchmarks. Regular reviews of metric definitions keep targets grounded in current reality.
- Dashboard drift: Over time, owners add filters, remove tiles, change date ranges, and adjust calculations, causing a dashboard to diverge from the report it was designed to support. Version history, change logging, and periodic reconciliation keep the two aligned.
A lightweight maintenance calendar covering feed checks, metric reviews, and reconciliation keeps the system trustworthy.
Common Pitfalls
Several recurring design mistakes can undermine both dashboards and reports:
- Cluttered layouts and chart junk: Squeezing every metric onto one screen creates visual noise. Decorative gradients, heavy gridlines, shadows, and 3D effects add visual weight without adding meaning. Group related metrics, remove redundant tiles, give sections breathing room, and strip away any element that does not help interpret the data.
- Missing labels and units: A trend line without a labeled axis leaves readers guessing at magnitude and timing. Use consistent labeling, stated units, and sensible scales so the view is accessible to first-time readers.
- Walls of text: Long narrative paragraphs bury key findings. Use short annotations, clear headings, and bulleted summaries instead.
- Inconsistency across views: Shifting colors, terminology, and formatting from page to page confuses readers. Establish a simple visual style guide early in the design process, and test the finished layout with real users before release to catch clutter and missing context the author has overlooked.
Hybrid Solutions
Hybrid solutions blend the strengths of dashboards and reports within a single workflow:
- Live widgets in scheduled emails: A weekly summary email can embed a headline chart of current pipeline, a small table of open tickets, or a gauge of yesterday’s service levels pulled from a live dashboard source. Recipients get the familiarity of an emailed report with up-to-the-minute numbers at generation time, kept readable through compact, focused widgets.
- Printable summary views in interactive tools: Analysts can filter a dashboard by region, timeframe, or product line and generate a clean, paginated PDF or print layout. These views explicitly record context that screens leave implicit, such as active filter settings, generation timestamps, and short chart interpretations.
Both patterns must draw on the same metrics and calculated fields as their interactive parent so numbers stay consistent across formats. Teams should also decide how often emailed widgets refresh relative to the live tool and label timestamps clearly.
Measuring Engagement
Tracking how people use data deliverables reveals whether the tools deliver value and justify ongoing investment:
- View counts show overall traffic and how often tools are accessed.
- Interactive click events capture how users engage with filters, drill-downs, and controls, showing which features are popular and which are ignored.
- User feedback via simple mechanisms like thumbs-up/down buttons or comment boxes provides qualitative insight into usefulness and usability.
- Adoption rates measure how many target users have accessed the tool at least once, indicating initial reach.
- Active usage over time (such as weekly or monthly active users) distinguishes regular users from one-time visitors.
Combining these metrics diagnoses specific problems: high views with low interaction suggest users are looking but not finding value, while low adoption points to awareness gaps.
Decision Framework and Action Steps
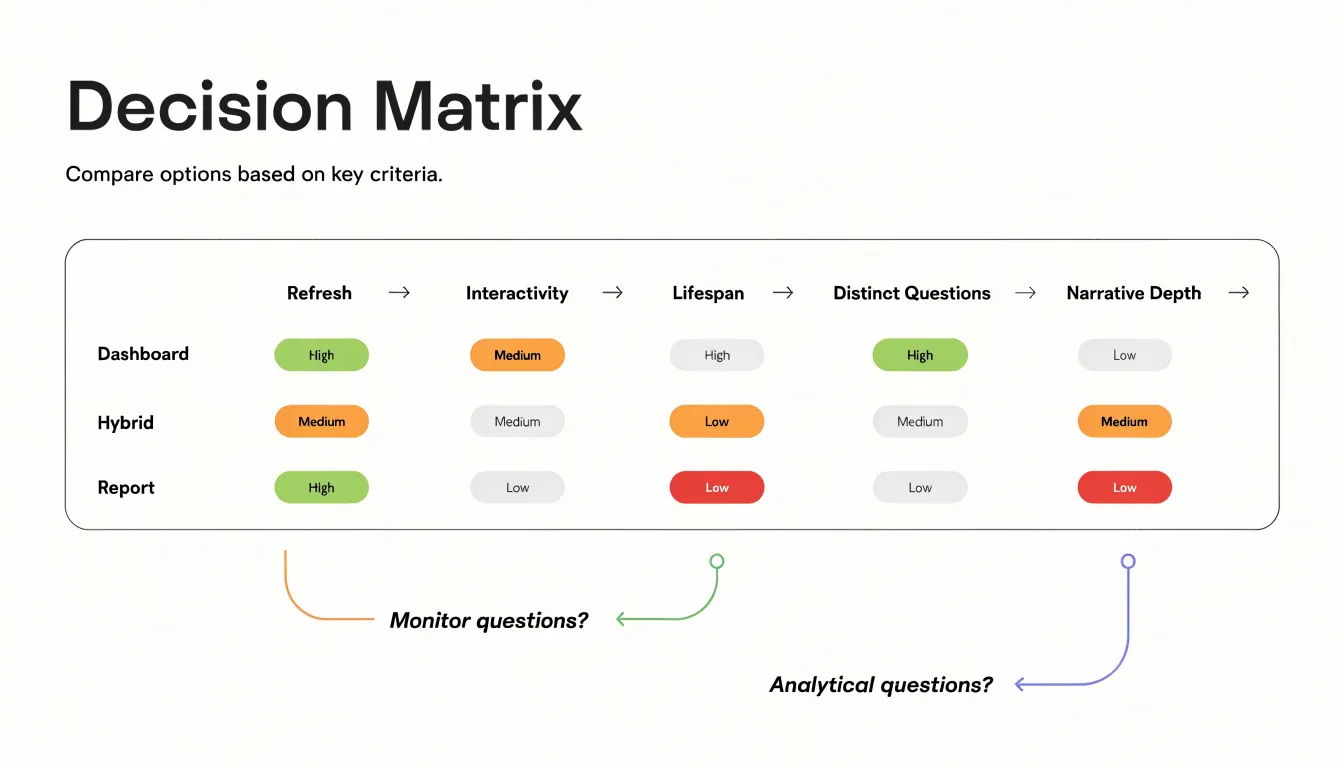
A structured framework helps teams choose between a dashboard, a report, or a hybrid without debating preferences in the abstract:
- Identify the core question: Write the audience’s primary question in a single sentence and determine whether it requires continuous monitoring of current conditions or a definitive answer at a specific point in time.
- Map the audience and cadence: Align with stakeholder expectations (e.g., weekly executive scans, live operational queues, or quarterly analyst reviews).
- Score a decision matrix: Rate the request (high, medium, or low) across five factors: data refresh requirements, need for interactivity, expected lifespan of the artifact, number of distinct questions involved, and level of narrative explanation required.
- Run a pre-commit checklist: Confirm data sources are available and trustworthy, verify audience access to the delivery channel, estimate build and maintenance effort, assign a post-launch owner, and set a review date to evaluate usage data.
- Document the rationale: Record why the format was chosen in a short note for future stakeholders.
Frequently Asked Questions
What is the difference between a dashboard and a report?
A dashboard is a live window into current operations that pulls data from multiple sources into a single view and refreshes as conditions change. A report is a structured periodic record that assembles historical context around a defined time frame using validated and reconciled data.
When should I use a dashboard instead of a report?
Use a dashboard when the core question requires continuous monitoring of current conditions and rapid, repeated decision-making. Use a report when the audience needs a definitive answer at a specific point in time or a comprehensive analytical breakdown with methodology and assumptions.
Are live updates always better than static snapshots?
No. Live updates are valuable when the cost of stale data is high and actions must be taken immediately, but static snapshots provide a consistent, reproducible view for comparing periods, analyzing trends, sharing findings, and official records or meetings.
What are common mistakes to avoid when designing dashboards and reports?
Common pitfalls include cluttered layouts and chart junk, missing labels and units, walls of text, and inconsistency across views. The article recommends grouping related metrics, removing redundant tiles, using clear labeling, and establishing a simple visual style guide.
How do dashboards and reports differ in cost and maintenance?
Building a dashboard demands a concentrated upfront investment of engineering effort plus ongoing platform, compute, and maintenance costs. Recurring manual reports distribute labor across time, and maintenance for data tools includes data governance, monitoring broken API connections, reviewing shifting baseline metrics, and preventing dashboard drift.
Can I combine dashboard and report features?
Yes. Hybrid solutions can use live widgets in scheduled emails and printable summary views in interactive tools, as long as both draw on the same metrics and calculated fields and clearly label timestamps and refresh frequency.
Tony Astor
Tony writes about data visualization and the tools people use to build charts and dashboards. More about Data Illustrator