Dashboard Design Principles for Clear, Usable Dashboards
 By Tony Astor ·
Dashboard Design Principles for Clear, Usable Dashboards
Dashboard design principles focus on matching chart types to data relationships, establishing visual hierarchy through size, placement, and contrast, and placing key KPIs prominently with trend context. Restrained color palettes, legible typography, balanced whitespace, and reduced cognitive load improve clarity, while consistent components, clear navigation, responsive layouts, and accessibility ensure dashboards stay usable across devices and audiences.
Table of Contents
- Choosing the Right Charts
- Visual Hierarchy
- Key Performance Indicators
- Simplifying Color Palettes
- Smart Typography
- Whitespace Balance
- Optimizing Data Density
- Reducing Cognitive Load
- Designing for Consistency
- Crafting Clear Navigation
- Interactive Filtering Tools
- Mobile-Friendly Adaptability
- Accessibility First
- Avoiding Common Pitfalls
- Overview
Choosing the Right Charts
Choosing the right chart begins with identifying the relationship your data contains and the question your users need answered. Bar charts excel at comparing discrete categories, such as sales by region or ticket volume by support team. Their strength lies in making relative magnitude immediately visible through length, which the eye judges accurately. Horizontal bars accommodate long category labels, while vertical bars suit time-based categories with short labels. Line graphs serve continuous data and highlight trends over time. When the analytical need centers on direction, rate of change, or seasonality, a line chart lets users trace movement across an uninterrupted series. Scatter plots reveal relationships between two quantitative variables, exposing correlation, clustering, and outliers that summary statistics can obscure.
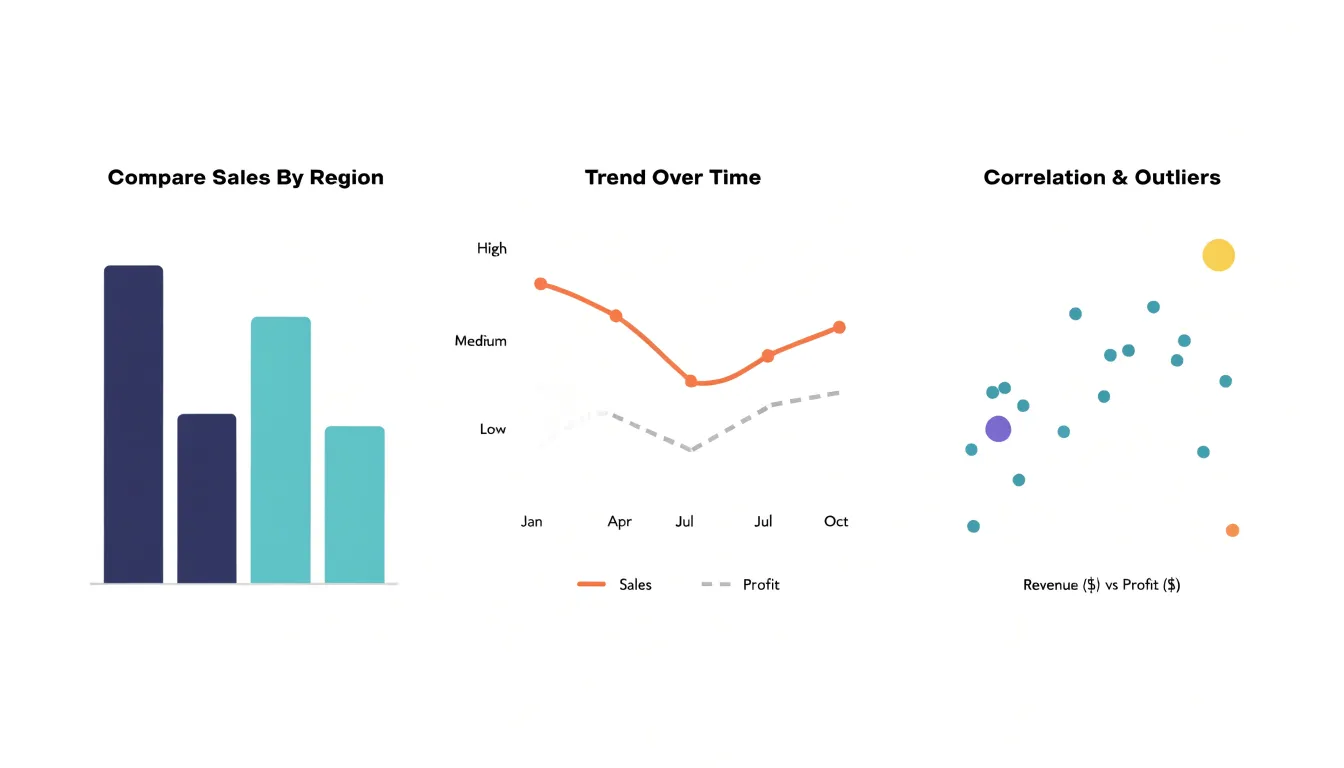
Start by defining the analytical question. Comparison across categories points toward bars; change over time suggests lines; correlation between measures calls for scatter plots. Consider the volume of data points as well. Lines become cluttered with too many series and work best with a handful of related trends, while scatter plots gain value as observations increase. Bar charts remain readable with a moderate number of categories, though grouping should be kept to two or three series for clarity.
The audience’s analytical needs shape the choice further. Executive viewers scanning for headline comparisons benefit from straightforward bar charts, whereas analysts exploring relationships need scatter plots and the ability to hover or filter for detail. Think about what decisions the chart supports: a bar chart answers which category leads, a line answers where things are heading, and a scatter plot answers whether two measures move together. Matching chart type to the underlying data relationship keeps dashboards honest, since each visual style reveals certain patterns and conceals others. A deliberate match ensures users interpret the data correctly and act on it with confidence.
Visual Hierarchy
Visual hierarchy is the deliberate arrangement of dashboard elements so that the viewer’s eye lands on the most valuable information first, without any conscious effort. Size is the most immediate tool for establishing that order. A single large KPI tile or trend chart placed prominently signals its importance before a user reads a word, while smaller supporting metrics recede into a secondary layer. The key is proportionality: when every card is the same size, nothing stands out, and the viewer is left to scan arbitrarily. Reserving the largest visual weight for the one or two metrics that drive decisions gives the dashboard an instant focal point.
Placement reinforces size. In most reading cultures the eye enters a page at the top left and moves across and down, so the top band of the dashboard should carry the headline numbers or the primary trend. Supporting breakdowns and detail tables belong lower, where they can be consulted after the overview registers. Grouping related elements near one another also helps, since proximity implies relationship and spares the viewer from hunting across the canvas for connected figures.
Contrast completes the system. Color, saturation, and weight differences separate what matters from what merely provides context. A single accent color applied to the metric of interest, against a restrained neutral palette elsewhere, pulls attention precisely where intended. Strong contrast between text and background aids legibility, while subtle contrast distinguishes chart lines from gridlines. Sparing use of contrast preserves its power; when everything is colored or emphasized, the eye has no anchor.
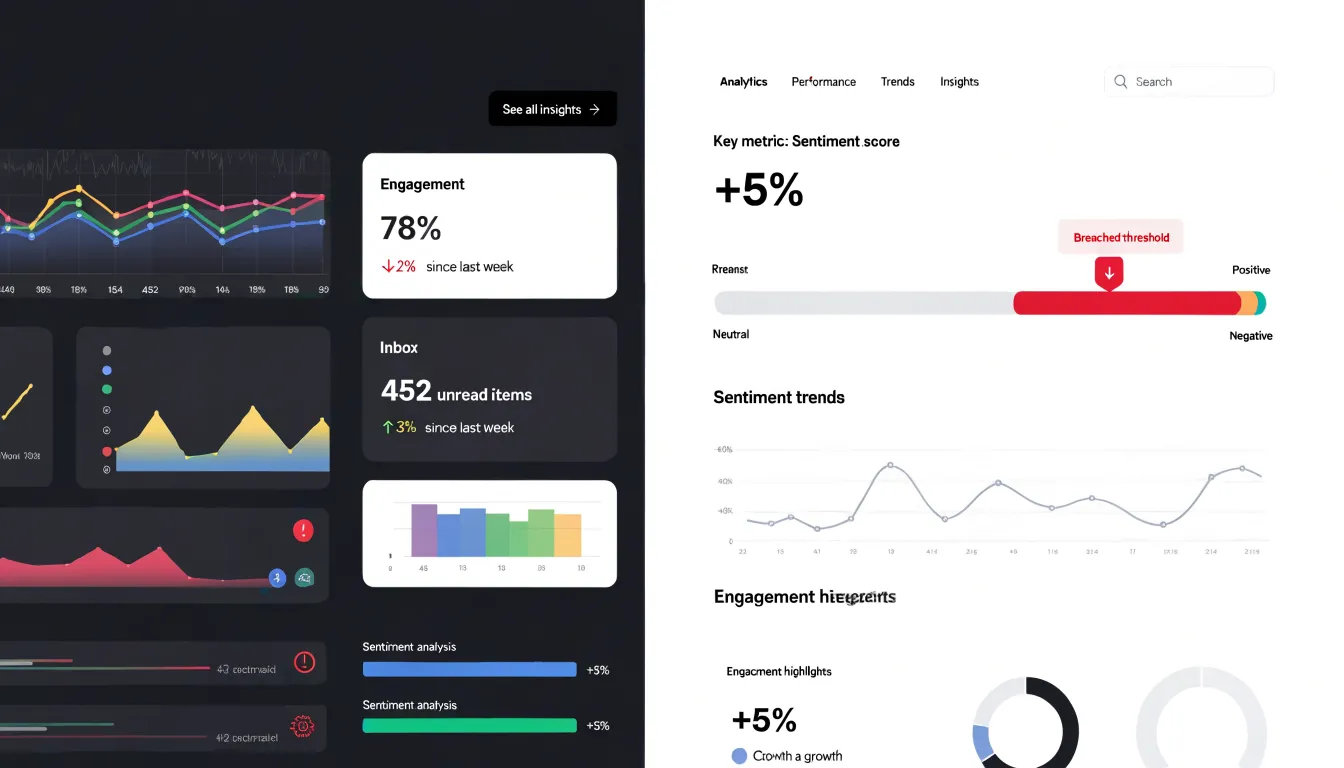
These three techniques work together. Size establishes rank, placement sets the reading path, and contrast sharpens the distinctions along it. Tested together, they let a viewer absorb the state of the business within seconds of load.
Key Performance Indicators
Key Performance Indicators — Put Crucial Numbers Front and Center: Best practices for designing high-impact KPI cards with trend indicators and context near the top of the screen.
KPI cards are the first thing users see when they open a dashboard, so they must instantly answer the question: “How are we doing?” Place your most critical KPIs at the top of the screen, where they command attention without requiring scrolling. Each card should feature a single, large number that represents the current value, making it easy to read at a glance. Pair this number with a clear label that states what is being measured, using plain language that avoids jargon.
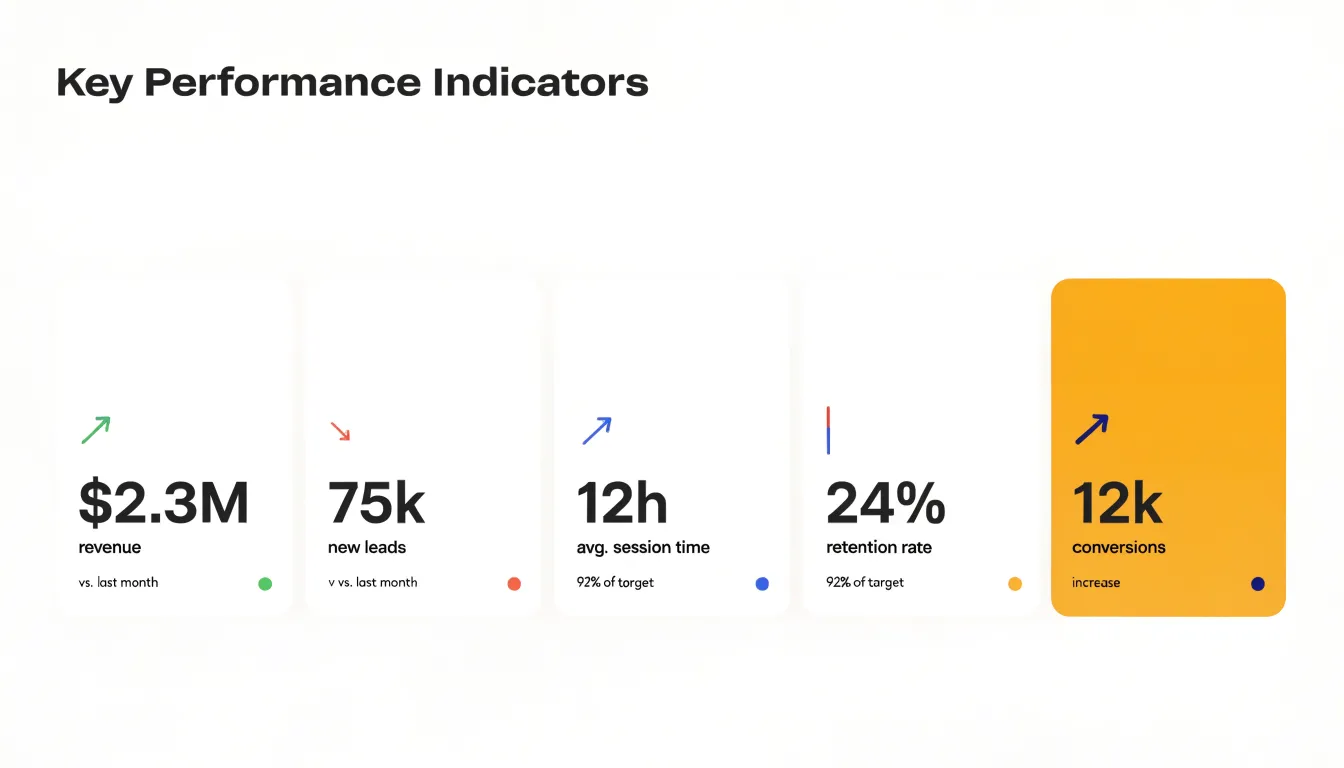
Trend indicators add essential context by showing how the value has changed over time. A small arrow or sparkline can indicate whether the metric is trending up or down, while a percentage change conveys the magnitude of the shift. Use color strategically to signal positive or negative movement, but always include a textual label for accessibility. For example, a green arrow with “+8%” might indicate growth, but a text label “increase” ensures clarity for all users.
Context is equally important. A number alone can be misleading, so include a comparison such as the target, the previous period, or the same period last year. This helps users understand whether the value is good, bad, or simply normal. For instance, “$1.2M revenue” gains meaning when paired with “vs. $1.0M last month” or “92% of target.”
Design each card with ample white space to avoid clutter, and use a consistent visual style across all cards for a cohesive look. Limit the number of KPI cards to the top three to five metrics to prevent information overload. By following these practices, you ensure that KPI cards serve as effective, high-impact summaries that guide decision-making from the moment the dashboard loads.
Simplifying Color Palettes
A restrained color palette gives a dashboard its clarity. When every chart, card, and label carries its own hue, the eye has no reliable way to tell what deserves attention. The practical approach is to build the interface on neutral backgrounds, such as white, light gray, or soft beige, and reserve saturation for a small set of accent shades that carry specific meaning. Neutrals recede and let the content come forward, while accents act as deliberate signals rather than decoration.
In practice, a dashboard might use two or three accent colors in total. One shade marks alerts and threshold breaches, another indicates a change in status, and a third draws the eye to the critical data point a viewer should read first. Because these shades appear rarely, their presence is instantly meaningful. A red bar stands out on a gray canvas in a way it never could on a page crowded with competing colors. Consistency reinforces this effect: if red always means a breach, viewers learn to scan for red and trust what it tells them.
Color should also work alongside position, size, and labeling, since a small share of viewers will struggle to distinguish certain hues. Pairing an accent with an icon or text label keeps the meaning intact for everyone. Sequential palettes for charts benefit from the same discipline, using a single hue that varies in lightness rather than a rainbow of unrelated colors, which makes magnitude easier to compare.
Simplification is an ongoing habit. Periodically review the dashboard for colors that crept in without a purpose, such as decorative backgrounds or charts that each default to a different scheme, and return them to neutral. Each color that remains should answer a question about what it communicates. A palette built this way keeps the dashboard calm, directs attention to what matters, and makes every accent count.
Smart Typography
Typography is the delivery mechanism for every number on a dashboard, and the right font choice determines whether those numbers register instantly or demand effortful scrutiny. Start with a legible sans-serif typeface designed for screen reading at small sizes, one with open counters and clearly differentiated character shapes so that similar-looking digits such as 3 and 8 or 5 and 6 remain distinguishable at a glance. Tabular figures, where every numeral occupies the same horizontal width, keep columns of values aligned vertically so that readers can scan comparisons down a table without their eyes drifting. This alignment matters enormously in KPI tiles and data grids, where a single misaligned digit can suggest a magnitude difference that does not exist.
Font weight functions as a second layer of hierarchy within a chosen family. Reserve the boldest available weights for the headline metrics that answer the central question of the dashboard, and step down to regular or medium weights for supporting context such as labels, units, and comparison figures. This creates a clear visual gradient where the largest and heaviest numbers draw attention first, with secondary values settling quietly behind them. Avoid stacking multiple weight variations on the same tile, since too many gradations blur the distinction between primary and secondary information.
Line height and letter spacing deserve equal care. Give numbers generous breathing room so dense tables do not feel cramped, and add slight tracking for all-caps labels to improve readability at small sizes. Test every typeface at the actual display size and resolution your users will encounter, because a font that reads beautifully on a large monitor can turn muddy on a laptop screen or projector. Consistency across the entire dashboard family, from axis labels to tooltips to summary tiles, reinforces familiarity and lets the data speak with one clear voice.
Whitespace Balance
Strategic margins and padding are essential for preventing visual fatigue and organizing related data sets into distinct functional groups. When every pixel is filled with charts, numbers, or labels, the eye has no rest, and users quickly become overwhelmed. By intentionally leaving empty space—often called whitespace or negative space—around and between elements, you create a visual rhythm that guides the viewer through the dashboard. This breathing room allows each data point to stand out and reduces cognitive load, making it easier to scan and interpret information.
Whitespace also serves as a powerful grouping tool. By placing larger gaps between different functional areas—such as separating sales metrics from marketing metrics—you create clear boundaries that help users understand which data belongs together. This spatial separation eliminates confusion and enables faster comprehension. Consistent margins around the dashboard’s edges and between widgets create a polished, professional look while ensuring that no element feels cramped. Padding within cards or containers gives content room to breathe, preventing text from touching borders and making numbers easier to read.
When whitespace is used deliberately, it transforms a cluttered screen into an organized, inviting interface that users can navigate effortlessly. Remember that whitespace is not wasted space; it is an active design element that enhances clarity, focus, and usability. Aim for a balance where data is grouped logically and the eye can move smoothly from one section to the next, with enough empty space to avoid overwhelming the viewer.
Optimizing Data Density
Data density is a critical factor in dashboard design, directly influencing how easily users can extract insights. A dashboard that is too sparse wastes screen space and forces users to navigate between multiple views, while an overcrowded one overwhelms the senses and obscures patterns. The goal is to find the right balance for your audience. Expert users often prefer high-density views that pack many metrics into a single screen, allowing them to spot correlations and anomalies quickly. These users have the domain knowledge to interpret complex visualizations and can handle more information at once. For them, a dense dashboard acts as a powerful command center.
However, even expert views require essential context to avoid misinterpretation. Context includes labels, units, time frames, comparisons, and thresholds. Without these, data points are meaningless. The challenge is to provide context without cluttering the view. Progressive disclosure is a key technique here. It involves presenting the most important information first and revealing additional details on demand. For example, a high-density view might show key performance indicators with sparklines, and hovering over a sparkline could reveal a tooltip with exact values and trends. Clicking on a metric could open a detailed breakdown. This approach keeps the initial view clean and focused while still making deeper information accessible.
Another technique is layering. Use visual hierarchy to guide the eye: primary metrics in larger fonts or bolder colors, secondary metrics in smaller or lighter tones. Group related metrics using subtle backgrounds or borders to create visual chunks that are easier to process. Interactive filters and drill-downs allow users to customize the density to their needs, hiding less critical data when they need a simplified view. By combining these strategies, you can design dashboards that are both informative and usable, catering to a range of user expertise without sacrificing clarity.
Reducing Cognitive Load
Cognitive load refers to the mental effort a viewer expends to interpret what is on the screen. Every redundant gridline, heavy border, and decorative flourish adds a small demand on attention, and those demands accumulate quickly when a dashboard contains dozens of charts and tables. A viewer scanning a screen crowded with competing lines and boxes must work harder to separate the signal from the surrounding noise. Removing that noise lets attention flow directly to the data that matters, so patterns, outliers, and trends become apparent within seconds rather than requiring close study.
Gridlines are a frequent offender. A light or infrequent grid serves as a useful reference for reading values; a dense web of dark lines competes with the data series for visual priority. Keeping gridlines faint, sparse, or limited to the axis where precise reading matters preserves their utility without letting them dominate. Heavy borders around charts and panels create the same problem, framing every element as equally important and fragmenting the page into a patchwork of boxes. In most cases whitespace alone separates components effectively, and a border adds little beyond visual weight.
Decorative elements deserve similar scrutiny. Drop shadows, gradients, background images, and ornamental icons occupy pixels without conveying information. Each one asks the viewer to decide, however briefly, whether it carries meaning. Stripping these elements produces a cleaner surface where color, size, and position serve only the data. This restraint also makes the deliberate choices more powerful: when a single color highlight or a bold number stands out, it does so against a quiet field and draws the eye immediately.
The payoff shows up in decision speed. Viewers who can read a dashboard at a glance spend their time interpreting results rather than decoding layout, which shortens the path from data to action and reduces the risk of misreading the display.
Designing for Consistency
Consistency in dashboard design begins with a shared visual language. When every screen uses the same typography, color palette, spacing, and interaction patterns, users can transfer their understanding from one view to the next without relearning how to read the interface. This uniformity reduces cognitive load and builds trust, as the dashboard feels like a cohesive product rather than a collection of disparate parts.
A component library is the foundation of this consistency. By defining reusable elements such as buttons, cards, charts, and form controls, teams ensure that each instance of a component behaves and appears identically across all screens. This library should include specifications for states like hover, active, and disabled, as well as guidelines for responsive behavior. When a new feature is needed, designers and developers draw from this library, avoiding one-off solutions that fragment the experience.
Beyond individual components, a design system documents the broader patterns that govern layout and interaction. This includes grid structures, spacing scales, and rules for data visualization. For example, a design system might specify that all charts use the same color sequence for categories, or that filters always appear in the same location. Such standards make dashboards predictable and easier to navigate.
Standardized patterns also extend to user flows. Consistent placement of navigation, search, and actions means users develop muscle memory, increasing efficiency. When patterns are reused, teams also reduce design and development time, as they are not reinventing solutions for common problems.
Maintaining consistency requires governance. A central team or designated owner should manage the component library and design system, reviewing contributions and updating documentation. Regular audits help identify deviations and ensure that all screens adhere to the established standards. Ultimately, consistency is not about rigid uniformity but about creating a seamless experience where users can focus on their data and tasks, confident that the interface will behave as expected.
Crafting Clear Navigation
Clear navigation is the connective tissue of an effective dashboard. Users rarely arrive with a single fixed question; they start with a summary and progressively narrow their focus toward the specific figures that matter. Structuring logical drill-down paths lets that exploration unfold naturally. A high-level metric can act as an entry point, inviting a click that reveals the underlying breakdown by region, product line, or time period. Each successive layer should answer the question raised by the previous one, so momentum builds and users never feel stranded in unfamiliar territory. When drill-down paths mirror the way people actually reason about the data, exploration becomes an intuitive conversation with the dashboard rather than a hunt for hidden screens.
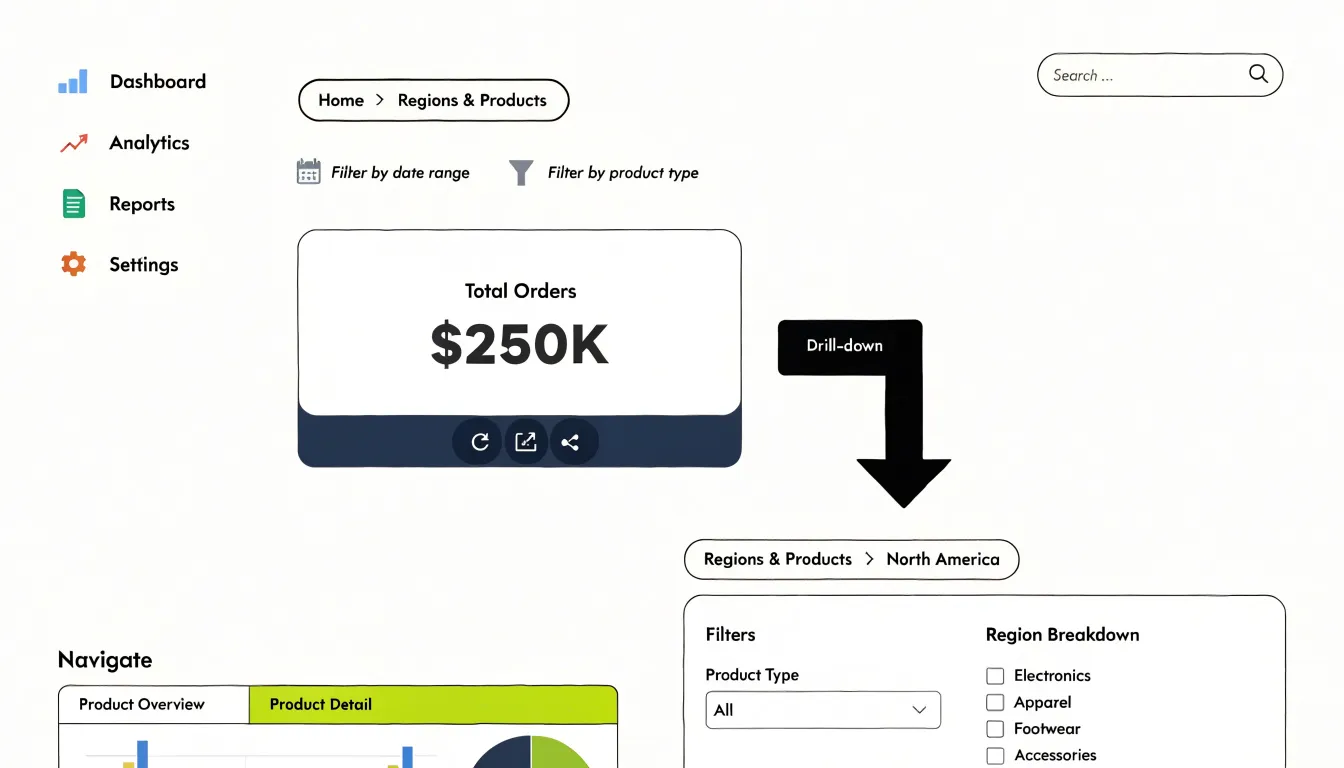
Tab controls offer a complementary way to organize related views without overwhelming a single canvas. Placing comparable reports in adjacent tabs keeps the interface tidy while signaling that related content sits one click away. Tabs work best when labels are precise and the set remains small, so users can hold the whole structure in mind. Sidebars serve a similar organizing role, providing persistent access to categories, filters, or report sections while the main canvas updates in place. A well-designed sidebar gives users a stable anchor as they move through nested layers, reducing the sense that each click launches them somewhere new.
Together, these navigation patterns create a hierarchy that supports both quick glances and deep investigation. Consistent placement, familiar interaction patterns, and visible cues about location and depth all help users maintain orientation. Breadcrumbs, highlighted active states, and clear back paths reassure people that they can retrace their steps. The payoff is seamless movement through data: users spend their attention interpreting insights instead of deciphering the interface, and nested reporting layers become a route to answers rather than a maze.
Interactive Filtering Tools
Interactive filtering tools give users the ability to shape a dashboard around the questions they are actually asking. A well-designed dashboard anticipates variety in its audience, and that variety shows up most clearly in the filters people reach for. Global filters applied across an entire dashboard offer a reliable foundation here. When a user selects a region, product line, or business unit once and every chart responds, the dashboard behaves as a coherent whole and spares the user from repeating the same selection on a dozen separate visualizations.
Date pickers complement global filters by anchoring the data in time. Preset ranges such as the last seven days, the current quarter, or year to date cover the most common reporting rhythms, while a custom range option handles the less frequent but important ad hoc analysis. Clearly displaying the active date range keeps everyone reading the charts with the same timeframe in mind.
Interactive search tools serve a related purpose by letting users locate specific records, accounts, or categories within a larger dataset. Search works best when it offers suggestions as the user types and applies consistently across the views that share the underlying data. The design goal throughout is dynamism with clarity: filtered views should update promptly, the active filters should remain visible so users always know what they are looking at, and a single control should reset everything back to the default view. When these tools work together, each user can tailor the dashboard to their own responsibilities without ever leaving the shared, governed source of truth.
Mobile-Friendly Adaptability
A dashboard that performs well on a large monitor can become unusable on a smartphone if its layout is fixed to a wide canvas. Mobile-friendly adaptability begins with a responsive grid that defines the page in relative units such as percentages and flexible fractions rather than fixed pixel widths. When the grid uses fractional columns and auto-fit tracks, components reflow naturally as the viewport narrows: a four-column row of KPI cards becomes two columns on a tablet and a single stacked column on a phone. Breakpoints should be chosen by observing where the content actually breaks rather than by targeting specific device models, so the layout responds to the space available. Container queries extend this idea by letting individual widgets resize according to their own allocated space, which keeps charts and tables readable inside any column width.
Touch-friendly controls matter just as much as the grid. Interactive elements need tap targets of roughly 44 to 48 pixels, with generous spacing between adjacent links, buttons, and filters to prevent accidental activation. Charts should respond to tap and swipe gestures, with tooltips that appear on touch rather than hover alone, and legends or filter panels should collapse into expandable drawers that free up screen space. Complex desktop elements such as wide data tables can transform on small screens into card-based summaries or horizontally scrollable regions with a clear visual cue. Typography and padding should scale with the viewport so text stays legible without pinching and zooming.
Testing the design on actual devices at multiple widths, including in portrait and landscape orientation, reveals overflow, cramped controls, and hidden content before users encounter them. Prioritizing the most important metrics at the top of the mobile stack ensures the smallest screens still deliver the dashboard’s core value.
Accessibility First
Accessibility is the foundation on which every other dashboard design decision rests. A layout that looks polished in a design mockup can still fail the people who depend on it most, so accessibility needs to be built in from the first wireframe rather than patched in later. The starting point is WCAG compliance, which provides a tested framework for contrast ratios, text resizing, keyboard navigation, and focus states. Aiming for WCAG 2.1 AA as a baseline gives teams concrete thresholds to design against and reduces the risk of excluding users with low vision or motor impairments.
High-contrast themes deserve particular attention: offering a toggle between light and dark modes helps users who are sensitive to glare, while ensuring that text and background pairs maintain sufficient contrast in both themes keeps content legible in any lighting condition. Screen-reader support means structuring the dashboard with semantic landmarks, meaningful headings, and descriptive labels so that charts and data tables are announced in a logical order. Interactive filters and buttons should carry accessible names and states so assistive technology can communicate their purpose.
Equally important is colorblind-friendly color pairing. Roughly one in twelve men has some form of color vision deficiency, so charts that rely on red and green alone to signal good or bad performance will leave a meaningful share of users unable to interpret the data. Pairing color with shape, pattern, or direct labels, and choosing palettes that remain distinguishable under the most common forms of colorblindness, makes the message clear regardless of how a user perceives color. Building these practices into the design system turns accessibility into a repeatable habit rather than a one-off checklist.
Avoiding Common Pitfalls
Fancy visuals represent one of the most persistent pitfalls in dashboard design, because they often look impressive in a demo while quietly undermining the reader’s ability to interpret the data. Three-dimensional charts are a frequent offender. When bars or pie slices are rendered with depth, perspective causes values to appear larger or smaller than they actually are, and the tilted viewing angle makes it difficult to align a bar’s top edge with the axis. A 3D pie chart in particular can make a small slice at the front look dominant while a larger slice at the back recedes into the distance. Readers end up estimating rather than reading exact values, and different viewers can draw different conclusions from the same chart.
Overly complex gauge meters create a related problem. Gauges borrow the visual language of a car’s speedometer, which suggests precision and urgency, yet they consume a large amount of screen space to display a single number. When several gauges are packed onto one dashboard, the reader must scan across dials with different scales, colored zones, and needle positions, comparing arc lengths instead of simply reading values side by side. A plain number with a small trend indicator usually communicates the same information faster and with less room for misreading.
Decorative graphics introduce a third layer of distortion. Shadows, gradients, background illustrations, and ornamental icons may make a dashboard feel polished, but they add visual noise that competes with the data for attention. Worse, decoration can encode meaning accidentally: a textured background behind a chart can make filled areas appear denser than they are, and drop shadows can blur the boundary between data marks and their surroundings. The guiding test is simple. Every visual element should either represent data or help the reader locate and understand it. Anything that does neither is a candidate for removal, and removing it usually makes the dashboard both clearer and more credible.
Overview
Before a single wireframe is drawn, the design team needs a clear picture of who will use the dashboard and what they need it to accomplish. This begins with identifying target user personas: the distinct groups of people who will open the dashboard regularly, the decisions they make with it, and the questions they bring to it each day. An executive checking quarterly performance has different informational needs from an operations analyst monitoring live inventory levels, and an on-call support lead responding to incidents has different needs again. Documenting each persona in concrete terms, including their role, their familiarity with data, and the frequency and context of their use, gives the design a stable reference point for every later decision about layout, metrics, and interactivity. Persona research can draw on interviews, support tickets, existing analytics, and direct observation of current reporting workflows.
Alongside personas, the team should define the dashboard’s primary operational goals. These are the specific tasks the dashboard exists to support: spotting outliers that require intervention, comparing regional performance, tracking progress against a target, or confirming that a process is running within normal bounds. Stating these goals explicitly, and limiting the list to a small number of priorities, keeps scope in check and prevents the dashboard from becoming a catch-all display of every available metric. Each goal translates later into a concrete question the interface must answer at a glance.
With personas and goals documented, the team gains a shared vocabulary for prioritizing content, choosing appropriate visualizations, and testing whether the finished dashboard actually serves its users. This groundwork costs relatively little effort at the start and prevents expensive rework once design and development are underway.
Frequently Asked Questions
How do I choose the right chart for my dashboard?
Start by defining the analytical question: comparison across categories points toward bar charts, change over time suggests line graphs, and correlation between two quantitative variables calls for scatter plots. Keep line charts to a handful of related trends and grouping to two or three series for clarity.
What makes a dashboard visually easy to scan?
Use size, placement, and contrast together: reserve the largest visual weight for the one or two metrics that drive decisions, and place headline numbers or the primary trend in the top band. A restrained palette with a single accent color helps pull attention precisely where intended.
How many KPI cards should a dashboard have?
Limit KPI cards to the top three to five metrics to prevent information overload. Place the most critical KPIs at the top, and give each card a single large number, a clear label, trend context, and a comparison such as a target or previous period.
How can I make dashboard colors accessible for colorblind users?
Avoid relying on red and green alone to signal good or bad performance, since roughly one in twelve men has some form of color vision deficiency. Pair color with shape, pattern, or direct labels, and choose palettes that remain distinguishable under common forms of colorblindness.
How should dashboards adapt to mobile screens?
Use a responsive grid with relative units so components reflow as the viewport narrows, such as a four-column KPI row becoming two columns on a tablet and a single stacked column on a phone. Interactive elements need tap targets of roughly 44 to 48 pixels, and designs should be tested on actual devices at multiple widths and orientations.
What dashboard elements should I remove to reduce cognitive load?
Remove redundant gridlines, heavy borders, decorative drop shadows, gradients, background images, and ornamental icons that occupy pixels without conveying information. Keep gridlines faint, sparse, or limited to the axis where precise reading matters, and let whitespace separate components instead of heavy borders.
Tony Astor
Tony writes about data visualization and the tools people use to build charts and dashboards. More about Data Illustrator