Column Chart: Vertical Bars for Comparing Categories
 By Tony Astor ·

Column Chart
A column chart uses vertical bars to compare quantities across categories, with each column starting from a shared zero baseline so equal value differences appear as equal height differences. Keep categories manageable, sort columns by value or natural sequence, use one fill color, and reserve a different hue to highlight a specific category.
Table of Contents
Column Chart
Vertical bars give a column chart its expressive power, because the height of each column maps directly onto a quantity that readers can see and compare at a glance. To make that comparison intuitive, each column should begin from a shared baseline, usually zero, so that equal differences in value appear as equal differences in bar height. Keep the number of categories manageable, and order the columns deliberately—either by value from largest to smallest or by a natural sequence such as time—so the eye can move through the data in a predictable direction. Consistent spacing between columns, with modest gaps between bars, helps the reader treat each bar as a separate unit while still seeing the group as a whole.
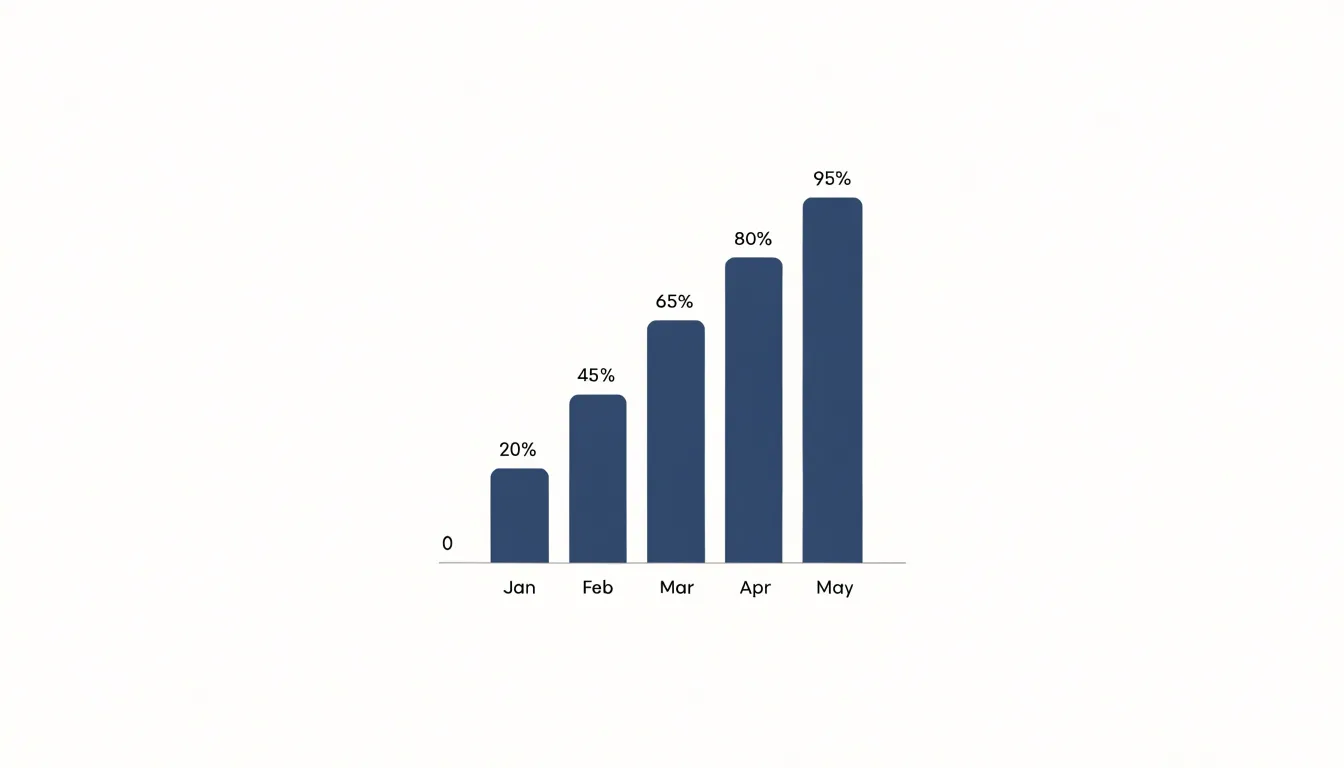
Color and labeling carry much of the communication load. Use a single fill color for most columns so height remains the primary signal, and reserve a different hue only for the specific category you want to draw attention to. Place category labels horizontally beneath the baseline where space allows, rotating them only when necessary. Value labels at the top of each column, or a clean gridline scale along the vertical axis, give readers precise numbers without cluttering the chart.
When magnitude differences are large, tall bars visibly dominate; when differences are subtle, starting the scale at zero and adding data labels keeps small gaps legible. Avoid slicing columns into stacked segments unless the total and its parts both matter, since stacking complicates direct height comparison.
Categorical Data
Categorical data forms the backbone of any column chart, as each column represents a distinct category. The integrity of the visual representation depends on how well those categories are defined and organized. Begin by examining your raw dataset for inconsistencies: misspellings, varying capitalizations, extra spaces, and synonymous labels can all fragment what should be a single category. For example, “New York”, “new york”, and “NY” might all refer to the same location, but without standardization they will appear as three separate columns, distorting the comparison. A systematic cleaning process—such as using lookup tables or fuzzy matching—helps unify these variants into a single, consistent label.
Next, ensure that categories are mutually exclusive. Overlapping categories, such as “0-18” and “18-25”, create ambiguity and can lead to double-counting or misassignment of data points. Define clear boundaries for each category and verify that every data point falls into exactly one category. This often requires re-examining the raw data to resolve edge cases, such as values that fall exactly on a boundary.
Grouping also demands attention to granularity. Too many categories can clutter a column chart and obscure patterns, while too few can oversimplify and hide important distinctions. If you need to highlight broad trends, aggregate smaller categories into an “Other” group, but do so judiciously to avoid losing critical information. For ordinal categories (e.g., “Low”, “Medium”, “High”), maintain the natural order in the chart to facilitate interpretation.
Finally, document your categorization decisions. A clear record of how raw values were mapped to final categories ensures reproducibility and transparency for audiences who need to trust your findings.
Single Series
A single-series column chart is the simplest and most legible way to compare one measure across multiple discrete groups. Because every column encodes the same variable, the viewer’s eye only needs to judge relative height, which makes ranking, spotting outliers, and noticing gaps almost instantaneous. Practical examples appear constantly in everyday reporting:
- A retail manager plotting monthly revenue across store locations, with a single bar per branch, so the best and weakest performers stand out.
- A human resources team charting average employee tenure by department to see where retention is strong and where it lags.
- A city planner displaying the number of new building permits issued per neighborhood.
- A product analyst showing daily active users per platform to compare adoption across environments.
In each case, every column represents one value, with category names along the horizontal axis and the measured quantity on the vertical axis. Consistent color across all columns reinforces that a single measure is being compared; using a different color for each bar implies a distinction between series and adds noise without adding information. By limiting the chart to one measure, the designer avoids the interpretive confusion that arises when several variables compete for attention, making the single-series column chart a dependable default for dashboards, executive summaries, and public-facing reports.
Multi Series
When a chart needs to carry more than one measure, the multi-series column chart divides each category slot into equal sub-slots, one for every dataset, so that bars belonging to the same series share a consistent position and color across the entire axis. A reader can then scan horizontally to compare categories within a series, or vertically to compare series within a category.
Achieving this without clutter depends on a handful of practical methods:
- Establish a visual hierarchy: Assign each series a distinct hue drawn from a coherent palette, keep bar widths and gaps uniform, and reserve the strongest color for the primary measure.
- Manage density: Beyond three or four series, side-by-side bars become thin and hard to read. Consider grouping rarely compared series, splitting the chart into small multiples, or moving some measures to a secondary axis or a line overlay.
- Align scales deliberately: A shared axis supports honest visual comparison; divergent scales invite misreading.
- Use ordering to reduce cognitive load: Sort categories by the dominant series rather than alphabetically, and keep series order identical in the legend and the bars.
- Keep labels sparse: Use direct annotation to replace repetitive values where possible, and remove non-data ink so the paired bars communicate the comparison.
Stacked Columns
Stacked columns group several data series into a single bar per category, with each series rendered as a segment sitting directly atop the one below it. The height of the full column represents the category total, while each segment’s height shows how much that sub-component contributes to that total. This arrangement lets a reader compare category totals against one another through overall column height, and simultaneously inspect the internal composition of any single category without moving to a separate chart. A regional sales chart, for instance, can show total revenue per quarter as the column height and individual product-line contributions as the colored segments within it.
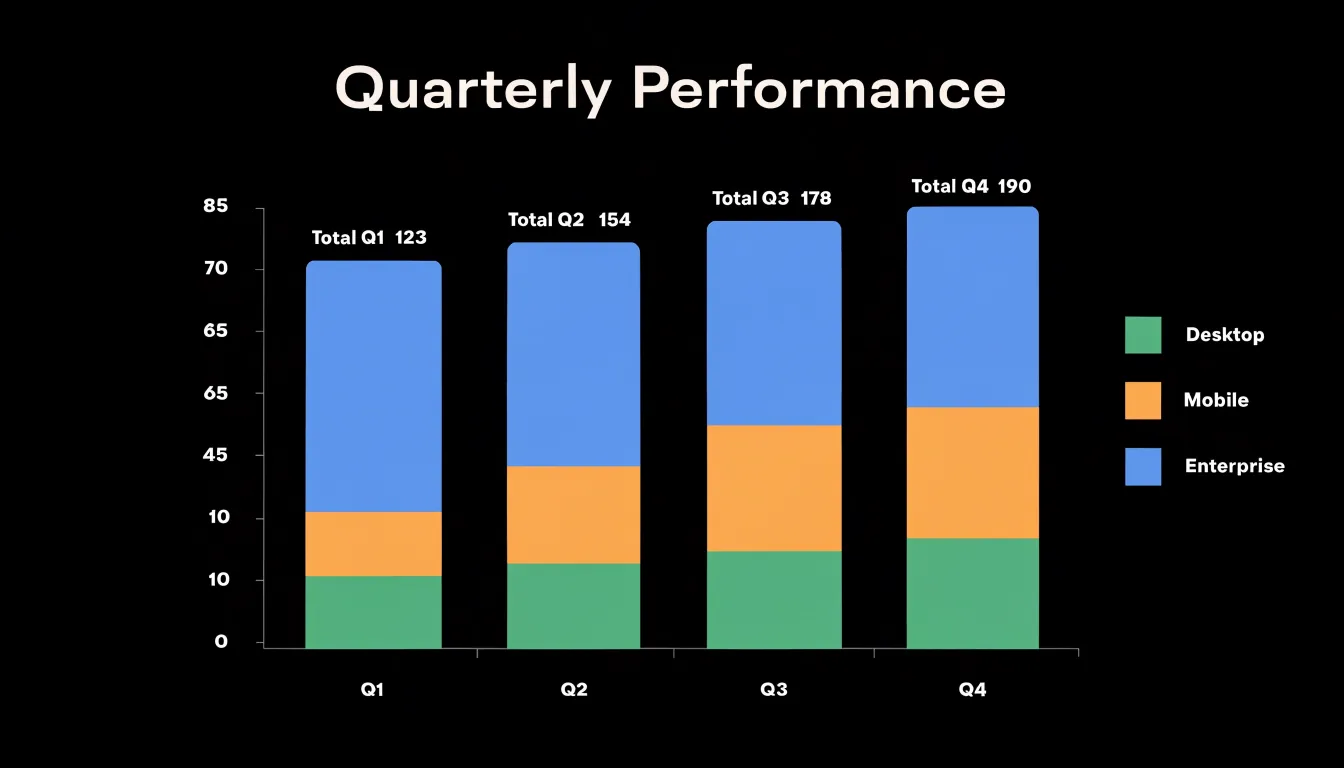
Because every segment occupies a share of a common vertical axis, viewers can judge whether one sub-component dominates a category, whether contributions are balanced, or whether the mix shifts from category to category. Reading across a series of columns reveals compositional trends: a segment that swells in later categories signals a growing contribution, while one that thins indicates decline. When the emphasis falls on shares rather than absolute amounts, a hundred-percent stacked variant normalizes every column to the same height, turning attention entirely to the relative weight of each part.
The display works best with a modest number of segments, since too many thin slices become difficult to compare and label. A consistent color order across columns supports scanning, and ordering segments from largest to smallest, or in a fixed logical sequence, helps readers track the same component from one category to the next. Placing totals above each column, or adding direct segment labels where space allows, removes the need for a separate value table.
Clustered Columns
Clustered columns arrange related data series side by side within each primary category, creating a visual structure where sub-groups can be read and compared directly. Because each cluster shares a common baseline and horizontal position, viewers naturally read across the bars within a cluster before moving to the next category. This makes clustered columns especially useful when the analytical question concerns how sub-groups differ from one another inside the same category, and how that internal pattern shifts across categories.
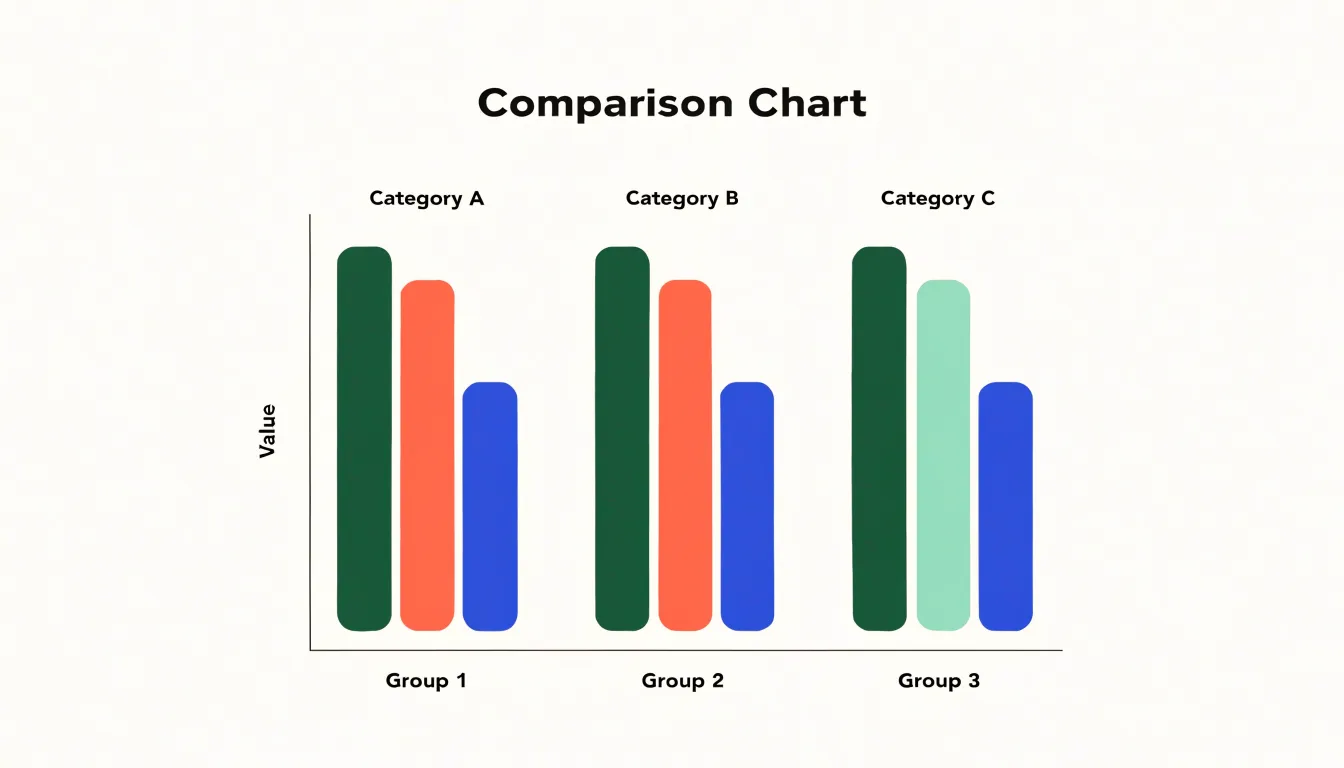
To keep clustered columns legible, keep the number of series per cluster modest—typically two to four—so each bar remains distinct and the cluster does not collapse into a dense block. Order the series consistently using the same left-to-right sequence and colors throughout, so viewers can track a sub-group across the chart without re-learning the legend at each category. Choose a consistent gap between bars within a cluster and a larger gap between clusters to visually reinforce which bars belong together and where one primary category ends and the next begins. Where space allows, direct labels on the first cluster can reduce reliance on the legend.
Finally, consider the shape of the data. Clustered columns handle a limited number of categories comfortably; beyond roughly a dozen, labels crowd and clusters shrink. Sorting categories by a meaningful measure, such as the total across sub-groups or the value of a key series, helps reveal patterns immediately.
Axis and Scale
When the y-axis begins at zero, the height of each column is directly proportional to the value it represents, so a column twice as tall genuinely reflects a value twice as large. If the axis instead begins at some arbitrary higher value, the bars no longer share that proportional relationship. A small difference between two values can appear as a dramatic gap, and a modest increase can look like a doubling. Readers absorb these impressions instantly and often without checking the labels, so a truncated axis can mislead even careful audiences.
Equally important is the choice of a linear scale. On a linear axis, equal distances along the scale represent equal differences in value, keeping the visual weight of each column aligned with its actual magnitude. Other scaling choices, such as logarithmic scales, compress or expand ranges unevenly and demand careful reading, making them poorly suited to straightforward column comparisons. Pairing a zero baseline with linear spacing ensures that the tallest bar is the largest value and the differences in height match the differences in data.
Labels and Sorting
When categories appear in an arbitrary order, viewers must scan every bar and compare heights one by one before they can form any impression of the data. Ordering the columns by value, either ascending or descending, gives the chart an immediate visual narrative. Descending order suits most cases because readers naturally look for the top performer first, while ascending order can work well when the story is about growth or when the smallest values deserve emphasis at the left edge. For ordinal categories such as age bands or satisfaction levels, the inherent sequence may matter more than magnitude, and sorting should respect that natural logic instead.
Data labels reinforce the sorted structure. Placing the value at the end of each column, or just inside the top of longer bars, removes the need to trace a line back to the axis. Labels should be legible: a font size close to the axis text, sufficient contrast against the bar fill, and consistent decimal precision across all values. For very short bars, an outside label avoids collision with the bar itself, while long bars can carry labels inside without crowding. When many categories exist, consider labeling only the extremes or using a selective approach so the chart does not become noisy.
Color and Spacing
When choosing a palette, start with a set of colors that maintain sufficient contrast against the background and against each other. Tools that simulate forms of color vision deficiency can help you confirm that adjacent columns remain distinguishable; pairing color with a secondary cue, such as a subtle pattern or direct labels, gives readers another way to tell categories apart. Limit the palette to a handful of distinct hues and reserve saturated colors for the series you want viewers to notice first, using muted tones for supporting categories. Maintain consistency across a report by using the same color for the same category in every chart.
Bar width and gap width work together to determine the rhythm of the chart. A common starting point is a gap roughly equal to half the bar width, which separates columns clearly without making the chart feel sparse. Wider gaps push the eye across empty space and can make comparisons harder; very narrow gaps cause neighboring columns to merge visually. Keep the gap uniform across the entire chart, and resist the urge to vary spacing unless you are signaling a meaningful grouping. Finally, check the chart at the size it will actually appear on screen or in print, since spacing that looks balanced at full width may collapse when the figure is scaled down.
Highlighting Trends
Visual accent strategies help readers find the important bars without scanning every label. Conditional formatting is one of the most flexible approaches: each column takes on a fill color derived from its value, so bars above a chosen threshold shift into a warm highlight while the rest remain in a neutral tone. The reader’s eye lands on the outliers immediately, and the ranking of top performers becomes apparent before any axis is read. Target lines work alongside this by drawing a horizontal reference across the plot area at a specific value, such as a sales goal or an average. Columns that cross the line stand out through position alone, and the distance between a column’s top and the line communicates over- or under-performance in a single glance.
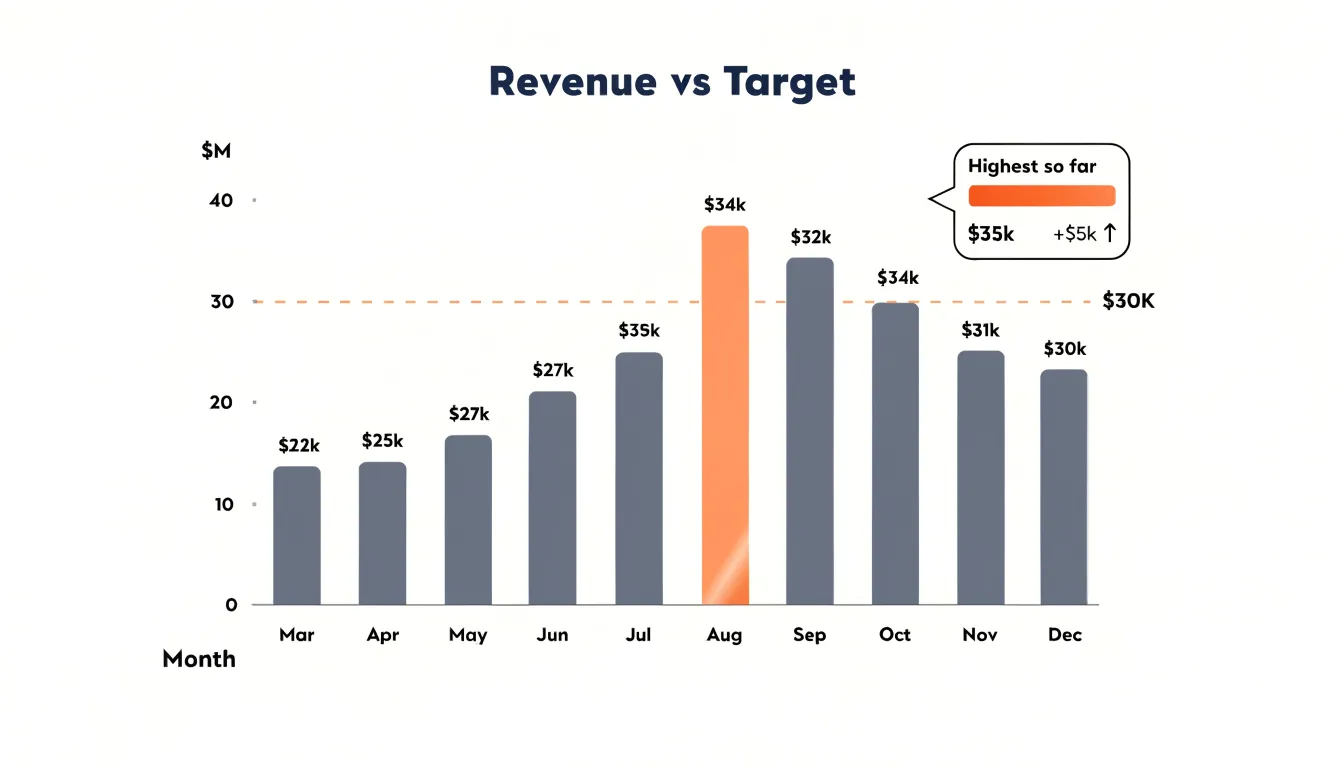
Data labels can reinforce the effect when placed only on highlighted columns, keeping the rest of the chart clean. Annotations, such as a short callout beside the peak bar, add narrative context without cluttering every category. Maintain consistency across a dashboard: if red marks the top quartile in one chart, it should carry the same meaning in the next.
Gridlines and Layout
Horizontal gridlines help readers trace a bar’s top edge across to the value axis and estimate its height. Because every gridline that serves no measuring purpose adds clutter, a useful rule of thumb is to include only horizontal lines at sensible value intervals, such as every ten or twenty-five units, and to remove vertical gridlines entirely since the category labels already mark positions along the axis. If data labels are attached directly to the columns, gridlines can often be removed altogether.
Background elements contribute just as much to perceived noise. Light gray plot backgrounds, borders around the chart area, and decorative drop shadows all draw the eye away from the columns. Keeping the chart surface white and muting axis lines and tick marks to a soft gray lets them orient the reader without competing with the bars. Legends belong close to the data.
The geometry of the chart also affects how honestly it communicates. Three-dimensional columns are the most common source of distortion in this format: perspective rendering makes columns at the front of the chart appear larger than identical columns at the back, and tilted top faces make it hard to judge where a value actually ends against the axis. Flat, two-dimensional columns give an accurate reading of relative magnitude.
Time Comparisons
Vertical column charts are well suited for tracking changes across discrete time periods, whether quarters, months, or annual milestones. The clear visual separation between adjacent bars reinforces that each column represents a self-contained slice of time. Arranged left to right, the natural reading order mirrors the passage of time, where each bar functions as a snapshot in a sequence showing growth, decline, or stability.
Setting up a time comparison begins with deciding the interval that best matches the question at hand:
- Quarterly columns suit business reporting where seasonal patterns and fiscal cycles matter.
- Monthly columns reveal shorter fluctuations that might disappear in a coarser view.
- Annual milestones offer a long-range perspective useful for strategic reviews.
Equal spacing along the horizontal axis keeps the rhythm of time intact and prevents readers from misreading gaps as meaningful events. Labeling each category clearly and ordering them chronologically rather than by value preserves the logic of the timeline. Readers can compare the tops of columns at a glance to identify peaks, troughs, and turning points, while reference lines marking prior-year averages or annotations on record quarters give each period context.
Interactive Features
Tooltips allow you to layer detail onto a column chart without sacrificing a clean display. When a user hovers over a bar, a small popup can reveal the precise value, the category label, the percentage change from a prior period, or other metadata that would otherwise require a separate table. To keep the reading experience fluid rather than disruptive, tooltips should respond quickly, appear near the cursor, and disappear cleanly.
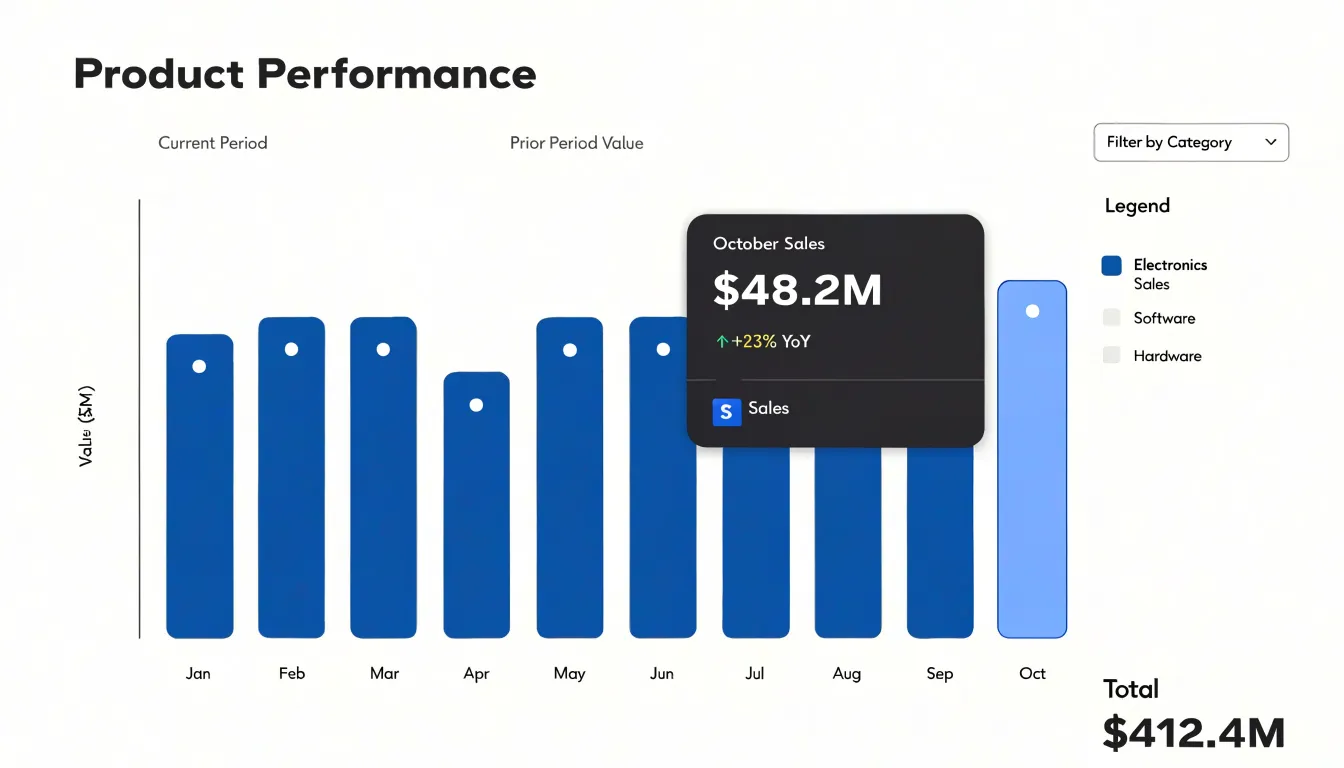
Custom tooltips extend this idea by matching the content and layout to the specific needs of the dashboard. A sales chart might show revenue, unit count, and regional breakdown inside a single hover panel, while a web analytics chart might display sessions, bounce rate, and average duration. Consistent number formats, clear labels, and a visual hierarchy that puts the most important metric first help users parse the detail at a glance. Custom tooltips can also include small sparklines or color indicators that connect the hovered bar to related trends elsewhere in the dashboard.
Interactive filtering complements tooltips by letting users act on what they see. Clicking a column can filter other charts on the page to that category, turning a static report into an exploratory interface: tooltips answer what a bar represents, while filtering shows how that category behaves across other dimensions.
Print and Mobile
Printed handouts and smartphone screens impose distinct constraints on how a column chart should be formatted. For print, resolution and physical size are the dominant concerns. Vector formats such as SVG or PDF preserve sharp edges at any print size, while raster exports need sufficient pixel density, typically 300 DPI, to avoid blurry bars and fuzzy axis labels. Print also removes interactivity, so every value the reader needs must be visible directly on the chart through data labels, axis scales, or annotations. Colors should be tested in grayscale, since many handouts are printed in black and white.
On mobile screens, horizontal space is scarce and touch targets are small. Responsive design techniques address this by allowing the chart container to resize fluidly with the viewport and adapting internal elements accordingly:
- Scale font sizes for axis and data labels up rather than letting them shrink on small screens.
- Rotate, abbreviate, or thin tick labels to prevent overlap.
- Reduce the number of visible categories, switch to horizontal bars, or enable scrolling within the chart area on narrow displays.
- Adjust margins and padding so bars are not squeezed against the edges.
Testing across real devices and printed proofs catches scaling and legibility problems that on-screen previews miss.
Practical Workflow
- Prepare the spreadsheet: Start with a clean sheet where each row represents a category and each column holds one series of values. Remove merged cells, blank rows, and totals that will skew the scale, and keep a single header row so your chart tool can detect labels automatically.
- Define the structure and sort: Decide which categories matter, whether sorting by value clarifies the message, and whether a single series or a grouped comparison best serves the data. Sort your rows in the spreadsheet itself, since most tools preserve the order you give them.
- Insert the chart and check orientation: Insert a standard column chart and confirm that the category axis receives your labels and the value axis receives your numbers. Use horizontal bars for long category names and vertical columns for time-based or short labels.
- Trim non-data elements: Delete unnecessary gridlines, remove the chart border, and strip the legend when only one series exists, since the title can carry that information.
- Format the axes and bars: Set the value axis to begin at zero, add a sensible number format, and lighten the axis line to a soft gray. Adjust the gap width so columns feel substantial without touching, and apply a single fill hue for one series or a restrained palette for several.
- Add titles, labels, and annotations: Write a clear title that states the finding rather than describing the chart, place data labels selectively where exact values matter, and annotate one or two standout columns with a short callout.
- Export and verify: Export at a resolution suitable for print or screen, check the chart at its final display size, and verify that colors remain distinguishable in grayscale.
Frequently Asked Questions
Should a column chart’s y-axis start at zero?
A column chart should begin from a shared baseline, usually zero, so equal differences in value appear as equal differences in bar height. A truncated axis can make small differences look dramatic and mislead readers.
How do I clean and organize categorical data for a column chart?
Check raw data for misspellings, capitalization differences, extra spaces, and synonymous labels, then unify variants using methods such as lookup tables or fuzzy matching. Make categories mutually exclusive and document how raw values were mapped to final categories.
What’s the difference between a stacked column chart and a clustered column chart?
Stacked columns combine several series into one bar per category so the full height shows the total and segments show each part’s contribution. Clustered columns place related series side by side within each category to compare sub-groups directly.
How should I sort and label the columns in a column chart?
Order columns by value, either ascending or descending, or use a natural sequence for ordinal categories such as age bands or satisfaction levels. Place data labels at the end of each column or just inside the top of longer bars, keeping them legible and selective when there are many categories.
How many colors should I use in a column chart?
Use a single fill color for most columns and reserve a different hue only for the category you want to emphasize; limit the palette to a handful of distinct hues and use muted tones for supporting categories. Confirm adjacent columns remain distinguishable for color vision deficiency and pair color with a secondary cue such as patterns or direct labels.
How do I make a column chart work on mobile and in print?
For print, use vector formats such as SVG or PDF or raster exports with sufficient pixel density, typically 300 DPI, and make all needed values visible directly on the chart because print removes interactivity. On mobile, use responsive design, scale font sizes up, rotate or abbreviate labels, reduce visible categories, switch to horizontal bars or enable scrolling, and adjust margins so bars are not squeezed against the edges.
Tony Astor
Tony writes about data visualization and the tools people use to build charts and dashboards. More about Data Illustrator