Colorblind-Friendly Charts: Palettes and Tips
 By Tony Astor ·
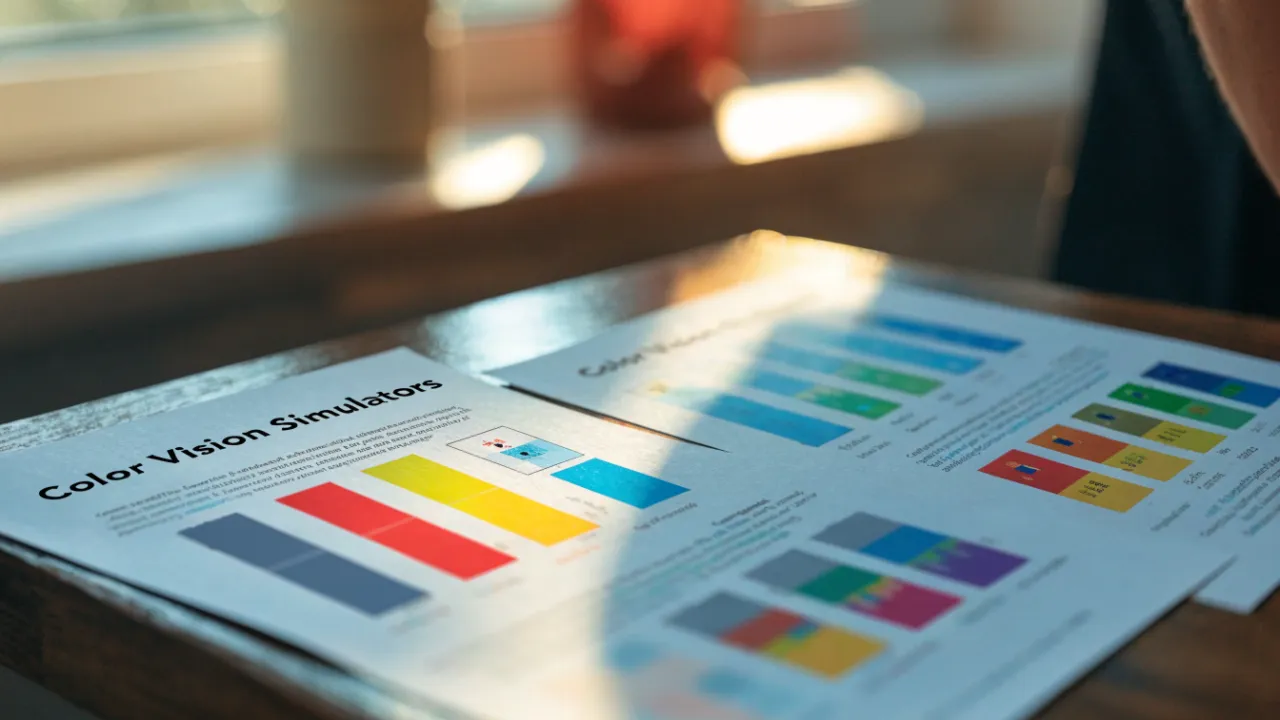
Colorblind-Friendly Charts
Colorblind-friendly charts use palettes and redundant cues that remain distinguishable under deuteranopia, protanopia, and tritanopia. Key methods include the Okabe-Ito palette, perceptually uniform gradients like Viridis and Cividis, monochrome luminance shading, blue-orange or purple-green pairings, plus patterns, marker shapes, dash styles, direct labels, and adequate WCAG contrast.
Table of Contents
Color Vision Basics
Color vision deficiency affects a significant portion of the population, with red-green colorblindness being the most common form. Two primary types, deuteranopia and protanopia, alter how individuals perceive colors and can fundamentally change how charts are interpreted.
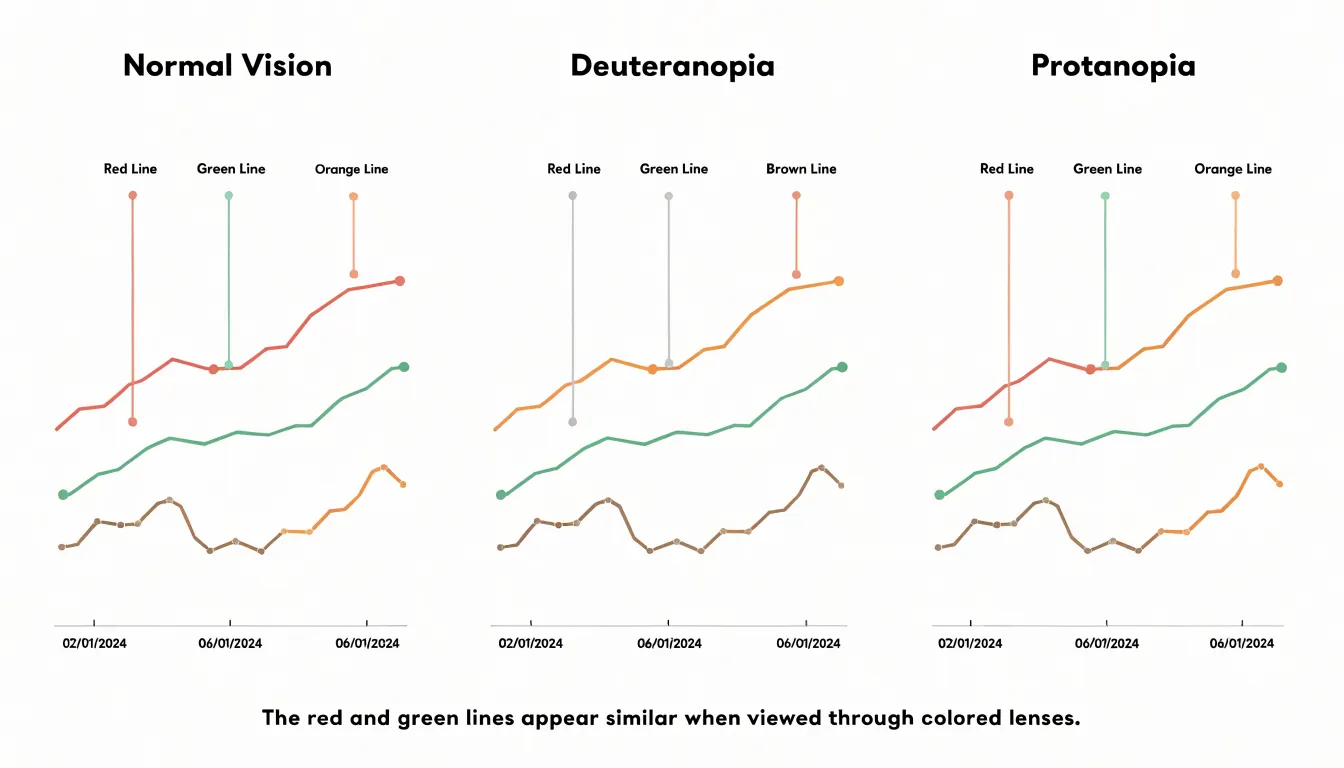
Deuteranopia, the most prevalent form of red-green colorblindness, results from a lack of functioning green cones in the retina. People with deuteranopia have difficulty distinguishing between reds, greens, browns, and oranges. In a chart, reds and greens may appear very similar, often blending into a muddy yellow-brown. For instance, a line chart with red and green lines might be nearly impossible to read because the lines look almost identical. Similarly, a pie chart with adjacent red and green slices may cause the slices to merge visually, obscuring the data distribution.
Protanopia stems from a lack of functioning red cones. Individuals with protanopia also struggle with red-green distinctions, but their perception differs: reds appear darker and may even look black, while greens appear lighter. This causes confusion when a chart uses red to indicate a critical value and green for a normal value. In a heatmap, a red-to-green gradient may not convey the intended intensity, as the red end appears dark and the green end light, leaving the middle range ambiguous. Moreover, red text or markers on a dark background may become invisible to someone with protanopia.
Beyond red-green deficiencies, rarer forms like tritanopia (blue-yellow) and achromatopsia (complete color blindness) also affect perception. Because color choices that seem distinct to those with normal vision can blur into indistinct shades for others, chart design requires colorblind-friendly palettes and redundant encoding such as patterns, shapes, or direct labels.
Accessible Color Palettes
Selecting an accessible palette begins with ensuring every reader can tell one data series from another. Developed by Masataka Okabe and Kei Ito, the Okabe-Ito palette consists of eight hues chosen so that people with the three main forms of color vision deficiency can distinguish each entry. The palette leans on differences in lightness as well as hue, pairing colors like bluish green, vermillion, and reddish purple in combinations that stay separable even when the red-green channel is compromised. Because each swatch sits far apart from its neighbors in perceptual space, the palette holds together in line charts, scatter plots, and stacked bars alike.
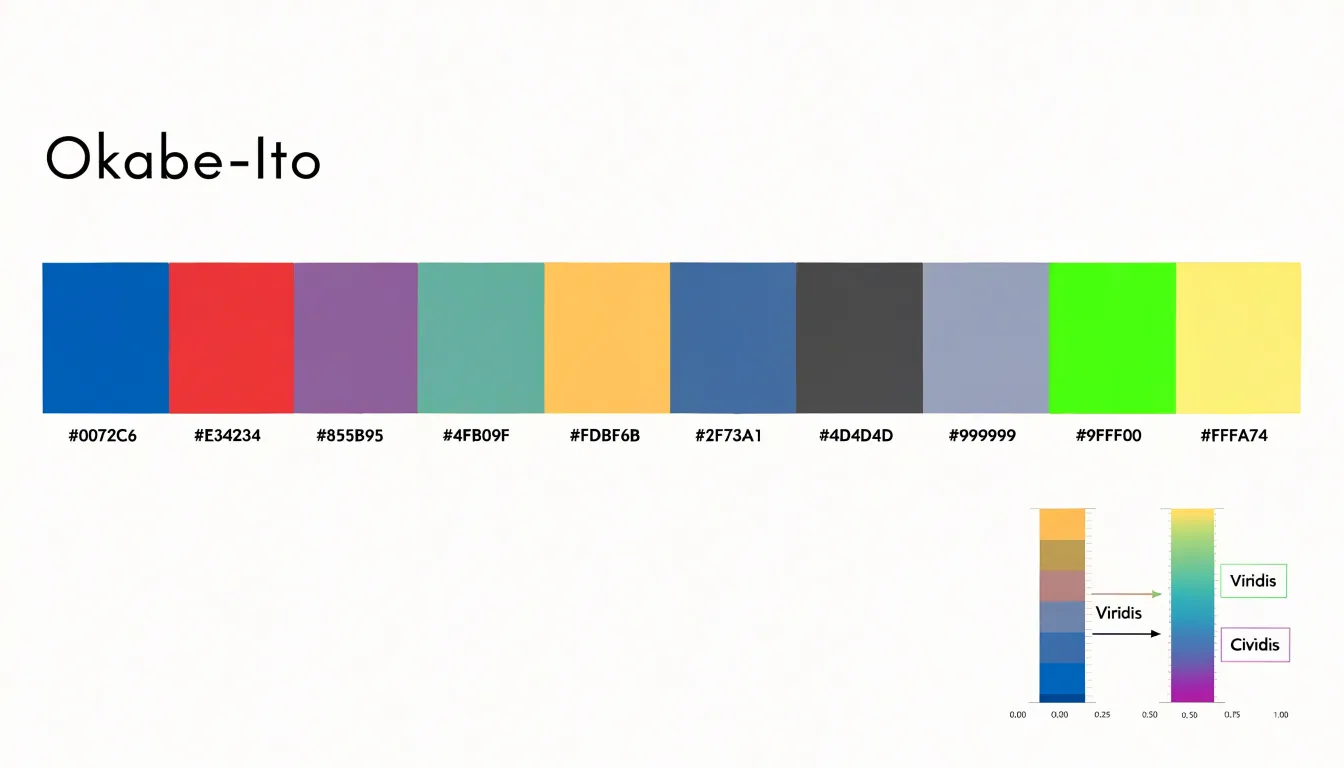
Viridis takes a different route as a continuous colormap. It moves through an ordered ramp from dark purple through blue and green into bright yellow, with lightness rising steadily along the way. That monotonic luminance is the key property: even a reader who cannot separate blues from greens can still read the sequence as a gradient from dark to light. Designed for scientific visualization, Viridis is now a default in many plotting libraries. Its sibling maps, such as Cividis, optimize specifically for deuteranopia.
Any chosen scheme is more reliable when tested under protanopia, deuteranopia, and tritanopia simulations to confirm that adjacent categories remain distinct and that thin lines and small markers keep enough contrast against the background.
Monochrome Charts
Monochrome charts rely on a single color family, using variations in luminance—the lightness or darkness of that color—to encode data and establish visual hierarchy. Because this approach does not depend on distinguishing between hues, it leverages the human visual system’s sensitivity to contrast and brightness, which remains robust across most types of color blindness.
To implement monochrome shading effectively, start with a base color and generate a tonal gradient by adjusting its luminance:
- Sequential data: For values increasing over time or across categories, use a gradient from light to dark to imply order. Aim for a luminance difference of at least 10% between adjacent steps so each level is distinguishable.
- Categorical data: Assign distinct luminance levels to each category, limiting the chart to five to seven shades to maintain clarity.
- Visual hierarchy: Use darker shades for important elements and lighter shades for secondary information to create a natural focal point.
Monochrome palettes ensure consistency in print, where color reproduction varies, and render reliably across screens. Converting a chart to grayscale verifies that distinctions remain clear for someone with monochromatic vision or in a black-and-white printout.
Red and Green Alternatives
Traditional red-green signaling is deeply embedded in financial dashboards, health metrics, and performance reports, where red marks a decline and green marks growth. For readers with red-green colorblindness, this interpretive framework collapses. A more dependable approach pairs blue with orange or purple with green, creating contrast through both hue and perceived lightness. Blue and orange sit nearly opposite one another on the color wheel, and their differing luminance gives each marker a distinct identity even in grayscale or on small mobile screens. Purple and green offer a similar benefit where a cooler, more muted palette suits the brand or data context.
Choosing between these pairings depends on the surrounding design. Blue-orange works well for line charts, heatmaps, and scatter plots because the two colors separate cleanly at boundaries where data points cluster. Purple-green serves dashboards that already lean toward warm accent colors, avoiding clashes with existing orange or amber elements. In either case, keep the assignment fixed—one hue consistently representing positive movement and the other negative—with a legend that names the direction explicitly.
Attention to saturation and lightness is also necessary. A dark navy paired with a pale orange reads clearly even for viewers with reduced contrast sensitivity, while mid-tone versions of both colors can blur together at small sizes. Adding secondary cues—such as upward or downward arrow glyphs, dashed versus solid strokes, or direct value labels—reinforces the distinction without depending on hue alone.
Patterns and Textures
Patterns and textures offer an independent channel of information so each data series carries at least two identifying signals. Hatched lines, dots, and cross-hatching separate series even when their fill colors are indistinguishable. A bar filled with diagonal hatching reads as different from a solid bar regardless of hue, and a dotted line remains traceable against a solid neighbor.
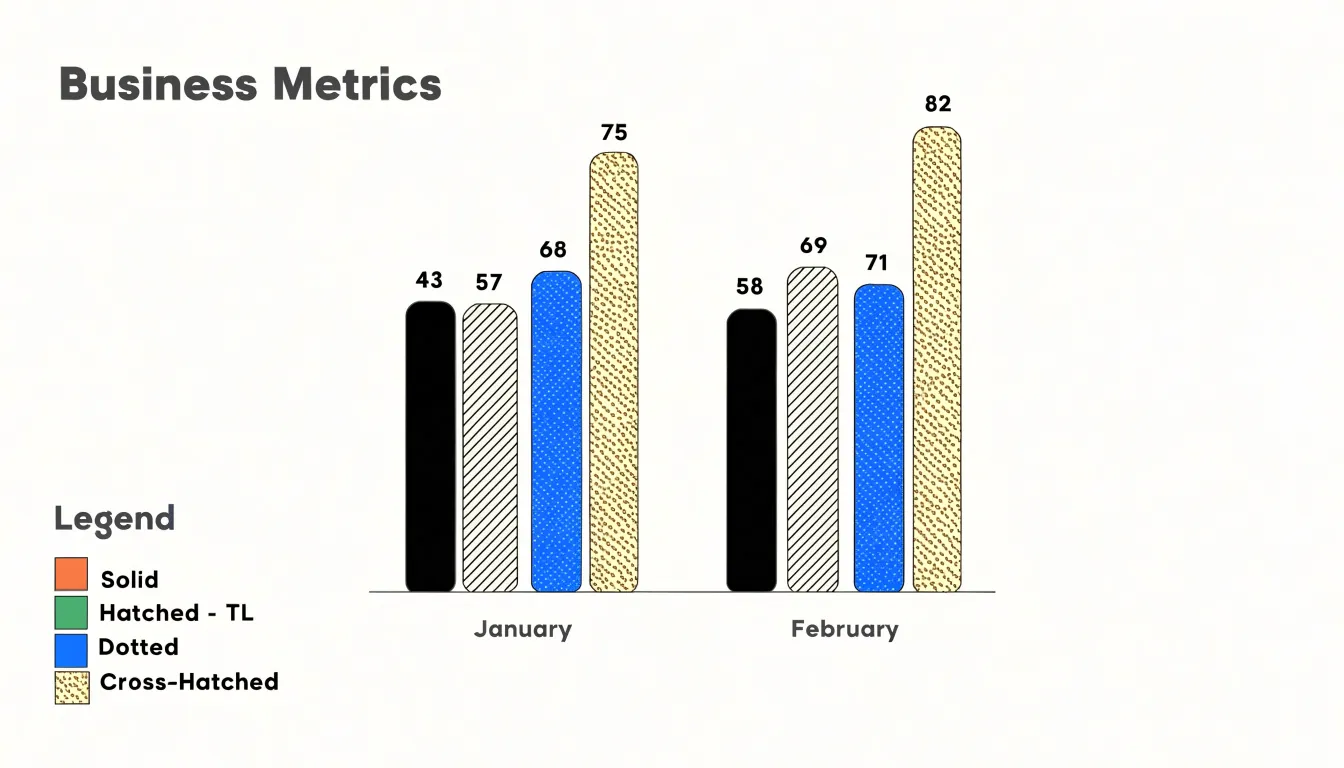
Applying textures well requires attention to density and orientation:
- Density: Hatching drawn too finely blurs at small sizes or on low-resolution screens, while patterns spaced too widely make a filled area look sparse or unfinished.
- Orientation: Diagonal lines running in opposite directions for different series create clear contrast that survives grayscale printing.
- Surface type: Dots and cross-hatching work well for large area fills such as stacked bars and choropleth regions, whereas line charts can use solid, dashed, and dotted strokes.
Legends must show the pattern alongside the color swatch so readers can match each texture to its series. Maintaining consistent pattern assignments across a report—such as always using a dotted series for forecasts—helps readers track data from chart to chart.
Line Charts
When a line chart carries more than two or three series, pairing custom line colors with distinct geometric shape markers and dash patterns gives each series three independent identifying cues. A circle, square, triangle, diamond, or cross placed at regular intervals creates a visual signature that survives recoloring, grayscale conversion, and low-contrast displays. Choose markers large enough to remain legible at the chart’s final published size, and apply them consistently at every data point or at evenly spaced intervals so the pattern reads as intentional rather than as missing data.
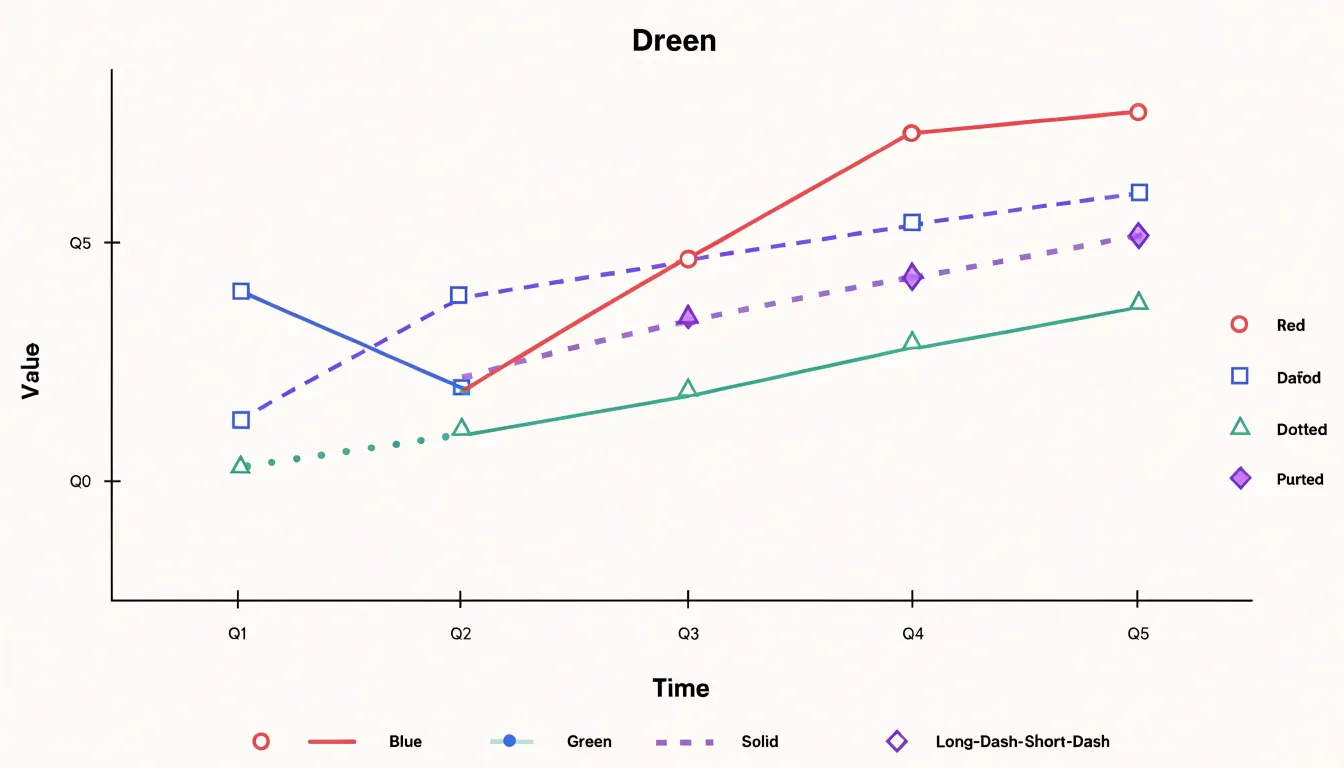
Dash patterns—such as solid, dashed, dotted, and long-dash-short-dash combinations—keep lines distinguishable even when two series use similar hues or cross repeatedly. Because too many dash types in one chart can look noisy, a good rule is to assign unique patterns to the two or three series most likely to overlap or be confused. Keep line weights consistent across series so the dash pattern, rather than thickness, carries the distinction. A reader who cannot separate two hues can still track the line with square markers against the line with dashed segments and diamond markers.
Bar Charts
To remove the dependence on fill color as the sole distinguishing feature in bar charts, designers can add high-contrast outline borders and direct value labels. A thin, dark stroke with strong luminance contrast along the edge of each bar separates neighboring bars even when their interior hues appear nearly identical. The border also helps bars stand out against a busy background or intersecting gridlines.
Placing numerical values directly on or beside each bar allows the reader to interpret the chart without consulting a color legend at all, shifting color into a supporting role. Position labels consistently—for example, just beyond the bar tip or centered within horizontal bars—and use a font size large enough to stay legible at the final display size. Aligning labels to the same baseline or edge keeps the layout tidy.
Pie Charts
Pie charts create visual friction when a separate color legend forces the eye to travel back and forth to match a slice’s color to its category name and value. This adds cognitive load and causes confusion when several slices use similar hues. Direct labeling removes this step by placing the category name and value immediately beside or within the slice it describes. A callout line can connect a slice to a text label positioned just outside the chart, or the label can sit directly on a large slice when space allows.
Direct labels benefit readers with low vision, color vision deficiency, or cognitive disabilities who may struggle to hold a legend mapping in working memory, and they remain legible on small screens where legends may be truncated or pushed far from the graphic. Designers should ensure that callout text meets contrast requirements against its background, place labels consistently around the perimeter, and keep leader lines thin enough to avoid clutter while clearly connecting label to slice. When slices are very small, grouping them into an “Other” category with a single label prevents overlapping text.
Heatmaps
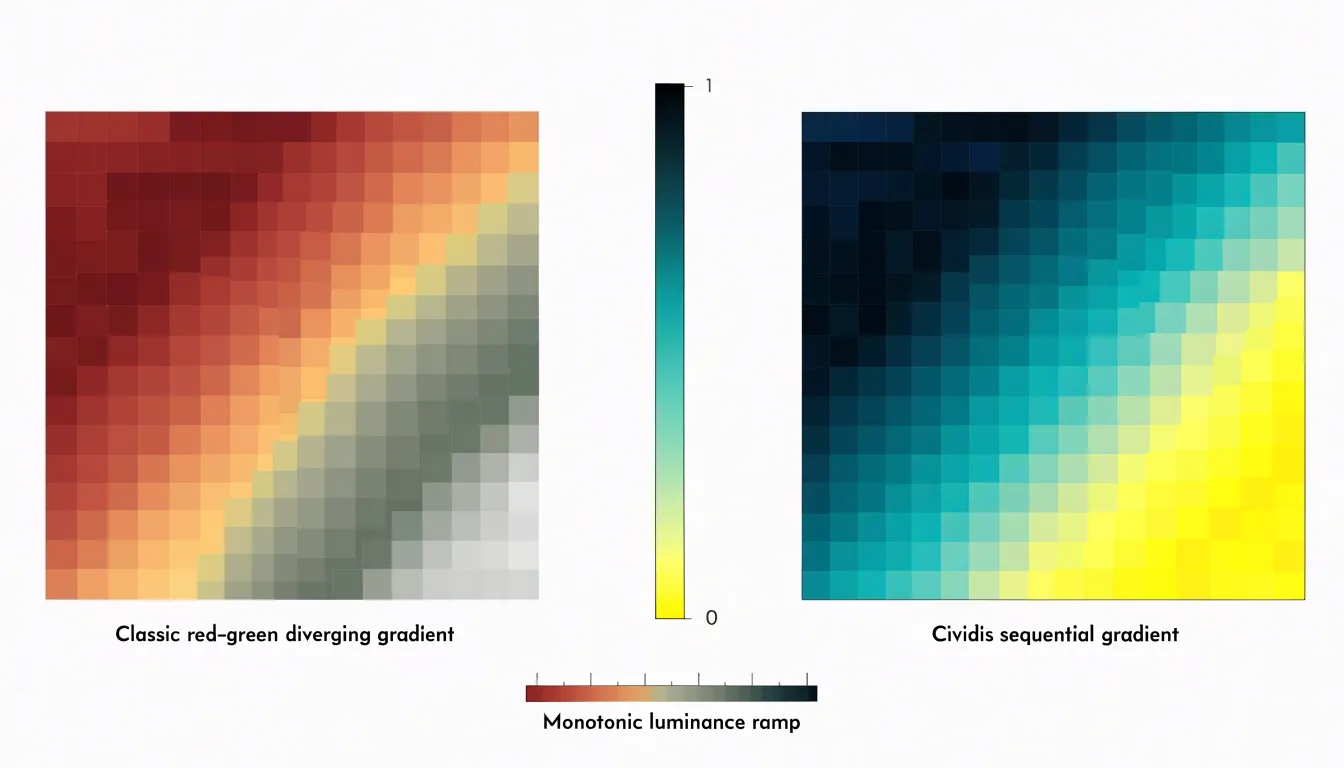
When a heatmap encodes a dense matrix of values, small differences between adjacent cells must remain readable. Perceptually uniform color gradients are the foundation of this effort. They advance through color space at a constant rate of perceived change, so a given numerical step produces a comparable visual step anywhere along the scale. This consistency allows a reader to compare a value in the corner of the matrix with a value in the center and trust the comparison. Gradients that are not uniform compress some ranges and stretch others, creating false plateaus and artificial cliffs that can be mistaken for real structure in the data.
Cividis is a perceptually uniform gradient developed specifically for broad accessibility. It transitions from a dark blue through muted grays and greens to a bright yellow. Its steady luminance ramp from dark to light keeps ordering intact even when hue discrimination is limited, allowing dense heatmaps to retain their internal structure without relying on red-green distinctions.
Designing safe gradients for complex matrices also requires matching the gradient to the data’s structure: diverging gradients suit values that pivot around a meaningful midpoint, while sequential gradients like Cividis fit magnitudes that move in only one direction.
Testing Tools
Colorblindness simulators allow designers to check how charts appear under deuteranopia, protanopia, tritanopia, and achromatopsia before publication:
- Browser extensions: Available for Chrome and Firefox, these apply real-time filters to live web pages for spot checks.
- Design software plugins: Integrated into tools like Figma, Sketch, and Adobe Illustrator, plugins let designers toggle between normal and simulated views during iterative work.
- Online simulators: These accept uploaded images or screenshots for quick reviews of charts produced by others.
The practical workflow is to simulate at the draft stage while palette adjustments are still easy, and repeat the check just before publishing to catch regressions from later edits. In each simulated view, check the legibility of labels, clarity of legend entries, and separability of adjacent data points.
Contrast Guidelines
The Web Content Accessibility Guidelines (WCAG) provide testable numeric targets for chart contrast across monitor types and lighting conditions:
- Body text and axis labels: At least 4.5:1 against the background.
- Large text (titles and prominent callouts): At least 3:1 against the background.
- Graphical elements (axis lines, tick marks, and data strokes or fills): At least 3:1 against adjacent colors. Decorative background gridlines can be lighter, but any line conveying a value must meet the 3:1 threshold.
Applying these rules follows a predictable order:
- Identify each element that carries meaning: labels, axis lines, series marks, legends, and annotations.
- Measure each element’s contrast against its background, checking both the darkest and lightest areas if the background is an image or gradient, as well as the contrast between adjacent series colors.
- Adjust lightness where a ratio falls short rather than replacing the whole palette; for instance, darkening axis lines slightly often brings them into compliance without disturbing the visual hierarchy.
- Add a subtle outline or increase stroke weight where a data mark falls below 3:1 to restore legibility while keeping the chosen hue, especially for thin lines and small marks.
Accessible Chart Libraries
Modern visualization libraries lower the barrier to inclusive design by offering built-in, documented colorblind-safe palettes:
- D3.js: Through its
d3-scale-chromaticmodule, this JavaScript library offers perceptually uniform and colorblind-safe schemes likeCategory10andTableau10, along with documentation on each scheme’s rationale and data suitability. - Chart.js: This web charting library uses a default palette based on the colorblind-friendly
Tableauscheme and supports easy customization for switching to alternative accessible palettes. - Seaborn: This Python statistical visualization library includes built-in palettes such as
colorblind,deep, andmuted, designed to remain distinguishable across various color vision deficiencies.
Interactive Charts
Interactive features allow charts to pack in more detail without cluttering the view, provided they are built for both mouse and assistive-technology users:
- Tooltips: Hovering or focusing on a data point can reveal precise values, labels, percentages, or trends. Tooltips should be positioned so they do not overlap critical data, remain visible long enough to be read, and be dismissible via the Escape key.
- Synchronized highlights: Selecting an element can dim or emphasize related data across multiple charts or series to highlight correlations. Transitions should be subtle or disabled to respect reduced-motion preferences.
- Screen-reader and keyboard support: Interactive elements need appropriate ARIA roles (such as
role="img"orrole="graphics-symbol") andaria-labeloraria-describedbyattributes conveying the tooltip’s information. Users must be able to tab through data points and trigger tooltips via keyboard focus events, not just mouse hover.
Print and Screen
A chart palette that looks distinct on a bright monitor can fail on photocopies, monochrome laser printers, projected slides, or dimmed phone screens.
In grayscale printouts, distinct hues may map to nearly identical luminance values. Varying lightness deliberately when building a palette—and pairing it with secondary cues like marker shapes, line styles, or direct labels—ensures distinctions survive the loss of color.
Screen environments present two main challenges:
- Low-brightness displays: Dimmed screens and power-saving modes compress perceived contrast between adjacent colors, causing subtle distinctions and very pale tints to vanish in daylight.
- High-DPI screens: Thin strokes and small text can render too finely at high pixel densities, especially when a chart scales down in a responsive layout. Using adequate stroke widths and font sizes, and exporting vector formats where possible, keeps charts crisp across devices.
Testing proofs on both a grayscale printer and a range of displays makes media checks a routine part of production.
Real-World Makeovers
Before-and-after case studies illustrate how diagnostic simulation and redundant encoding solve practical readability problems:
- Sales dashboard line chart: The original chart used red and green for two product lines, which appeared as two nearly identical shades of brown under deuteranopia simulation. The makeover retains red and green as an option for print materials but assigns each series a lighter or darker value, a distinct marker shape, and direct labels at the end of each line.
- Eight-category stacked bar chart: The original used a rainbow palette where several color pairs blurred together. The redesign replaces the rainbow with a sequential palette, reorders the stacks from largest to smallest, and adds data labels to the busiest segments.
- Low-contrast pie chart: Originally built with low-contrast gray text and thin outlines, this chart is converted into a sorted horizontal bar chart with darkened labels and a single accent color highlighting the category emphasized in the report.
Designers can apply this same sequence to their own work: identify the palette problem, test it under color-vision deficiency simulations, and differentiate data through value, shape, and direct labeling.
Frequently Asked Questions
What is the difference between deuteranopia and protanopia when reading charts?
Deuteranopia, the most common red-green colorblindness, makes reds, greens, browns, and oranges hard to distinguish; red and green chart elements may blend into a muddy yellow-brown. Protanopia also affects red-green distinctions, but reds appear darker and may look black while greens appear lighter, and red text or markers on a dark background may become invisible.
What is the Okabe-Ito palette and why is it useful for charts?
The Okabe-Ito palette has eight hues developed by Masataka Okabe and Kei Ito so people with the three main forms of color vision deficiency can distinguish each entry. It relies on differences in lightness as well as hue, keeping colors separable even when the red-green channel is compromised.
How do monochrome charts encode data without relying on different colors?
Monochrome charts use a single color family and variations in luminance to encode data and establish visual hierarchy, so they do not depend on distinguishing hues. For sequential data, use a light-to-dark gradient and aim for at least a 10% luminance difference between adjacent steps; limit categorical charts to five to seven shades.
What colors can I use instead of red and green in charts?
The article recommends pairing blue with orange or purple with green, creating contrast through both hue and perceived lightness. Keep the assignment fixed—one hue consistently representing positive movement and the other negative—and use a legend that names the direction explicitly.
How can I make line charts and bar charts readable without relying on color alone?
For line charts, pair custom colors with distinct shape markers and dash patterns, and keep line weights consistent so the dash pattern carries the distinction. For bar charts, add high-contrast outline borders and direct value labels so readers can interpret the chart without relying on fill color alone.
How should I test charts for colorblindness and what contrast ratios should I meet?
Use colorblindness simulators to check charts under deuteranopia, protanopia, tritanopia, and achromatopsia, simulating at the draft stage and again just before publishing. WCAG targets are at least 4.5:1 for body text and axis labels, 3:1 for large text, and 3:1 for graphical elements against adjacent colors; decorative gridlines can be lighter, but any line conveying a value must meet the 3:1 threshold.
Tony Astor
Tony writes about data visualization and the tools people use to build charts and dashboards. More about Data Illustrator