Color Palettes for Charts: How to Pick the Right One
 By Tony Astor ·

Color Palettes for Charts
Effective chart color palettes match palette type to data structure: categorical schemes use distinguishable, equal-weight hues for unordered groups; sequential palettes use monotonic lightness for ordered values; diverging ranges pair two hues around a neutral midpoint for data centered on a reference. Palettes should stay colorblind-safe, high-contrast, and limited to about five to eight colors.
Table of Contents
- Categorical Color Schemes
- Sequential Color Palettes
- Diverging Color Ranges
- Colorblind Safety
- Contrast and Readability
- Avoiding Rainbow Palettes
- Limiting Palette Size
- Highlight and Focus Techniques
- Print Versus Digital Display
- Brand Alignment
- Cultural Color Meanings
- Color Intensity Balance
- Testing Your Palette
- Common Palette Mistakes
- Standardizing Across Dashboards
Categorical Color Schemes
Categorical color schemes apply to unordered groups—product lines, regions, survey responses, or any set of distinct categories without an inherent order. The goal is to assign colors that are immediately distinguishable while carrying equal perceptual weight, so no single category inadvertently draws more attention than the others.
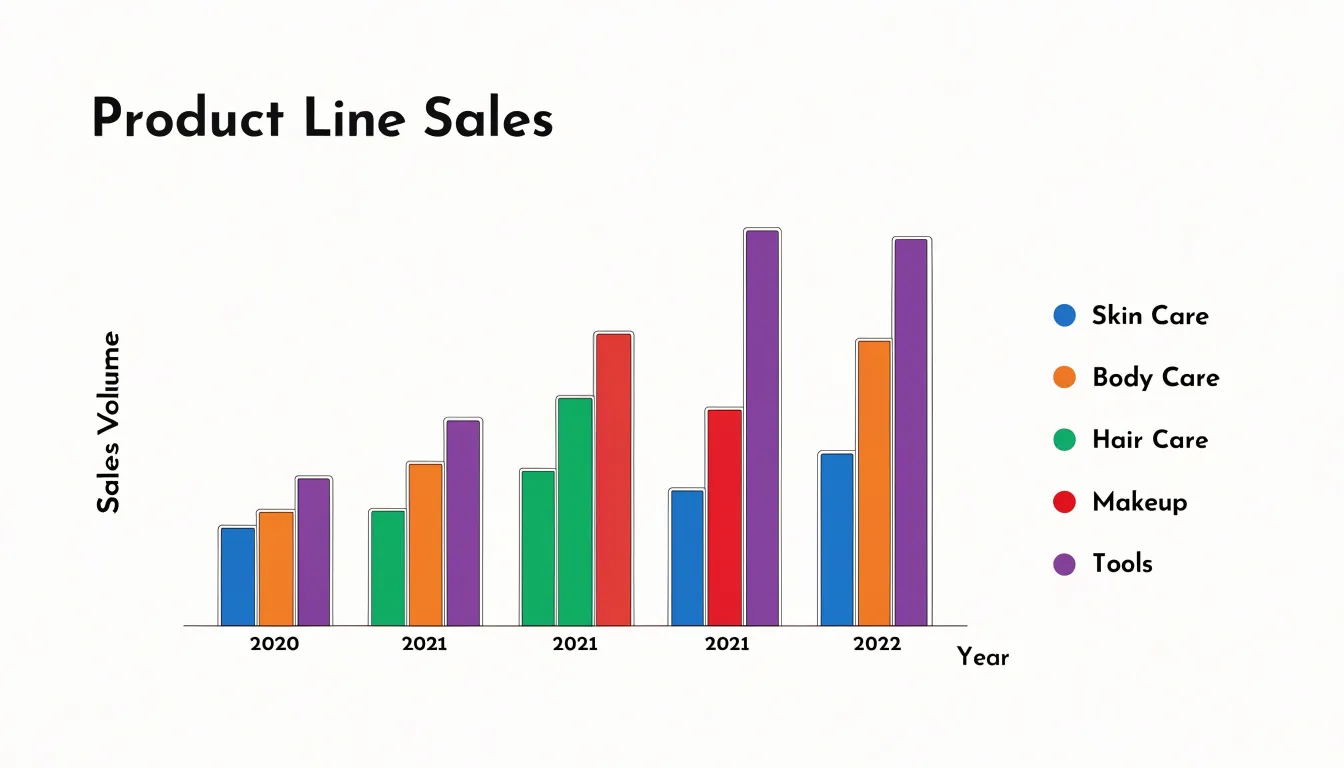
Start with hues that are well separated in color space. The human visual system distinguishes certain hue combinations more easily than others; for example, blue, orange, green, and red are generally more separable than blue, purple, and magenta. Tools like ColorBrewer or perceptually uniform palettes (such as the Okabe-Ito or Tableau 10 sets) provide tested combinations that avoid common pitfalls.
Use palettes that vary in both hue and lightness to remain accessible to readers with color vision deficiency (CVD). Once you assign a color to a category, keep it consistent across all charts in a report or dashboard to reduce cognitive load. Finally, limit categories to at most seven or eight; beyond that, even the best palette becomes hard to differentiate, and smaller groups are better combined into an “Other” category or split into small multiples.
Sequential Color Palettes
Sequential color palettes use a steady progression of lightness, and often hue, to mirror the progression of numeric values in a dataset. When a chart encodes population density, temperature, sales volume, or measurement intensity, a sequential palette gives the reader an immediate visual ordering. Lighter tints suggest low values while darker shades suggest high values, allowing the eye to rank regions or marks without consulting a legend for every observation. This natural mapping relies on luminance differences, which are among the most reliable cues for judging relative magnitude.
A single-hue sequential palette, such as a ramp from pale blue to deep navy, works well when the data has one clear dimension and the chart needs to stay visually calm. Multi-hue sequential palettes, such as a transition from light yellow through orange to dark red, add perceptual range and make fine distinctions easier to see across a wide value span. In both cases, the defining feature is monotonic lightness: each step should be measurably lighter or darker than the last, so the ordering remains unambiguous even in grayscale or black-and-white print.
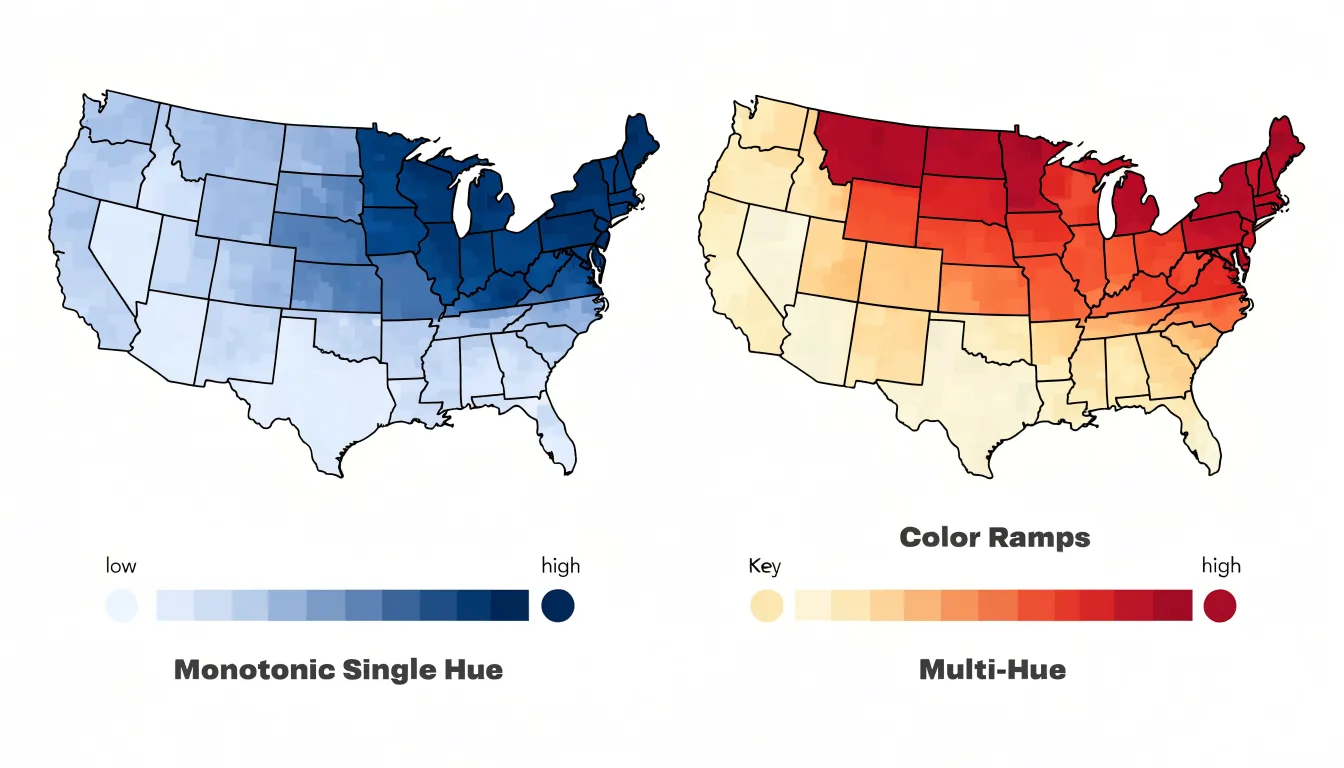
Sequential palettes handle both continuous and binned data in choropleth maps, heatmaps, and shaded area charts. Aim for enough steps to resolve meaningful differences without creating false precision, ensure the darkest end remains distinguishable from grid lines and borders, and pair the ramp with a legend that clearly labels the low and high anchors.
Diverging Color Ranges
Diverging color ranges use two distinct hues that meet at a neutral midpoint, making them effective for data that revolves around a central reference value such as zero, an average score, or a target threshold. By assigning one hue to the high side of the scale and a contrasting hue to the low side, with a pale or desaturated neutral tone in the middle, the palette separates the direction of movement from the magnitude.
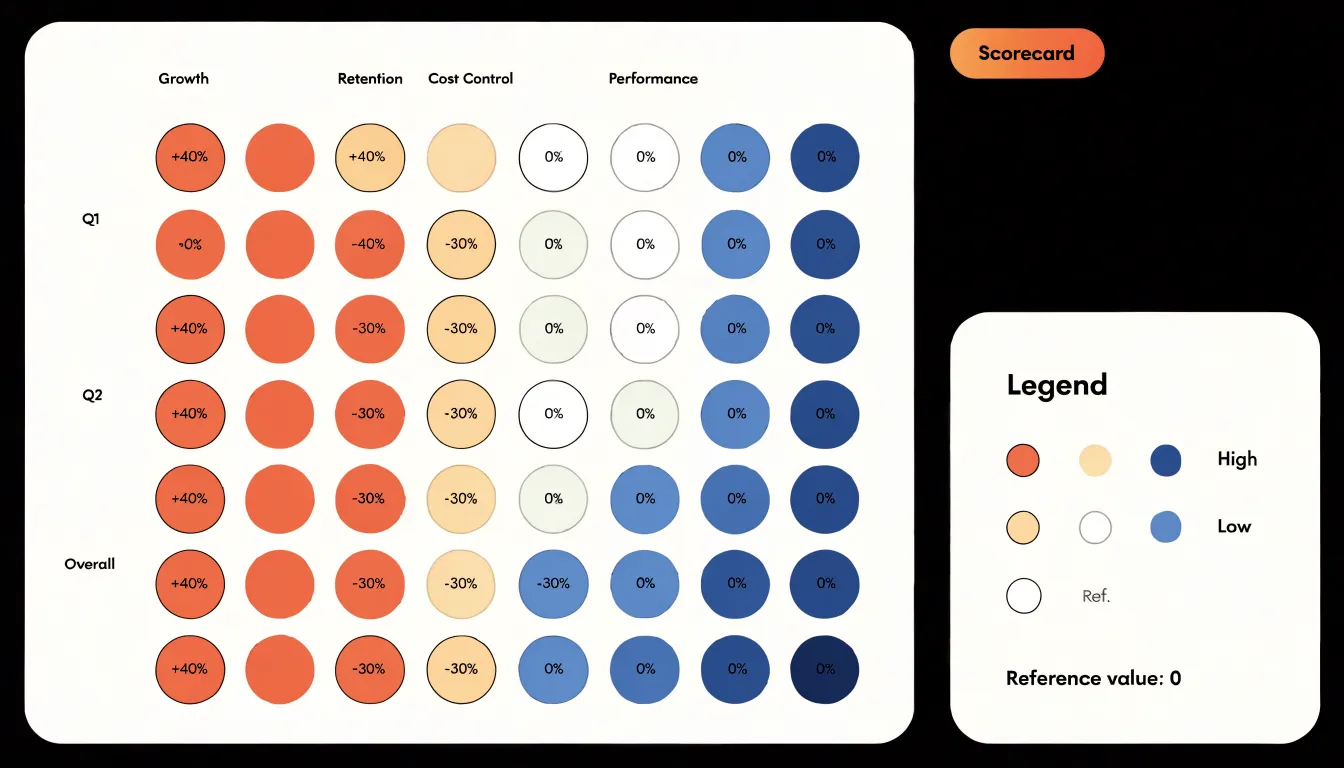
Because the middle of the palette uses low saturation, values close to the baseline appear calm and recede into the background. As values move away from the center in either direction, saturation and intensity increase, making the highest highs and lowest lows the most visually prominent points on the chart.
Diverging ranges also communicate orientation without extra labels. In heatmaps, choropleth maps, and performance scorecards where positive and negative deviations coexist, the hue shift itself signals whether a cell or region sits above or below the reference line. When choosing a diverging palette, pick two hues that remain distinguishable for colorblind viewers, keep the midpoint genuinely neutral rather than tinted toward either side, and ensure the intensity ramp is smooth from center to extreme.
Colorblind Safety
Roughly 8% of men and 0.5% of women experience some form of color vision deficiency (CVD), meaning a palette that looks distinct to a designer can collapse into a muddle for a meaningful share of the audience. Red-green deficiencies are the most common, making deuteranopia (absent green cones) and protanopia (absent red cones) the first practical checkpoints for any chart palette. In both conditions, reds, greens, oranges, and browns drift toward one another and can become nearly indistinguishable, especially at small sizes or in thin lines.
Instead of relying on the red-green axis, use hue pairs that stay separate under simulation, such as blue and orange, blue and yellow, or purple and green. Because color alone is a fragile carrier of meaning, layer in redundant pattern and shape cues so every series stays identifiable even when hues converge:
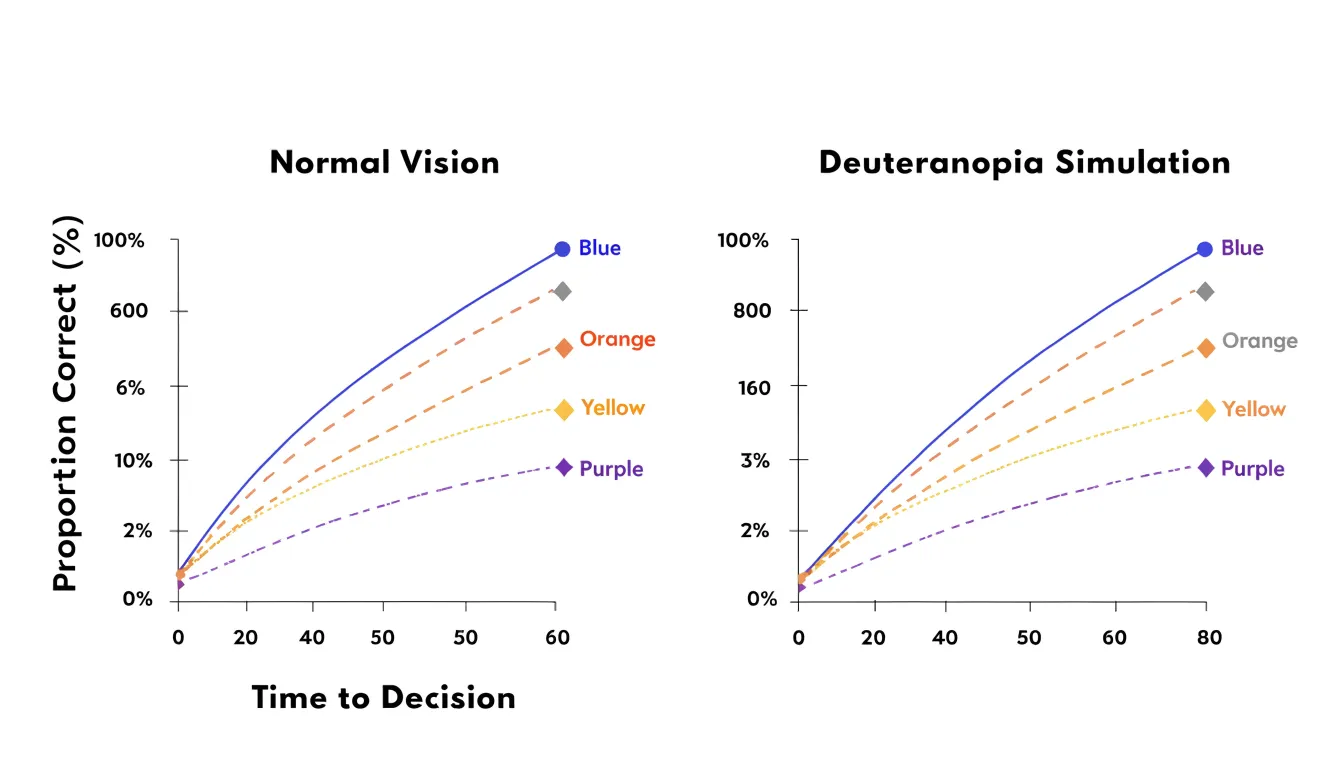
- Dashed and dotted lines for time series
- Distinct marker shapes such as circles, squares, and triangles
- Hatching or cross-hatching in filled areas and bars
- Direct labels placed at the end of each line or bar
These cues also preserve legibility in grayscale printing, on low-quality projectors, and on small screens in bright light. Avoid encoding critical thresholds in subtle hue shifts alone.
Contrast and Readability
When a data mark, label, or axis line shares a similar luminance value with the surface behind it, the eye has to work harder to separate information from its setting. High luminance contrast ratios between foreground elements and the background keep boundaries crisp at small sizes, during projection, and in print.
Measure the relative luminance of each foreground element against its immediate background:
- 4.5:1 provides solid legibility for text and fine labels.
- 3:1 offers a baseline for larger filled marks such as bars or bubbles, as well as between adjacent colors.
Lighter backgrounds generally allow data marks in deeper tones to stand out cleanly, while dark backgrounds pair well with lighter, saturated marks.
Background elements require restraint. Grid lines, plot area fills, and borders serve as scaffolding and should sit at low contrast relative to the data so they guide the eye without competing for attention. A mid-tone grid will visually collide with mid-tone data marks, leaving neither clearly dominant; set grid lines just a few shades lighter or darker than the plot background using a thin stroke. Finally, check text placed directly on colored bands or imagery in its actual rendering condition, not just on a calibrated monitor.
Avoiding Rainbow Palettes
Rainbow palettes, spanning the continuous spectrum from red through violet, are a common default in charting tools, yet they introduce perceptual artifacts that mislead viewers. The human visual system does not perceive hue changes uniformly: transitions such as yellow to green appear abrupt and create false boundaries where none exist in the data, causing viewers to infer clusters that are merely artifacts of the palette. Additionally, rainbow palettes lack a natural perceptual ordering. Because hues like bright yellow appear more salient than others, they draw attention to arbitrary values and distort the perceived magnitude of differences.
Perceptually uniform palettes—such as viridis, magma, plasma, or cividis—maintain a consistent rate of perceived lightness and hue change across their entire range, ensuring that equal steps in data correspond to equal steps in perception. For continuous or ordered data, replace rainbow defaults with these perceptually uniform ramps, monotonic sequential palettes, or diverging scales as the data structure dictates.
Limiting Palette Size
Human perception reliably separates only a modest number of hues when they appear side by side, especially in small marks like lines, points, or thin bars. When a palette grows beyond five or six distinct colors, adjacent hues start to feel similar, forcing viewers to glance repeatedly back to the legend to confirm which category they are reading. Each additional hue increases cognitive load and introduces opportunities for error.
Keep palettes to five or six colors so every category retains a clear, memorable identity. If a dataset contains more categories, consolidate them before choosing colors: group smaller or related series into an “Other” bucket, move secondary detail into a separate view, or split the chart into small multiples rather than expanding the palette.
Highlight and Focus Techniques
The human eye is drawn to saturation and contrast, so whatever element carries the most vivid color commands attention first. By muting background tones—softening gridlines, axis labels, titles, and secondary data series into gentle grays or desaturated blues—you create a calm visual field against which a single vibrant accent color stands out.
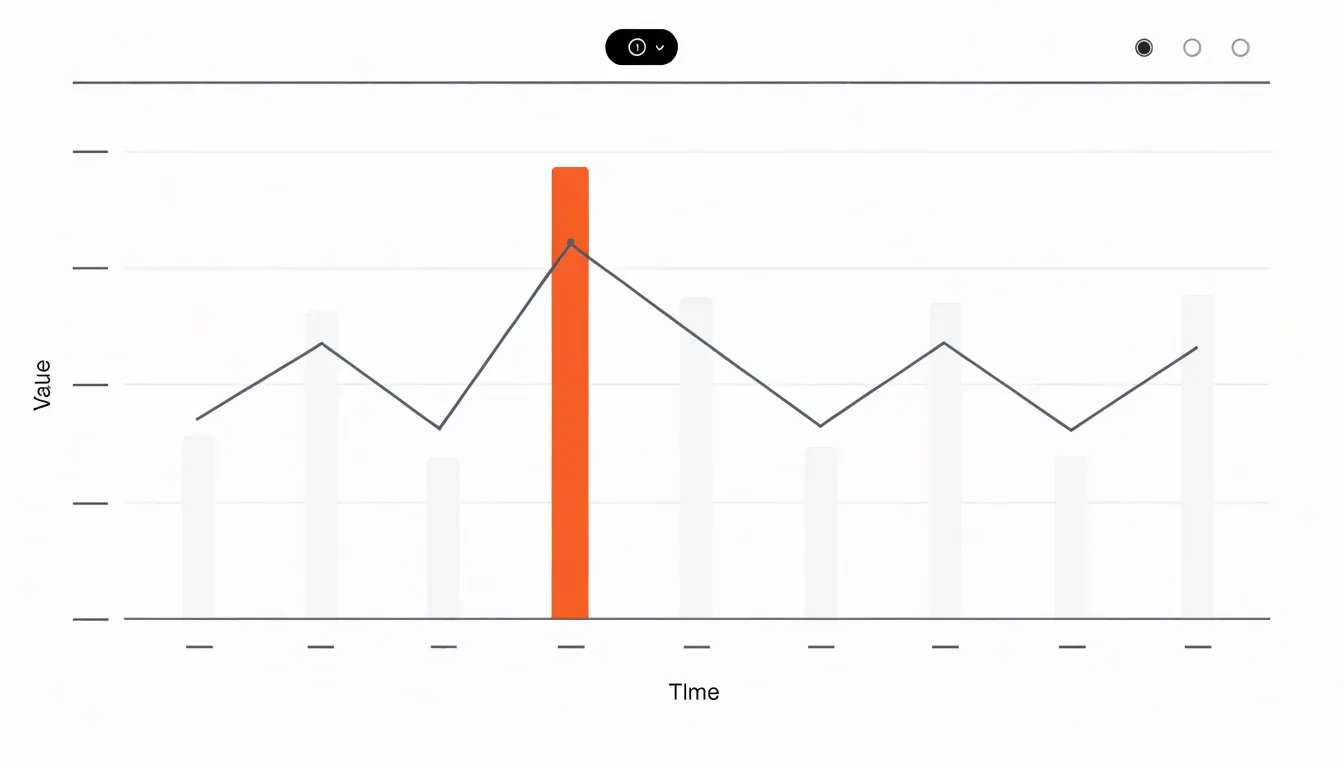
Reserve that accent color (such as a bright orange, saturated teal, or primary brand hue) exclusively for the data points that carry the core finding, whether that is a peak in a trend line, an exceeded target, or a focal category. When only one series or marker wears the vibrant hue, viewers reach the intended insight without needing arrows, callout boxes, or extra explanatory text. Applying the same accent color to signal priority across a report lets readers scan multiple charts in seconds.
Print Versus Digital Display
Screens and paper reproduce color using different physical models, which matters whenever a chart moves from a monitor into a printed report. Screens emit light, building color additively from red, green, and blue (RGB) channels to produce bright, saturated hues—particularly vivid greens, oranges, and electric blues. Paper relies on ink to absorb light and reflect what remains, building color subtractively from cyan, magenta, yellow, and black (CMYK).
Because the two color spaces overlap only partially, out-of-gamut RGB hues get compressed or clipped to the nearest printable CMYK equivalent. Highly saturated greens frequently print duller and darker, and bright oranges can shift toward brown. Two categories that looked clearly distinct on a monitor can end up reading as similar muted shades on paper.
When preparing charts for both media, treat screen and print as separate deliverables:
- Print a small proof early on the same paper stock and printer that will produce the final report.
- Adjust hue, saturation, and lightness directly in the CMYK version rather than relying on automatic conversion.
- Widen the lightness differences between series, since lightness contrast survives the transition to paper much more reliably than saturation.
- Keep hues within the printable gamut for the print version while retaining the more saturated palette for digital distribution.
Brand Alignment
Integrating brand colors into chart designs requires separating brand identity from data encoding so aesthetics do not compromise legibility.
- Establish a hierarchy: Use your primary brand color as the dominant hue for the most critical data series, and reserve secondary and tertiary brand colors for supporting categories. In charts with more than three or four series, supplement the brand colors with neutral or analogous tones.
- Build derived scales: Create a dedicated chart palette from your brand guidelines, including a categorical set, a monochromatic sequential ramp (varying lightness and saturation within a single brand hue), and a diverging scale.
- Protect contrast and accessibility: Brand palettes are rarely designed with data visualization in mind. Adjust the saturation or lightness of adjacent brand hues if they lack sufficient contrast or fail colorblind checks, and introduce patterns or shapes when brand colors are too close in hue.
Cultural Color Meanings
A hue that signals one concept in one region can communicate the opposite elsewhere. In Western financial markets, red is associated with danger and losses, so stock tickers and dashboards display negative figures in red and positive ones in green. In East Asia, red is tied to prosperity and good fortune; in Chinese stock markets, red indicates rising prices and gains while green marks declines. Exporting a chart from a Western template to a Chinese audience without adjustment can invert its meaning.
Other hues carry similar regional weight:
- White is associated with purity and simplicity in many Western cultures, but carries connotations of mourning in parts of East Asia.
- Green holds sacred significance in many Islamic cultures and appears on national flags across the Arab world, making careless use for arbitrary categories feel inappropriate.
- Yellow reads as caution in some markets while signifying royalty or prosperity in others.
- Warm saturated tones can read as energetic in some regions and aggressive in others.
Research the cultural associations of your target audience before finalizing a palette, and test drafts with local stakeholders. When a chart will circulate across multiple regions, avoid relying on hue alone to encode positive or negative meaning; pair color with position, text labels, or directional indicators such as arrows (+ / - or ↑ / ↓).
Color Intensity Balance
While highlight techniques use saturation to direct attention, intensity balance governs the visual comfort of the entire display. When large areas of a chart or dashboard are filled with vivid hues, the eye has no resting place. Sustained exposure to strong chroma forces continuous visual processing, which over a long analytical session contributes to visual fatigue, reduced concentration, and a tendency to look away from the screen sooner.
Manage the ratio of vivid to neutral space deliberately. Reserve high saturation for a small share of the chart’s surface area—such as a thin line or a single focal bar—and let the remaining area carry low-saturation supporting tones like soft grays, muted blues, warm off-whites, or desaturated tints of the accent hue. Equally intense colors across large fills flatten the visual hierarchy and tire the viewer. Test the palette on a full screen at realistic brightness to confirm the display remains comfortable after several minutes of viewing.
Testing Your Palette
Validate a chart palette on the actual visualization—not just a swatch strip—using three checks before publishing:
- Online contrast checkers: Paste your foreground and background hex values into tools like the WebAIM Contrast Checker or Contrast Ratio calculators to verify they meet the 4.5:1 (text) and 3:1 (marks and adjacent series) WCAG thresholds. Check every pair of neighboring colors, as collisions often hide in mid-tones sitting side by side.
- Grayscale filters: Convert the chart to grayscale using design software or a browser extension. If two series collapse into the same shade of gray, adjust their lightness values so each occupies a distinct step on the luminance scale.
- Colorblind simulators: Render the chart through browser extensions, design plugins, or web-based simulators that approximate deuteranopia, protanopia, and tritanopia. If any category pair fails to separate, shift one hue’s lightness or add a secondary pattern or label encoding.
Common Palette Mistakes
Small errors in color logic can confuse readers and undermine trust in the underlying analysis:
- Reversed or inconsistent gradient direction: Readers naturally interpret darker tones in a sequential palette as larger values. Reversing that scale so light means high, or flipping the direction between charts in the same report, leads viewers to draw inverted conclusions.
- Redundant encoding: Coloring every bar in a single-series bar chart with a unique hue adds visual noise without adding information, forcing readers to search for a non-existent relationship between color and value. Color should vary only when it distinguishes categories or signals magnitude.
- Conflicting color meanings: Using green to represent growth in one chart and negative variance in the next—or flipping red and green conventions mid-report—causes readers who skim across charts to misread results.
Standardizing Across Dashboards
When an organization publishes multiple dashboards that share common metrics, global color rules act as the connective tissue between them. Deciding once that revenue is always teal, churn is always a muted red, and specific regional categories always map to fixed hues allows a viewer who learns the color logic on an executive summary to carry that mental shortcut directly into an operations dashboard without re-reading legends.
Maintain these rules through a shared palette file or software theme imported by every report, rather than relying on manual color selection in individual charts. Document the fixed category mappings, sequential ramps, diverging scales, and reserved highlight accents in a central style guide, and review new dashboards against those specifications before publication to prevent color drift.
Frequently Asked Questions
What are categorical color schemes used for in charts?
Categorical color schemes apply to unordered groups such as product lines, regions, or survey responses. They should use colors that are immediately distinguishable and carry equal perceptual weight, so no single category draws more attention.
How do sequential and diverging color palettes differ?
Sequential palettes use a steady progression of lightness, and often hue, to mirror numeric values, while diverging palettes use two distinct hues meeting at a neutral midpoint around a central reference value.
How can I make a chart palette safe for colorblind viewers?
Red-green deficiencies are the most common form of color vision deficiency, so avoid relying on the red-green axis alone. Use hue pairs that stay separate under simulation, such as blue and orange, blue and yellow, or purple and green, and add redundant pattern, shape, or label cues.
What contrast ratio should chart text and marks meet?
Text and fine labels should meet 4.5:1 contrast, while larger filled marks and adjacent colors should meet a baseline of 3:1.
Why should I avoid rainbow palettes for charts?
Rainbow palettes create false boundaries and lack natural perceptual ordering because hue changes are not perceived uniformly. For continuous or ordered data, use perceptually uniform palettes such as viridis, magma, plasma, or cividis instead.
How should I test a chart palette before publishing?
Check foreground and background pairs with online contrast checkers, convert the chart to grayscale to see if series collapse into one shade, and run colorblind simulators. Check every pair of neighboring colors, because collisions often hide in mid-tones.
Tony Astor
Tony writes about data visualization and the tools people use to build charts and dashboards. More about Data Illustrator