Circle Packing: Visualizing Hierarchies With Nested Circles
 By Tony Astor ·

Circle Packing
Circle packing visualizes hierarchical data as nested circles, where each parent circle contains smaller child circles representing group members or sub-groups. Size encodes quantitative values via area, with radius scaled by the square root of the value to preserve proportions. It excels at showing part-to-whole relationships and containment, though precise comparisons are harder than with treemaps.
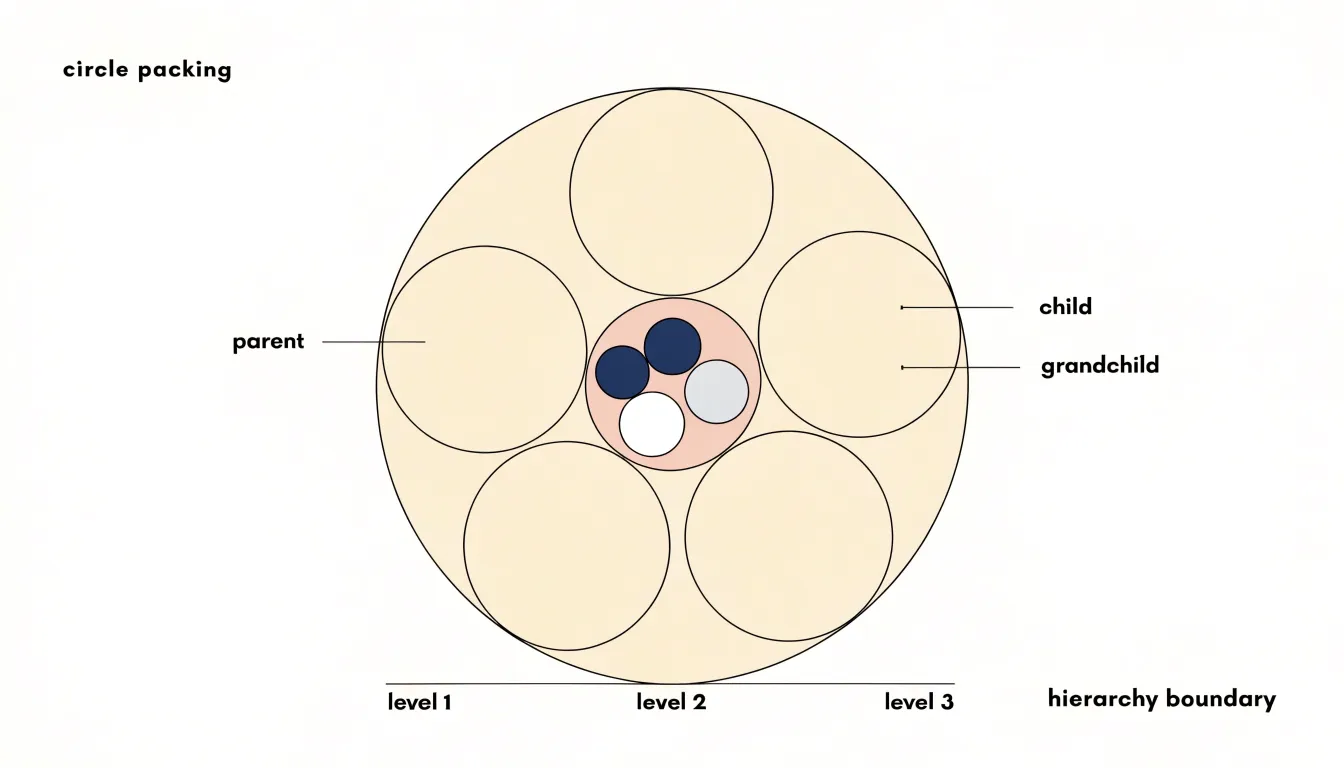
Table of Contents
Circle Packing
Circle packing uses enclosure as its core structural device, placing smaller child circles entirely within the boundary of a larger parent circle. Each parent circle represents a group, and every circle it contains represents either a member of that group or a nested sub-group with its own internal composition. The geometry makes the hierarchy physically visible: membership is expressed through containment, so a viewer can trace any individual circle upward through successive enclosing boundaries until reaching the outermost circle.
The mechanics of this arrangement depend on fitting child circles into the available interior space of their parent. The total area occupied by children is constrained by the parent’s area, which means larger groups receive larger circles and deeper levels of nesting produce progressively smaller shapes. Placement algorithms work to seat each child circle within the interior of its parent while avoiding overlap with sibling circles, packing them tightly enough to communicate cohesion yet leaving enough separation that each child’s boundary remains legible. Circle size typically encodes a quantitative value such as count, volume, or weight, so relative sizes within a parent reveal the proportional contribution of each member.
Multi-level relationships emerge from repeating this containment pattern at every depth. A first-level group holds its members; one of those members may itself be a group containing its own children; those children may contain further groups. The visual result is a series of concentric layers, each boundary marking a transition in the hierarchy. Because child circles sit fully inside their parents, there is no ambiguity about which group a given element belongs to, and no risk of a shape appearing to straddle two groups at once.
This clarity of enclosure gives circle packing its explanatory strength. Viewers can read the overall structure at a glance from the outermost circle, then descend into any branch by following the nested boundaries inward.
Size Mapping
In circle packing, size mapping refers to the practice of using the area of each circle to represent a quantitative value. This approach ensures that the visual proportions of circles accurately reflect the underlying data, so that a circle representing a value twice as large as another appears twice as large in area. Because the area of a circle is proportional to the square of its radius, the radius must be scaled by the square root of the value. For example, if one data point is four times the value of another, its radius should be twice as large, since area scales with the square of the radius.
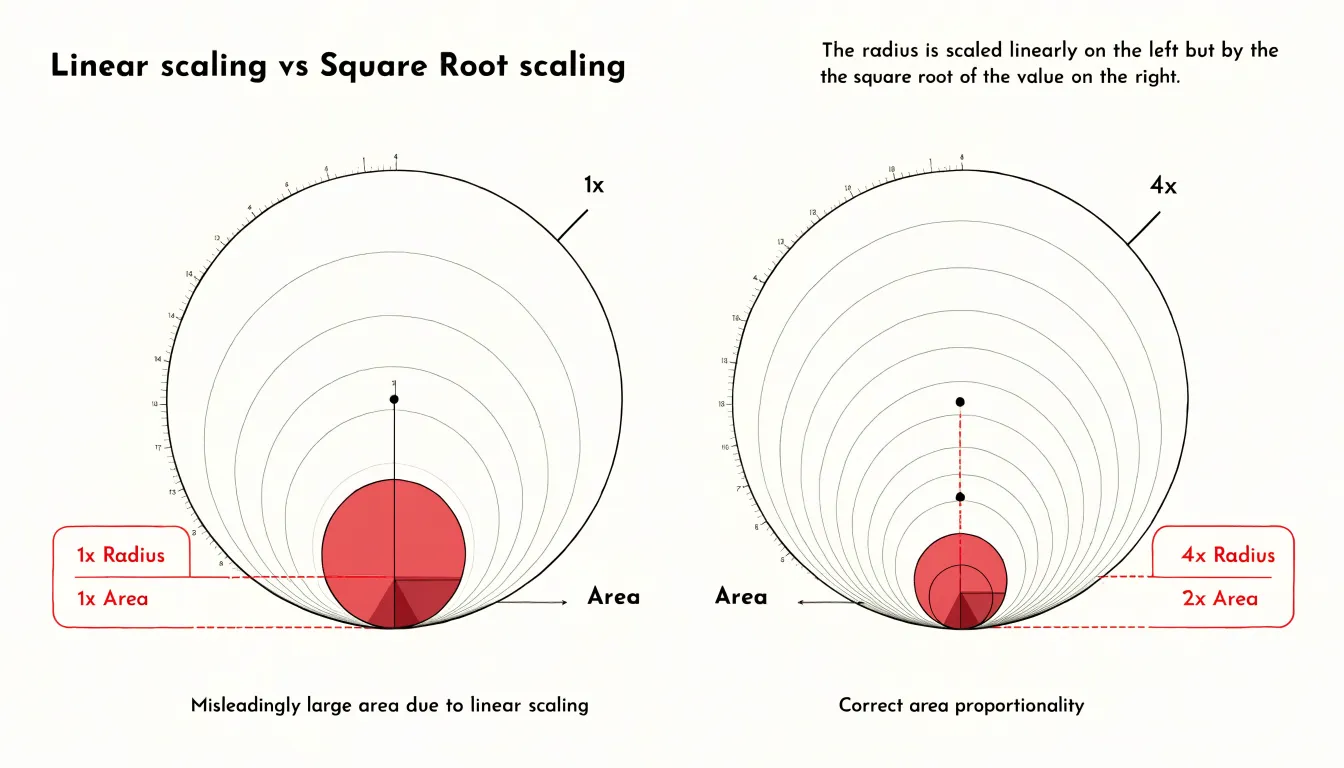
This principle is fundamental to creating truthful visualizations: if the radius were scaled linearly with the value, the area would grow quadratically, leading to a gross overrepresentation of larger values. Such misleading radius scaling can distort perceptions and lead to incorrect conclusions. Therefore, when mapping data to circle size, it is essential to calculate the radius from the area, typically by taking the square root of the normalized value and then multiplying by a constant scaling factor. This method preserves the correct area-to-value relationship and maintains visual integrity.
Careful consideration of the range of values is also important; extremely large values can dominate the visualization, while small values may become nearly invisible. Techniques such as setting a minimum radius or using a non-linear scaling for very skewed data can help, but these should be applied with caution to avoid misinterpretation. Overall, size mapping in circle packing demands attention to the mathematical relationship between area and radius to ensure that the visual representation faithfully communicates the data.
Color Coding
When a circle-packing diagram grows beyond a handful of nested circles, the eye needs help sorting one branch of the hierarchy from another. Color coding supplies that help by assigning hues to categories so that related circles read as a family and unrelated ones visibly separate. A practical approach begins at the top level of the hierarchy: each major branch receives a distinct base hue, and every child within that branch inherits some variation of the parent’s color. This inheritance lets viewers trace a small circle back up to its lineage without consulting labels, since the shared hue signals membership at every depth. Within a branch, variations in lightness or saturation can step through sub-levels, producing a gradient from the branch root down to its leaves while preserving the overall identity of the group.
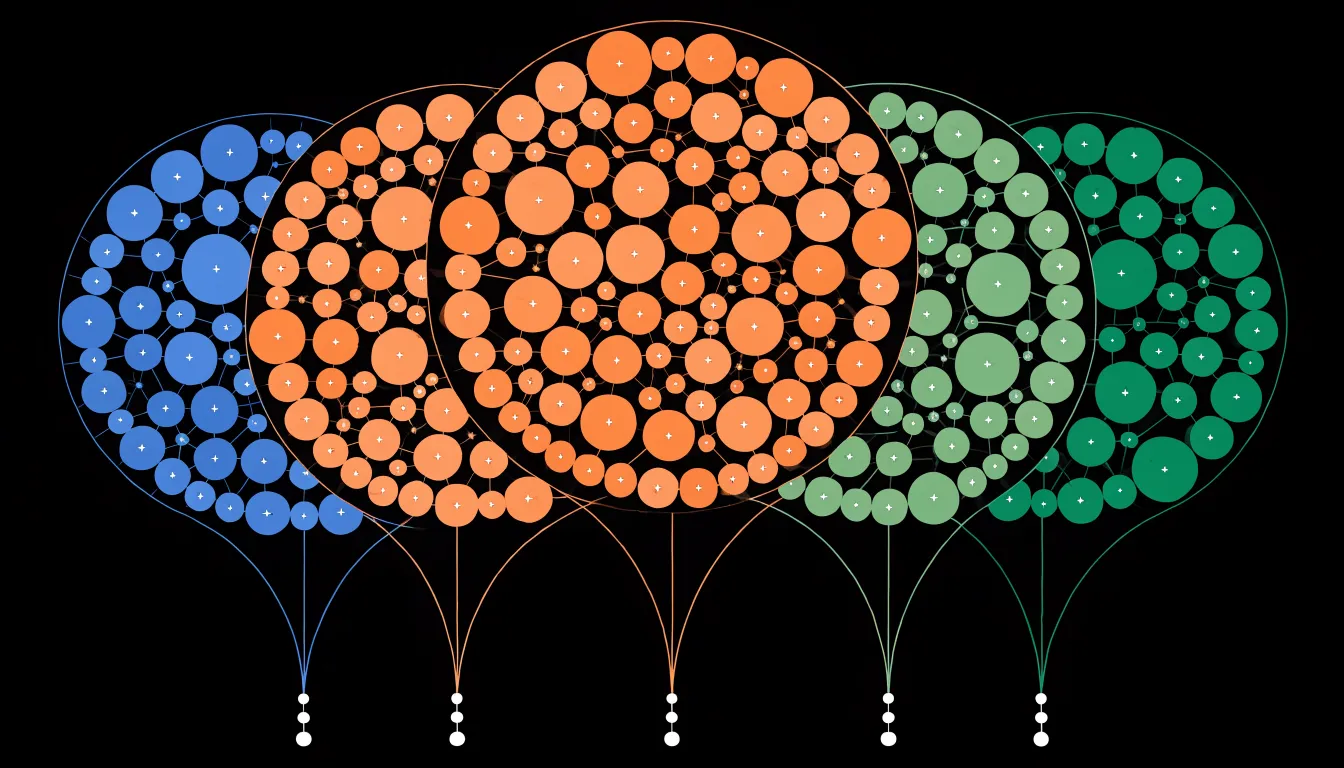
Palette choice matters as much as assignment. Categorical palettes with well-separated hues work best for branches that sit side by side, because adjacent circles of similar color blur together at small sizes. Contrast also needs attention at the boundaries: a light fill with a slightly darker stroke keeps small circles legible against larger neighbors and against the background. Limiting the number of distinct hues, often to somewhere between five and eight, prevents the diagram from turning into confetti, and reserving intense color for the categories a viewer should notice first helps direct attention where it matters.
Color can also guide focus during exploration. Highlighting one branch while desaturating the rest lets an analyst follow a path through a complex hierarchy without losing the surrounding context. Consistent coding across related views, such as a legend or a companion chart, reinforces the mapping so that users carry their understanding of the colors from one part of the interface to the next.
Labeling
Fitting readable text inside small circles is one of the most practical challenges in circle packing, because a circle offers far less usable area than its bounding box suggests. Corners vanish quickly, and any label that runs to the edges becomes clipped or visually cramped. The first technique is simply choosing the right typeface and size: condensed sans-serif fonts, moderately tight letter spacing, and a limited number of characters per line all help text sit comfortably within the curve. Labels should be centered both horizontally and vertically, with padding measured from the circle’s edge rather than its center, so that shorter lines near the top and bottom of the circle are not pushed into the narrowing arcs.
Truncation is the second line of defense. When a label exceeds the available width, an ellipsis or a shortened form preserves the meaning while signaling that more detail exists, often through a tooltip or hover state. Word wrapping across two or three short lines can work for medium circles, but the line lengths must shrink as the text moves toward the top and bottom of the circle to follow its contour. For the smallest circles, abbreviations or single-character labels may be the only viable option, with the full name revealed on interaction.
Dynamic text sizing ties these approaches together. By measuring the label against the circle’s inscribed area and iteratively reducing the font size until the text fits, a layout can adapt automatically as circle sizes change with the data. Thresholds can be set so that text below a minimum readable size is dropped entirely or replaced by an icon, keeping the visualization legible rather than cluttered with illegible fragments.
Interactive Hover
The interactive hover layer transforms the circle packing diagram from a static chart into an exploratory instrument. As the cursor moves across the canvas, each circle responds to proximity by adjusting its visual weight: a subtle outline thickens, a fill color deepens slightly, or a soft shadow lifts the shape from its neighbors. These highlight states guide the eye without demanding attention, letting viewers sense which element is currently active before they consciously decide to investigate further.
Paired with the highlight is a responsive tooltip that follows the cursor and surfaces the metadata attached to the hovered circle. This metadata can include the label, the underlying value, the parent group, the percentage of total area consumed, and any secondary attributes encoded in the visualization. The tooltip appears after a brief delay to avoid flicker during rapid cursor sweeps, and it repositions itself near the viewport edges so that it never drifts off screen. Transitions between tooltip contents are smoothed so that moving from one circle to an adjacent one feels continuous rather than jarring.
The design principle here is progressive disclosure. The primary visual interface stays clean, displaying only the packed circles and their most essential labels. Granular detail remains hidden until the viewer expresses interest through hover, keeping the initial impression uncluttered while rewarding closer inspection with rich context. On touch devices, where hover is unavailable, a tap or press gesture can trigger the same tooltip and highlight behavior, preserving parity of information access across input methods. Keyboard focus can also activate the highlight and tooltip, ensuring the detail layer remains reachable for users navigating without a pointer. Together, these behaviors make the diagram legible at a glance while remaining deep enough for sustained analysis.
Zooming
Semantic zooming gives users a way to move through the circle packing hierarchy while keeping their bearings. When a user clicks a parent circle, the view animates so that the chosen node expands to fill the display area, with its children spreading outward from their previous positions. Because the transition is continuous, viewers can track individual circles as they grow, resize, and reposition, which preserves the mental map of where they were and where they are going. This continuity matters most in deeply nested structures, where a jump cut between levels would leave users disoriented and unsure how the current view relates to the whole.
The animation itself should be smooth and responsive, typically running for a fraction of a second so that navigation feels immediate rather than sluggish. Each circle interpolates its radius and center from the old layout to the new one, with easing applied to soften the start and end of the motion. Circles that leave the visible range fade out gradually, and newly revealed children fade in, so the change in scope reads as a natural consequence of moving closer rather than an abrupt replacement of content. Interrupting an animation by clicking again should redirect the transition gracefully from the current intermediate state.
Drilling down in this way lets users inspect dense hierarchy layers without losing context. Sibling branches stay visible at the edges of the view, and a breadcrumb or parent indicator can show the path back to the root. Users can move several levels deep in quick succession, examining the fine structure of leaf nodes while retaining a sense of the larger grouping they belong to. Combined with zoom-out gestures, the same mechanism supports moving back up the tree, making exploration of large nested datasets a fluid, reversible activity that encourages users to investigate areas they might otherwise overlook.
Treemap Comparison
Circle packing and treemaps both visualize hierarchical data through nested areas, yet their trade-offs become clear once you weigh space efficiency, visual appeal, and audience engagement. Treemaps fill every available pixel with rectangles, achieving near-total space efficiency and making them the stronger choice when precise comparisons of magnitude matter, particularly for datasets with many small leaf nodes that would otherwise vanish. Circles, by contrast, leave unavoidable gaps between tangent shapes, so a circle packing consumes notably more canvas area for the same underlying values.
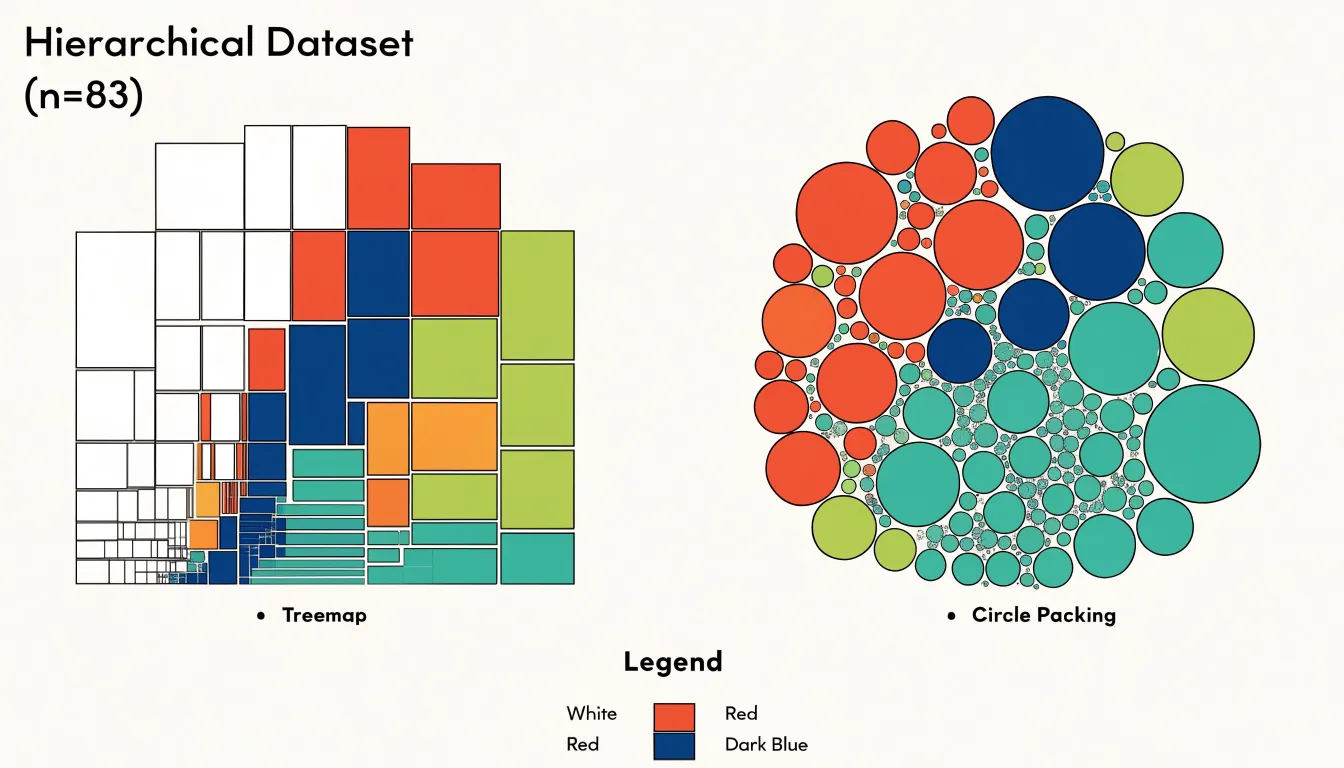
That inefficiency is the price of a softer, more organic form. Circles read as clusters and bubbles rather than tiles, which gives circle packing a distinct aesthetic advantage in presentation contexts, infographics, and exploratory dashboards where the goal is orientation rather than exact proportion reading. Audience engagement follows a similar pattern: the rounded, nested geometry of circle packing invites casual viewers to scan the overall structure and notice dominant groups at a glance, while treemaps reward more analytical readers who want to compare sibling values side by side.
The choice therefore hinges on your dataset and your audience. If your hierarchy contains dozens or hundreds of small categories and readers need to rank them by size, rectangles serve better because their shared edges and uniform shapes support direct comparison. If your hierarchy has relatively few levels, moderate branching, and you want to emphasize containment and grouping while presenting a visually inviting chart, circles deliver a clearer sense of belonging and a friendlier first impression. Consider also label placement and interaction: treemap rectangles accommodate horizontal text more reliably, whereas circle packing often requires external labels or tooltips. Matching the chart to the dataset’s density and the audience’s analytical intent yields the most effective visualization.
File System Displays
File system displays offer one of the most intuitive applications of circle packing, translating the abstract hierarchy of folders and files into a spatial arrangement of nested circles that mirrors the way storage is actually organized. Each top-level folder becomes a large enclosing circle, and every subfolder nests inside its parent, with individual files appearing as smaller circles at the deepest levels. The area of each circle corresponds to the size of the file or directory it represents, so the visual weight of the diagram immediately reflects where disk space is being consumed. This makes it possible to scan an entire drive at a glance and identify bloated directories without drilling through dozens of folder windows or running command-line summaries.
Local storage visualization is a common use case. A user with a filling hard drive can generate a packed-circle map of the home directory and see, for instance, that a downloads folder or a cache directory occupies an outsized circle relative to its apparent importance. Cloud folder structures benefit from the same treatment, since services like Drive or Dropbox often accumulate years of documents, photos, and backups whose relative sizes are invisible in a standard list view. The nested layout preserves the parent-child relationship, so a viewer can trace a large circle back through its enclosing circles to understand exactly which path is responsible for the bulk of the data.
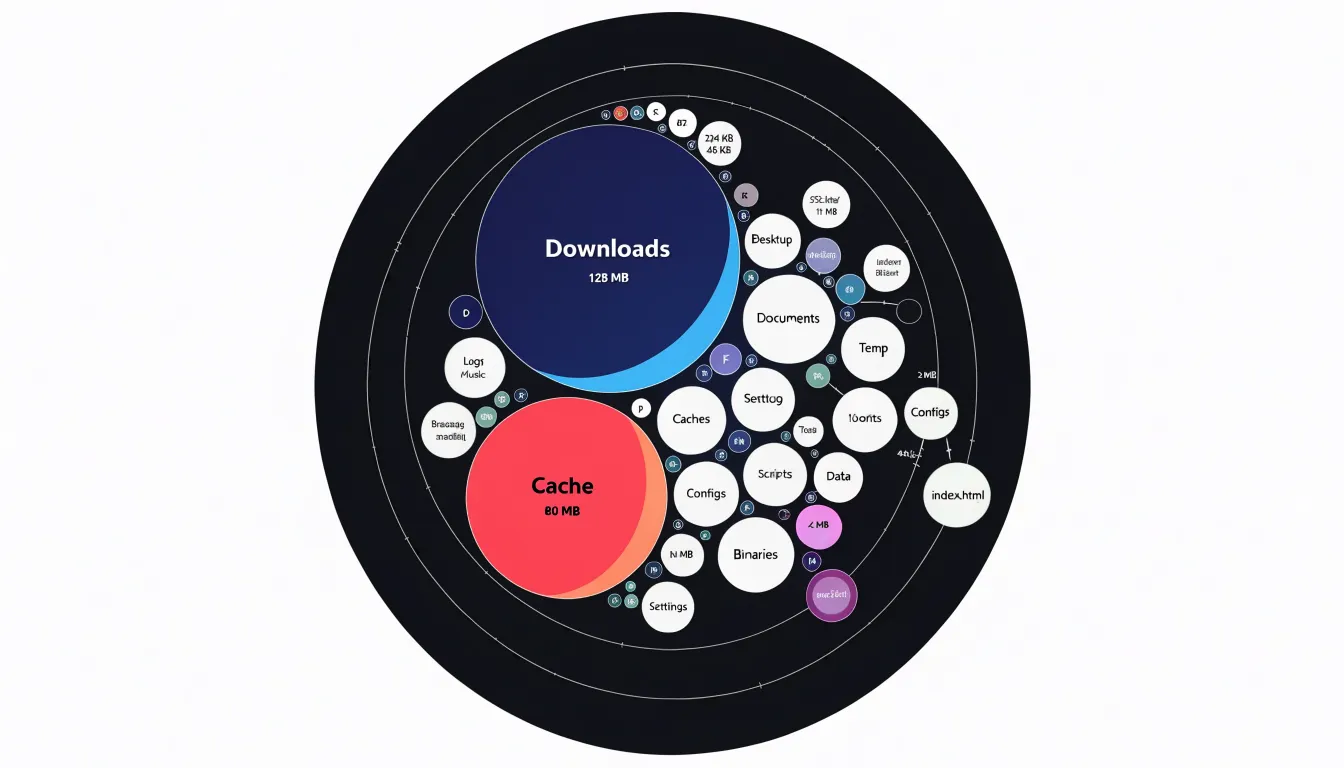
Beyond simple size inspection, these displays support quick triage. Large files stand out as prominent circles, and clusters of many small files reveal directories that are bloated through accumulation rather than a single culprit. Interactive versions let users hover or click to reveal names and exact byte counts, turning the packed layout into a navigational tool rather than a static picture. The result is a compact, readable map of storage that turns an otherwise tedious audit into a visual search for the biggest shapes.
Organization Charts
Organization charts built on bubble clusters transform the traditional hierarchy diagram into a spatial representation of headcount. Each department appears as a bubble sized in proportion to its number of employees, and related teams sit together in clusters that mirror their reporting relationships. A large bubble at the center might represent the executive office, with smaller satellite bubbles orbiting outward to show direct reports and their own sub-teams. Leaders scanning the chart can see at a glance which departments carry the most people, which units are lean, and how the overall workforce distributes across functions without reading a single number.
The value of this approach lies in immediacy. A conventional org chart lists names and titles in boxes, and extracting headcount totals requires counting or consulting a separate spreadsheet. Bubble clusters encode that information directly into area, so the relative weight of each department becomes visible in the first second of viewing. A leadership team reviewing a restructuring proposal can compare before-and-after layouts and instantly grasp where staff concentrate. Reporting lines remain intact as connecting lines or proximity groupings, preserving the structural information while adding a quantitative layer that flat diagrams lack.
Dynamic behavior extends the usefulness further. When the underlying data updates, whether from an HR system or a manually maintained roster, the bubbles resize and reposition automatically. A department that adds ten hires visibly swells; one that sheds a team contracts. Filters can isolate regions, divisions, or employment types, letting executives examine headcount distribution from multiple angles within the same visual framework. Clusters can expand into individual contributor bubbles on demand, moving from overview to detail without switching tools.
For presentations to boards and senior management, this format combines the familiarity of an organizational diagram with the analytical clarity of a proportional visualization, making workforce structure legible to both detailed and big-picture audiences.
Real World Applications
Circle packing has moved well beyond the realm of recreational mathematics and into the practical toolkits of teams that need to make dense information legible. In healthcare, analysts use packed circles to map patient populations by condition, treatment pathway, or risk tier. Each circle might represent a cohort, with area encoding the number of patients and color indicating outcomes such as readmission rates. The nested arrangement lets clinical leadership see, at a glance, which diagnosis groups dominate a hospital’s caseload and where resources concentrate, supporting decisions about staffing, outreach, and preventive programs without requiring readers to parse tables of numbers.
E-commerce teams apply the same visual grammar to market basket and customer segmentation data. A packed layout can show product categories as large circles subdivided into subcategories and individual SKUs, with the relative areas reflecting revenue or units sold. Analysts overlay color to highlight margin bands or growth trends, turning a sprawling catalog into a single readable map. Merchandising and marketing groups use these views to spot underperforming clusters, identify adjacent categories that co-purchase frequently, and communicate assortment strategy to stakeholders who lack a background in statistics.
Software engineering organizations employ circle packing for system observability and dependency mapping. Services appear as circles sized by traffic volume or error budget consumption, clustered within the teams or domains that own them. During incident reviews, engineers point to a packed diagram to show how a small, tightly coupled cluster of services created a blast radius far larger than its footprint suggested. Capacity planners likewise use packed views of resource consumption across microservices to argue for reallocation with evidence that non-specialists can follow.
Across all three industries, the common thread is narrative clarity. Circle packing trades precise comparison for immediate pattern recognition, making it effective when the story concerns proportion, containment, and grouping rather than exact values. Teams pair the visualization with annotations and drill-down detail so that the overview serves as an entry point into deeper analysis, letting diverse audiences share a common picture before debating specifics.
Common Pitfalls
Circle packing visualizations can easily become cluttered and hard to interpret if common pitfalls are overlooked. One frequent mistake is overpacking: trying to display too many circles within a limited space. When circles are packed too densely, they overlap or become so small that their labels and values are illegible. To avoid this, limit the number of circles to what the audience can reasonably process, or use interactive features like zooming and filtering to allow exploration without overwhelming the initial view.
Another pitfall is poor color choices. Using too many distinct colors, or colors that are too similar, can confuse viewers and obscure patterns. Instead, use a limited, intentional palette that groups related categories and ensures sufficient contrast between circles and the background. Consider colorblind-friendly palettes and use lightness or saturation to encode additional information subtly.
Unreadable fonts are also a common issue, especially when circle sizes vary widely. Small circles may require tiny text that is impossible to read. Solutions include using a minimum font size, placing labels outside small circles with leader lines, or providing tooltips on hover. Additionally, ensure that font styles are simple and legible, avoiding decorative fonts that distract.
Another design error is failing to provide a clear hierarchy or context. Without a legend, title, or annotations, viewers may struggle to understand what the circles represent. Always include a legend and consider adding brief explanatory text. Finally, test the visualization with real users to identify readability issues early.
Mobile Adaptation
Circle packing diagrams present particular challenges on mobile devices because their core strength, the dense display of hierarchical relationships within a compact circular area, depends on spatial precision that small viewports can compromise. A responsive strategy begins with recalculating layout parameters at each breakpoint rather than relying on simple scaling. As viewport width shrinks, node radii, padding between circles, and label thresholds should be recomputed so that the smallest meaningful circles remain distinguishable and tappable. Labels often need to collapse into icons, appear only on selection, or migrate into a tooltip layer triggered by tap.
Touch gestures offer a natural complement to this recalculation: pinch-to-zoom lets users magnify dense clusters without losing the overall structure, pan gestures allow navigation across a canvas larger than the screen, and long-press or double-tap can reveal node details on demand. Gesture handling should include sensible hit targets, typically at least forty-four pixels, and inertia scrolling so exploration feels fluid.
Collapsible drill-downs address the information density problem directly. Rather than rendering every leaf node at once, the chart can present an overview of top-level circles, with a tap expanding a chosen parent into its children while the rest of the hierarchy recedes or animates outward. Breadcrumb navigation or a compact back control keeps users oriented within the hierarchy, and transition animations preserve the mental model of where the new content originated. Combining these approaches, a mobile circle packing view can prioritize clarity over completeness, revealing detail progressively as the user expresses interest through touch.
Software Tools
A range of software tools now makes it practical to build interactive circle charts without writing a rendering engine from scratch. Among the most widely used is D3.js, a JavaScript library that provides fine-grained control over every element of a circle packing visualization. D3 includes a dedicated pack layout module that computes hierarchical circle positions and radii from nested data, handling the geometry so developers can focus on design and interaction. Because D3 binds data directly to the DOM and SVG, it supports smooth transitions, zooming, tooltips, and click-driven drill-down, making it a common choice for bespoke web-based visualizations that need to match a specific brand or interaction model.
Tableau offers a different route, aimed at analysts who prefer a graphical interface. Circle views and packed bubble charts can be assembled through drag-and-drop, with sizing driven by a measure and color encoding a category. Tableau handles aggregation and filtering automatically, and its dashboards allow viewers to interact with the chart through highlighting and parameter controls. For many business reporting contexts this is the fastest path from a dataset to a shareable, interactive circle chart.
In the Python ecosystem, packages such as circlify compute packed layouts from hierarchical values and integrate with plotting libraries like Matplotlib and Plotly. Plotly in particular produces interactive HTML output with hover labels and zooming, which suits notebooks and web apps. Other options include the JavaScript library Highcharts, which ships a packed bubble series, and R packages such as packcircles for statistical workflows. Together these tools cover a spectrum from full programmatic control to point-and-click convenience, letting practitioners choose the level of customization and coding effort that fits their project.
Overview
Circle packing diagrams offer a compact and visually engaging way to display hierarchical data, making them well-suited for executive dashboards.
Key takeaways: Circle packing excels at showing part-to-whole relationships and nested hierarchies. Because precise comparisons are difficult, circle packing works best for a high-level overview rather than detailed analysis.
Ideal use cases: Circle packing is effective for portfolio overviews, budget allocations, market share breakdowns, and any dataset with a clear hierarchical structure. It shines when the goal is to highlight the largest contributors or to show the composition of a whole. In executive dashboards, it can serve as a summary visual that directs attention to areas needing deeper investigation.
Design best practices: Use a limited color palette to distinguish top-level categories, with shades or tints for subcategories. Label circles directly when possible, prioritizing larger circles to avoid clutter. Ensure sufficient contrast between text and background. Provide interactive elements like tooltips or drill-downs for detailed values. Maintain consistent sizing across dashboards to avoid misinterpretation. Avoid overloading with too many small circles; aggregate minor categories into an “Other” group.
Frequently Asked Questions
What is circle packing?
Circle packing is a visualization that places smaller child circles entirely within a larger parent circle to show hierarchical data, with each parent representing a group and each contained circle representing a member or nested subgroup.
How do you size circles in circle packing?
Circle area should represent the quantitative value, so the radius must be scaled by the square root of the value. For example, if one data point is four times another, its radius should be twice as large.
How should I color a circle packing chart?
Assign a distinct base hue to each top-level branch, and let children inherit variations of the parent’s color, using lightness or saturation to step through sub-levels. Limit distinct hues, often to somewhere between five and eight, and ensure contrast at circle boundaries.
How can I make labels readable inside small circles?
Use condensed sans-serif fonts, moderately tight letter spacing, limited characters per line, centered text, and padding measured from the circle’s edge. Truncation, word wrapping, abbreviations, dynamic text sizing, or dropping text below a minimum readable size can help when circles are small.
What is the difference between circle packing and a treemap?
Treemaps fill every available pixel with rectangles and are stronger for precise magnitude comparisons, especially when there are many small leaf nodes. Circle packing leaves unavoidable gaps between tangent shapes but offers a softer, more organic form that works well for presentation contexts and high-level orientation.
What are common mistakes to avoid in circle packing?
Common mistakes include overpacking too many circles, using poor color choices, using unreadable fonts, and failing to provide clear hierarchy or context such as a legend, title, or annotations. Limit circles to what the audience can process, use an intentional palette, ensure legible text, include explanatory context, and test the visualization with real users.
Tony Astor
Tony writes about data visualization and the tools people use to build charts and dashboards. More about Data Illustrator