Choropleth vs Bubble Map: How to Map Your Data
 By Tony Astor ·

Choropleth vs Bubble Map
A choropleth map shades predefined regions by color to show rates, ratios, or densities, while a bubble map sizes circles at exact coordinates to show absolute values. Choose choropleths for normalized regional intensity, bubble maps for point-based magnitudes, and hybrid maps to combine both variables.
Table of Contents
Choropleth Map
A choropleth map uses color shading to represent data values across predefined geographic regions, such as countries, states, or counties. Each region is filled with a hue or saturation corresponding to a statistical metric aggregated within that boundary—for example, shading states by population density, with darker shades indicating higher densities. Raw point-level data are summarized to the regional level, often as counts, averages, or rates, to show patterns across areas rather than individual locations.
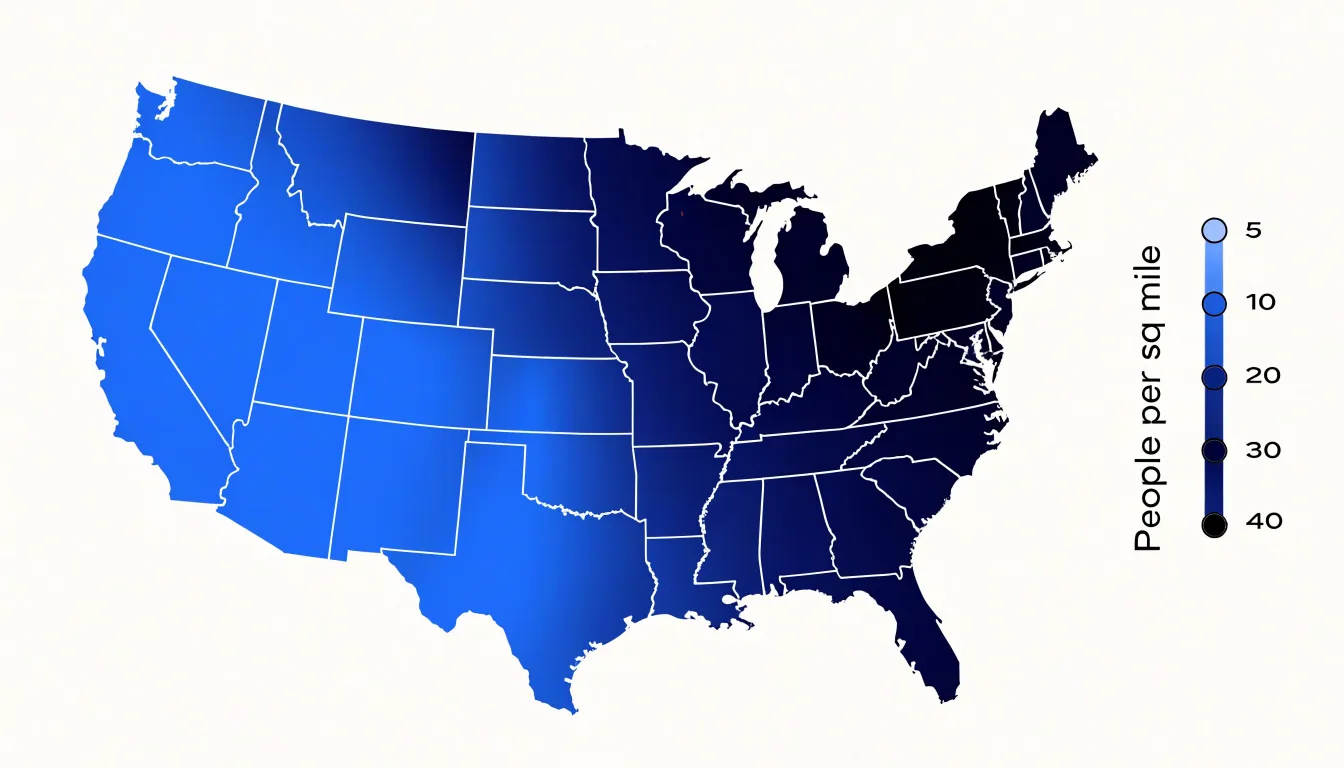
The choice of color scheme matters: sequential palettes use hue or saturation shifts to imply order, while diverging palettes highlight deviations from a midpoint. Proper design also requires data normalization, as raw counts can mislead when regions vary in size or population. By aggregating data within predefined boundaries, choropleths enable viewers to compare regions and identify spatial trends, though their effectiveness depends on the appropriateness of the boundaries and the color scale.
Bubble Map
A bubble map places circle markers at specific coordinate points on a map, with each circle sized according to a metric’s value at that location. The process begins with geocoding: every record is tied to a latitude and longitude pair, and a circle is drawn centered on that point. The area of each circle is scaled in proportion to the underlying value, often bounded by a minimum and maximum size so tiny values remain visible and extreme values do not overwhelm the frame.
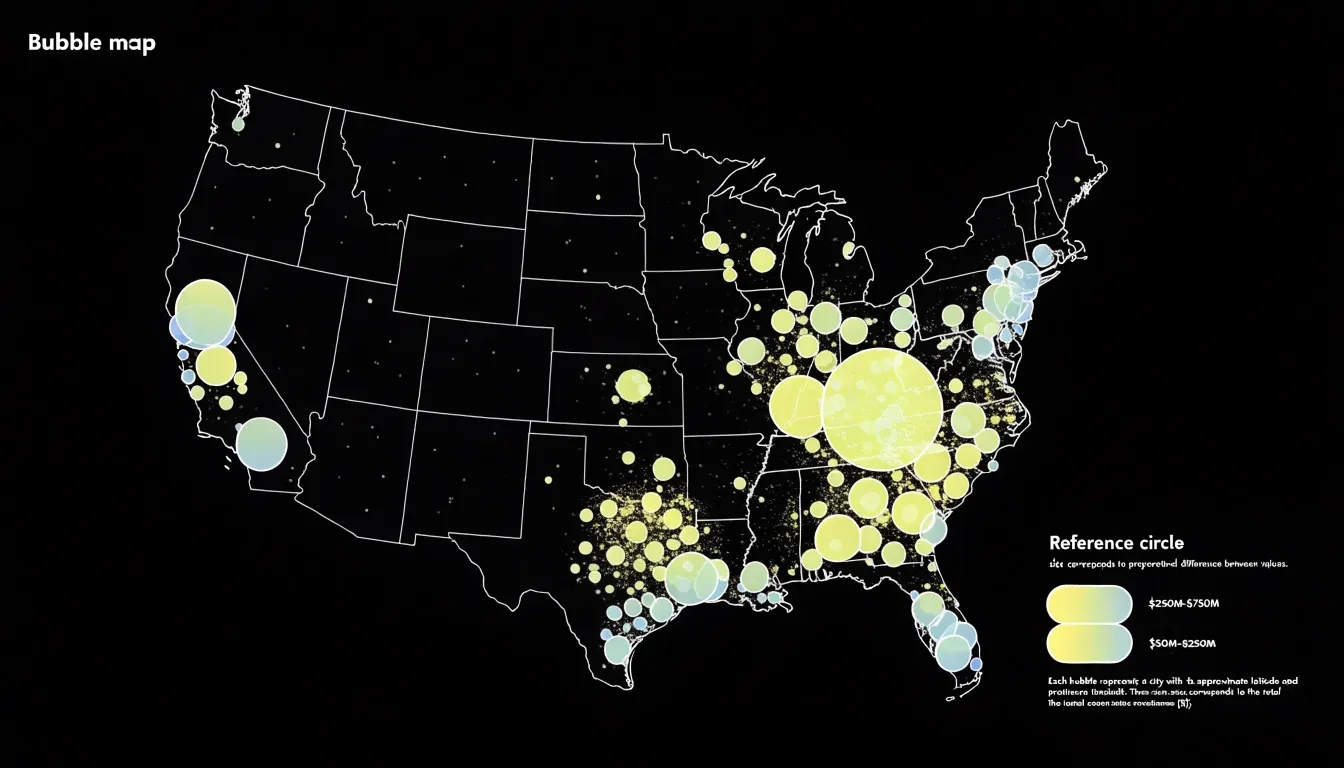
Color and opacity can reinforce the size encoding or carry a second variable, while thin outlines help overlapping circles stay distinguishable. Because markers are anchored to exact points, bubble maps suit naturally point-based data—such as store locations, earthquake epicenters, or city-level totals—and handle wide value ranges gracefully since the size channel is continuous. Designers typically add a legend with reference circles and labeled values so readers can translate marker size back into numbers. Transparency and slight jitter help when points cluster densely, while tooltips or labels supply precise figures that visual sizing alone cannot convey.
Color Scales
In choropleth maps, the choice of color palette determines whether viewers can accurately perceive underlying values and relationships.
- Sequential palettes are the default choice for most choropleths. They progress from light to dark or from one hue to another, creating a visual ordering that mirrors numerical order. Aim for a smooth, monotonic progression in perceived lightness so darker shades consistently represent higher values and lighter shades represent lower values.
- Diverging palettes suit data with a meaningful midpoint, such as a national average or zero. They use two distinct hues that converge on a neutral light color at the center, distinguishing values above and below the midpoint. Choose hues balanced in visual weight so neither side dominates.
- Categorical palettes are designed for data grouped into discrete classes without an inherent order, relying on distinct, easily distinguishable hues. If classes do have an underlying order, a categorical palette can obscure it and distort perception.
Perceptual uniformity is also important. Some palettes, like the rainbow scale, are not perceptually uniform and can create false boundaries or mislead viewers about the magnitude of differences. Test your chosen palette with a grayscale version of the map; if the data patterns remain visible, the palette relies on sufficient lightness variation to be effective.
Circle Sizing
Circle sizing in a bubble map requires matching the numeric value to human perception. A common mistake is scaling the radius directly to the data value. Because doubling a radius quadruples the area, a circle twice as large in diameter appears four times as large in area, causing readers to systematically overestimate differences. The human eye compares the area of circles rather than their diameters, so the visual encoding must match that perceptual reality.
Linear area scaling ties the circle’s area proportionally to the data value: if one value is double another, the larger circle covers twice the area. This preserves accurate ratio judgments and works well when the value range is moderate. The corresponding radius is derived by taking the square root of the value before applying a constant scale factor, a technique called square-root scaling.
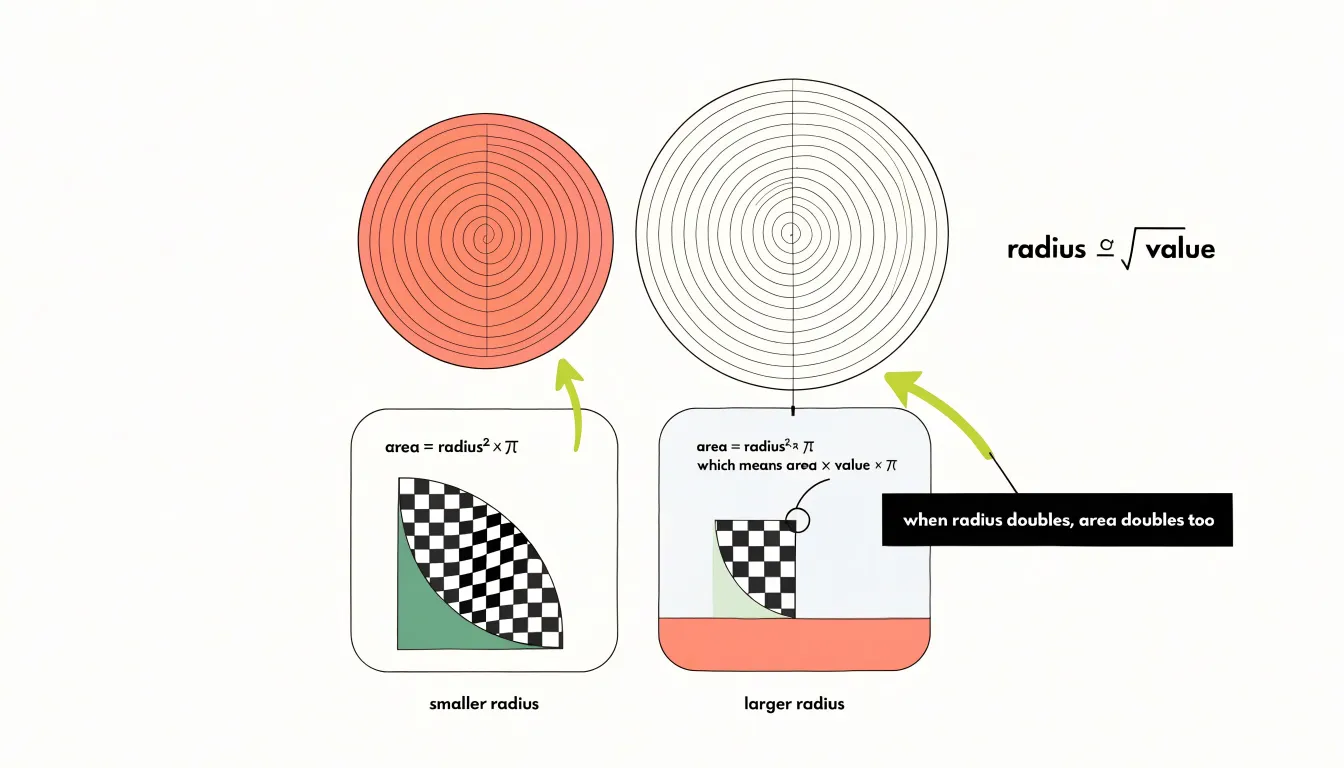
To apply the scale, determine the maximum value in the dataset and choose a maximum circle radius that fits the layout without overlapping neighboring markers. Compute each circle’s radius as the maximum radius multiplied by the square root of its value divided by the maximum value. This ensures the largest bubble hits the size cap while every other bubble retains a correct proportional area.
Under strict area scaling, very small values can shrink to near-invisibility. Setting a minimum radius keeps tiny bubbles perceptible while preserving the overall ratio, though this introduces slight distortion that should be documented. Testing the scale against sample ratios helps confirm that viewers read the sizes accurately.
Geographic Boundaries
Every shaded polygon in a choropleth map represents an administrative or statistical unit that aggregates individual observations into a single value. When data is grouped by countries, states, counties, or zip codes, the map inherits the political and bureaucratic logic of borders drawn for governance, taxation, or postal delivery. These borders rarely align with the natural distribution of the mapped phenomenon. A zip code boundary, for instance, may split a neighborhood with uniform income levels across several polygons, or merge vastly different communities into one unit. Consequently, the color pattern reflects both the underlying data and the geometry of the aggregation units, making the two difficult to separate visually.
Boundary selection also governs how much internal variation disappears. Larger units like countries or states smooth over local differences, producing a clean but coarse picture. Finer units like census tracts or zip codes retain detail at the cost of visual clutter and greater sensitivity to small population sizes. Units with very small populations can produce extreme values that dominate the color scale even when the raw numbers are statistically unstable.
The modifiable areal unit problem compounds these concerns: changing the aggregation boundaries can shift correlations and alter the apparent geography of a phenomenon without any change in the source data. Designers should therefore document which boundaries were used, consider whether alternative aggregations would tell a different story, and communicate the aggregation level so readers interpret the shaded regions as statistical constructs rather than natural features.
Exact Coordinates
Bubble maps use latitude and longitude pairs to place each marker at an exact location—whether a storefront, a landslide event, a wildlife sighting, or a customer address. This positional accuracy shows where phenomena occur down to a street corner or field boundary.
This precision is valuable when data varies sharply within small areas. Because a choropleth assigns a single value to an entire administrative unit, every observation inside that boundary inherits the same regional figure. A bubble map plots each point on its own, preserving fine-grained variation that aggregation would smooth away. Dense clusters, isolated outliers, and gradual spatial gradients remain visible in their original arrangement.
Using coordinates directly also frees the analysis from existing boundary files. Data from GPS devices, geocoded addresses, or field surveys does not need to be matched to census tracts, postal codes, or council areas. This flexibility supports mapping across mixed geographies, where observations span multiple jurisdictions or fall outside standard administrative units. Analysts can combine datasets from different sources on a single map as long as each record carries a valid coordinate pair.
Practical implementation involves storing latitude and longitude in separate numeric fields and validating them before plotting. Marker size or color encodes an additional variable, such as magnitude or count, while position remains fixed to the true location.
Area Size Bias
Area size bias arises because choropleth maps shade entire regions in proportion to their geographic footprint. A sprawling rural district can dominate the visual field even when its population or value is modest, while a small, densely populated city occupies a sliver of the page despite carrying far more of the underlying data. Readers perceive color-weighted area rather than statistical weight, distorting where activity concentrates.
Several strategies help mitigate this distortion:
- Normalize the values: Use rates, densities, or per-capita figures instead of raw totals so large regions are judged on intensity rather than extent.
- Switch to a bubble map: Symbol size encodes the variable while position carries approximate location, keeping small, high-value areas visible without being swallowed by neighbors.
- Use cartograms or hexagonal tile grids: Shrink or replace geographic areas with uniform shapes so each unit receives comparable visual space regardless of its real-world footprint.
- Adjust design choices: Use palettes with clear breaks, add data labels for small but significant regions, and provide an inset or magnified view of dense urban cores. Transparency settings and thin borders can also reduce the apparent weight of expansive polygons.
- Pair with a supplementary chart: A ranked bar graph gives readers a size-neutral reference for the same values.
Marker Overlap
When multiple data points cluster in dense areas on a bubble map, overlapping circles can obscure information and make the visual unreadable. Mapmakers can address this using several techniques, depending on the data and the map’s purpose:
- Adjusting opacity: Making bubbles semi-transparent causes overlapping areas to become darker, revealing data concentrations without losing individual marker distinctions.
- Dynamic zoom levels: As users zoom in, bubbles can scale down or adjust relative to the zoom level, preventing overlap at higher zoom levels while maintaining an overview at lower levels.
- Jittering: Slightly offsetting markers from their exact coordinates spreads out dense clusters. This introduces minor spatial inaccuracy but improves readability when overall patterns matter more than precise locations.
- Clustering: Grouping nearby markers into a single symbol that expands upon interaction keeps the view clean.
- Size scaling: Reducing bubble sizes in dense areas helps prevent collisions.
Regions vs Points
When viewing a choropleth map, the visual system engages with continuous patches of color filling entire regions. The brain treats these shaded areas as properties of the region itself. While this area-based encoding uses our ability to judge relative size and color intensity across large zones, larger regions dominate attention regardless of their values, and subtle color differences are harder to discriminate than distinct point symbols. Moreover, the visual system integrates color over the entire area, which can blur boundaries and make comparisons between adjacent regions feel less precise.
In contrast, a bubble map presents discrete circles at specific locations. The visual system processes each circle as an independent object with its own size, color, and position. Because the brain is adept at comparing the size of distinct shapes, this object-based encoding makes bubble maps effective for highlighting local magnitudes or outliers, while spatial separation between symbols reduces interference from surrounding elements. However, because the underlying region is not shaded, viewers must rely on position alone to infer geographic context. Instead of scanning continuous areas, the eye jumps from circle to circle, aggregating information in a more serial, less holistic manner.
Ultimately, choropleths encourage a sweeping, region-based interpretation that emphasizes territorial trends, while bubble maps promote a targeted, location-specific reading that draws attention to individual data points.
Density Distortion
Plotting raw count data on a choropleth map creates a recurring visual distortion. Because a region’s color is determined by the magnitude of its assigned value, a simple tally of people, cases, or events rewards physical or population size. Large, sparsely populated areas can accumulate counts and saturate the legend even when their internal density is low, or a compact city district holding hundreds of thousands of residents may appear lighter than a rural county several times its size with a comparable total.
Normalization resolves this by converting counts into rates, changing the comparison from absolute magnitude to relative intensity:
- Per-capita figures (dividing a count by population) express how common something is among residents. These suit outcomes tied to people, such as disease incidence or voter turnout.
- Density figures (dividing by land area) express concentration across territory. These suit phenomena tied to space, such as traffic collisions per square kilometer.
Thematic cartography treats population or area as an exposure variable that makes units comparable. When a map shows rates rather than totals, readers can scan color differences without mentally correcting for how many people or how much land each polygon contains.
Combined Encoding
Combined encoding communicates two distinct data variables on a single map by layering choropleth shading beneath proportional bubbles. The choropleth layer assigns color values to geographic regions (typically a rate, ratio, or density like median income), while the bubble layer overlays symbols sized to a second variable (such as total population, sales volume, or absolute counts). Because viewers process color and size independently, the two layers can coexist if designed carefully.
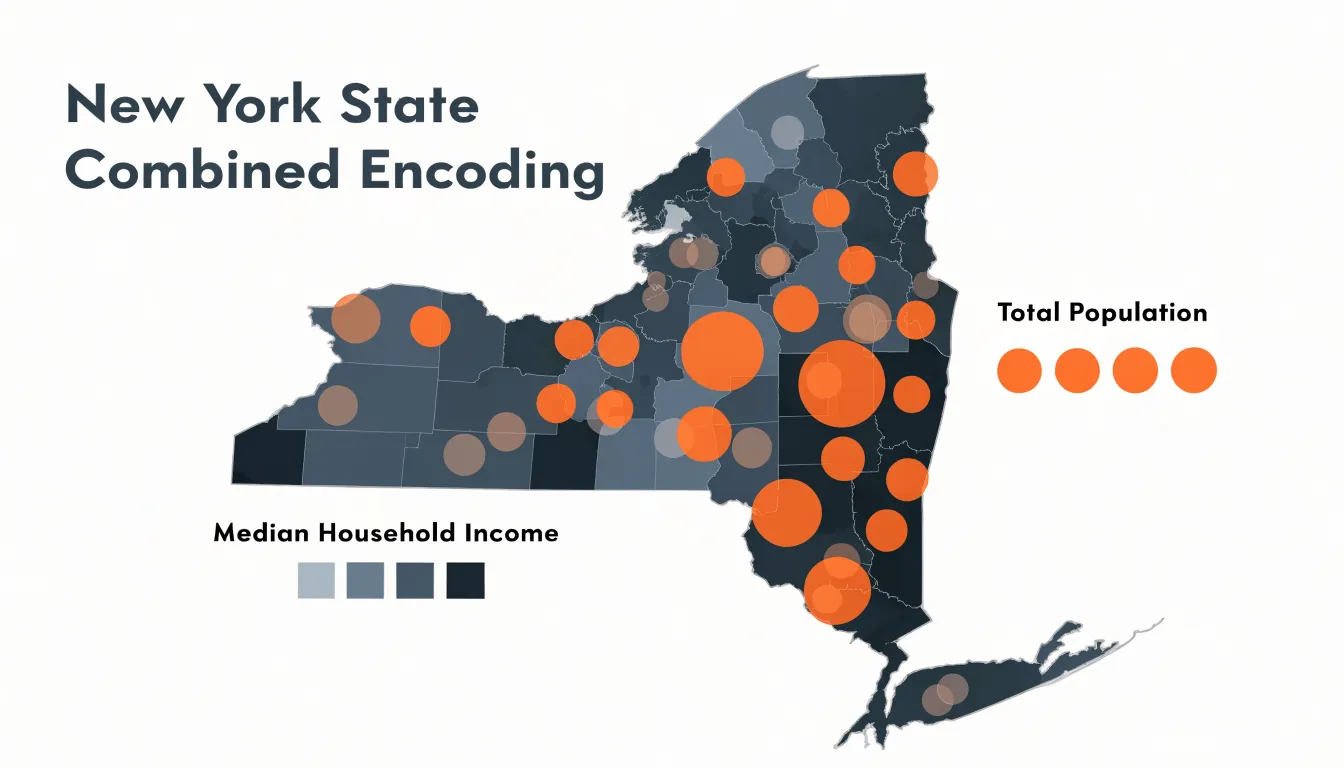
Building an effective combined map begins with choosing related variables that measure different things—commonly contrasting an intensity measure (shading) with a magnitude measure (bubble size). Combined encoding works best when the two variables tell a coherent story together, revealing patterns such as high rates concentrated in regions with low absolute counts. To prevent large bubbles from obscuring the color of small regions, authors often position symbols at region centroids and keep the maximum bubble size modest relative to the map area.
Accessible Colors
Color blindness affects a substantial share of any audience, with red-green deficiencies touching roughly one in twelve men and a smaller proportion of women. When a map relies on red-to-green gradients or saturated rainbow ramps, affected readers cannot distinguish categories or read magnitude. Accessible design uses palettes that vary in lightness as well as hue, allowing readers to rank regions or bubbles by relative brightness.
- Viridis and its relatives move from dark purple through blue and green to bright yellow, producing a monotonic increase in perceived luminance that survives desaturation and most color vision deficiencies. It works well for sequential and continuous data, and its perceptual uniformity means equal steps in data look like equal steps in color.
- ColorBrewer offers curated sequential, diverging, and qualitative schemes flagged for colorblind safety. Its palettes are sized to the number of classes a map needs, helping designers avoid squeezing too many categories into a single hue family. Diverging schemes like blue-to-orange ramps preserve a clear visual midpoint and keep both extremes legible.
For practical application, preview the map under simulated deuteranopia and protanopia filters in your design or GIS tool to confirm every class remains distinguishable. Pair color with redundant encoding where possible—adding labels, patterns, or size differences so information never depends on hue alone. Keep the number of classes modest, ensure sufficient contrast against the basemap, and document the palette choice for future editors.
Common Mistakes
Designers new to cartographic visualization often encounter several recurring pitfalls beyond unnormalized counts, unscaled radii, and marker overlap:
- Poor scale choice on skewed data: Mapping heavily skewed distributions with a linear scale allows a few extreme values to dominate the color ramp, collapsing most of the map into a single indistinguishable shade. Classed schemes, quantiles, or logarithmic transformations often communicate the pattern more faithfully.
- Flawed class breakpoints: Choosing too many classes overwhelms the legend, while too few obscure meaningful variation.
- Incomplete legends: Legends that lack clear value labels or omit units of measurement leave readers guessing. Every map should pair its visual encoding with an explicit, readable key.
Hybrid Maps
While combined encoding typically places bubbles at regional centroids to pair two regional metrics, hybrid maps also use bubble markers to locate specific point quantities—such as cities, facilities, or events—whose values would be flattened or hidden if aggregated into the underlying regional shading. The choropleth layer establishes broad patterns, while the bubbles highlight local concentrations or outliers.
The central challenge in any layered map is visual noise, as overlapping encodings compete for attention. Effective hybrids manage this through visual hierarchy:
- Color and contrast: Keep the choropleth palette muted and low in saturation so regions recede into the background, reserving stronger colors or higher contrast for the foreground bubbles.
- Strokes and halos: A light stroke or subtle halo around each marker separates it from busy fill patterns without adding clutter.
- Transparency and ordering: Semi-transparent bubbles keep the regional color visible beneath them. Draw bubbles above shaded regions, and place smaller markers on top of larger ones so dense clusters do not hide smaller members.
- Dual legends: Provide two clearly positioned, distinctly labeled legends—one for the color ramp and one for the size scale—reinforced by annotations or a short caption so readers know which visual channel carries which variable.
Choosing a Map Style
When deciding between a choropleth map, a bubble map, or a hybrid approach, match the format to your data’s structure, granularity, and analytical goals:
- Choropleth maps suit rates, ratios, and densities tied to a complete set of defined geographic polygons. Use them when the goal is to compare relative intensity across regions.
- Bubble maps suit absolute counts or magnitudes, and can handle sparse or point-based data not confined to administrative boundaries. Use them to emphasize the location and size of individual occurrences or largest concentrations.
- Hybrid maps suit displaying two related variables—one normalized background context and one absolute point or regional measure—when the added nuance justifies managing the potential visual clutter.
Test your choice with a small sample of your data to confirm which format communicates the spatial pattern most clearly.
Frequently Asked Questions
When should I use a choropleth map versus a bubble map?
Use a choropleth map for rates, ratios, and densities tied to a complete set of defined geographic polygons, especially when comparing relative intensity across regions. Use a bubble map for absolute counts or magnitudes and for sparse or point-based data not confined to administrative boundaries.
Why do choropleth maps need normalized data?
Raw counts can mislead when regions vary in size or population, allowing large or populous areas to dominate the map. Normalization converts counts into rates, densities, or per-capita figures so readers can compare relative intensity instead of absolute magnitude.
How should I scale circle sizes on a bubble map?
Scale the circle’s area proportionally to the data value rather than scaling the radius directly. The radius is derived by taking the square root of the value before applying a constant scale factor, often calculated as the maximum radius multiplied by the square root of the value divided by the maximum value.
How do I stop bubbles from overlapping on a map?
Mapmakers can adjust opacity, use dynamic zoom levels, jitter markers slightly, cluster nearby markers, and reduce bubble sizes in dense areas. These techniques help prevent overlapping circles from obscuring information and making the visual unreadable.
Which map colors are accessible for colorblind readers?
Accessible design uses palettes that vary in lightness as well as hue, such as Viridis and ColorBrewer schemes flagged for colorblind safety. Preview the map under simulated deuteranopia and protanopia filters and pair color with redundant encoding such as labels, patterns, or size differences.
What is a combined encoding map?
Combined encoding layers choropleth shading beneath proportional bubbles to communicate two distinct data variables on a single map, such as an intensity measure shown by color and a magnitude measure shown by bubble size. Designers often position symbols at region centroids and keep the maximum bubble size modest so large bubbles do not obscure the color of small regions.
Tony Astor
Tony writes about data visualization and the tools people use to build charts and dashboards. More about Data Illustrator