Chord Diagram: Showing Relationships Between Groups
 By Tony Astor ·

Chord Diagram
A chord diagram is a circular visualization that displays relationships between entities using nodes arranged around a perimeter and ribbons connecting them across the center. Ribbon width is proportional to the magnitude of each relationship, such as flow volume or connection strength, while outer arc length shows each node’s total connections, revealing patterns of dependency, reciprocity, or dominance.
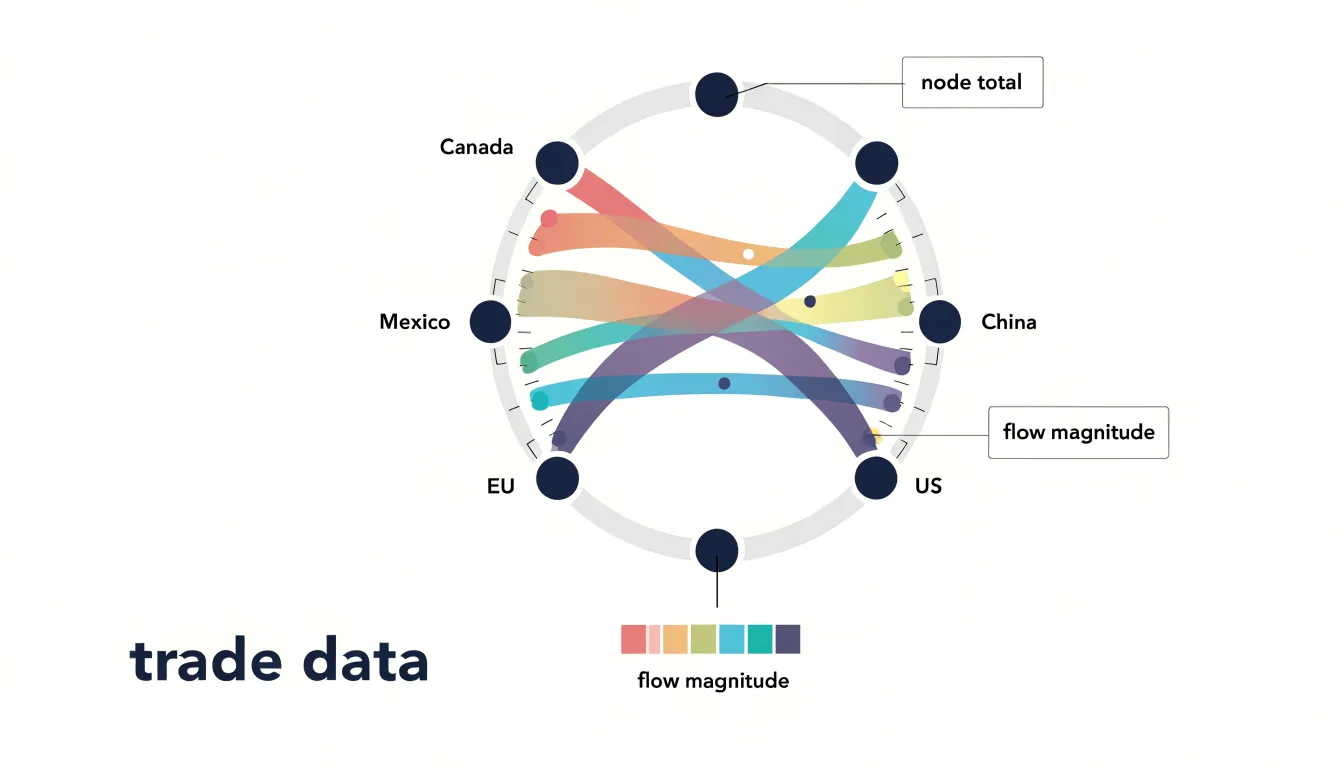
Table of Contents
Chord Diagram
A chord diagram is a visual tool for displaying relationships between entities, often used to show flows, connections, or correlations. The diagram consists of a circle with nodes placed along the perimeter, each node representing a category or entity. These peripheral nodes are typically arranged evenly around the circle, though their placement can be adjusted to highlight specific groupings or hierarchies. From each node, arcs (or ribbons) extend inward, connecting to other nodes across the circle. The width of each ribbon is proportional to the magnitude of the relationship it represents, such as the volume of a flow or the strength of a connection. The length of an outer arc, determined by the portion of the circle it spans, indicates the relative size of the node’s total connections—longer arcs correspond to nodes with larger totals.
To read a chord diagram, start by identifying the nodes and their sizes. The arc length for each node represents its total involvement in the relationships shown. Then, trace the connecting ribbons: a thick band between two nodes signifies a strong or large relationship, while a thin band indicates a weaker or smaller one. The direction of flow, if relevant, can be shown with arrows or color gradients. By following the connections, you can quickly see which entities are most interconnected and where the major exchanges occur. This layout makes chord diagrams especially effective for revealing patterns of dependency, reciprocity, or dominance within a system, such as trade flows between countries or interactions in a social network.
Chord Diagram
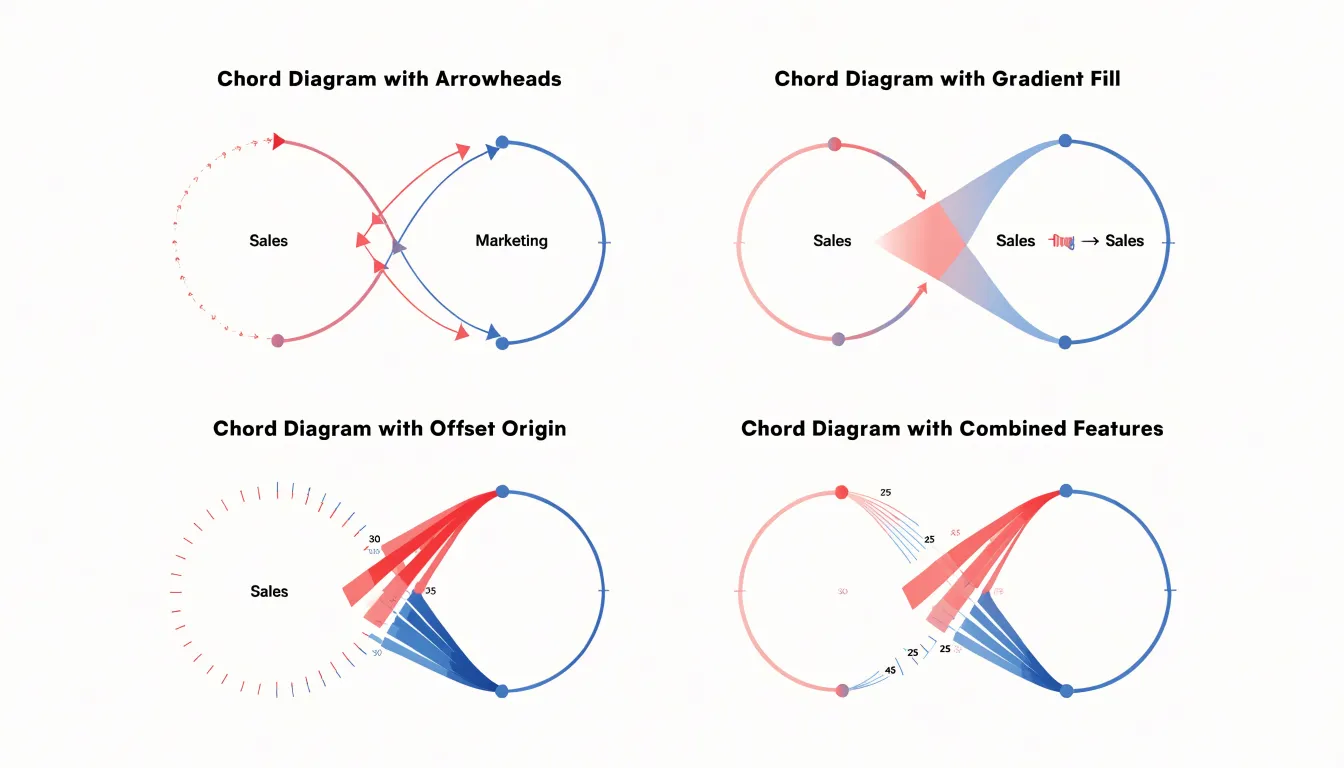
Directional cues transform a chord diagram from a static summary into a readable map of movement between categories. The most direct method is the arrowhead: by placing a small triangular marker along a chord near its destination arc, the viewer can immediately tell which end of the connection receives the flow. Arrowheads work best on diagrams with relatively few chords, since each marker adds visual clutter and the diagram can quickly become busy when dozens of connections compete for attention.
Gradient fills offer a subtler alternative. By blending the color of the source category into the color of the target category along the length of the chord, the direction of flow becomes legible through color transition rather than through added geometry. This approach scales well to dense diagrams because the chords themselves carry the directional information without extra elements. Designers should keep the palette limited and the color contrasts strong enough that the transition reads clearly at small sizes.
Offset chord origins provide a third technique. Instead of anchoring both ends of a chord at the exact center of an arc, the origin end can be shifted slightly along the arc relative to the destination end. The resulting asymmetry signals movement, and paired with a tapered width — thicker at the source, thinner at the destination — it can encode both direction and volume. Offsets require careful tuning so that chords do not overlap or obscure neighboring connections.
In practice, combining methods often yields the clearest result: a gradient for overall direction plus a modest taper or arrowhead at the terminus for confirmation. Whichever method is chosen, consistency across all chords is essential, because mixed directional conventions leave readers guessing about the underlying data.
Chord Diagram
This circular structure becomes especially valuable when the primary question is about proportions. Because each arc’s length can be scaled to represent a total, such as trade volume, population flow, or message count, viewers can immediately compare the relative size of categories without hunting through a sprawling node-link layout. In a network graph, node size often encodes magnitude imprecisely, and edges crossing a large canvas make it difficult to judge which categories dominate. The circular arrangement keeps every category visible on a single perimeter, so rank and share become readable at a glance.
The chord format also excels when the dataset contains a manageable number of categories with dense interconnections among all of them. Migration between regions, bilateral trade between countries, or transitions between website sections fit this pattern. When nearly every category connects to nearly every other, a network graph turns into a dense web of overlapping edges that obscures structure. A chord diagram instead confines connections to the interior of the circle, where color and ribbon width carry the quantitative message and the symmetry of the layout makes reciprocal flows easy to compare.
Comparisons of relationships benefit as well. Ribbons that leave one arc and arrive at another show direction and volume together, and grouping related arcs along the perimeter highlights clusters of interaction. Analysts examining flows between departments, energy transfers between sectors, or passenger movements between hubs can trace a single category’s total outgoing and incoming connections by following its arc around the circle.
The chord diagram is the stronger choice when the audience needs a compact, proportionate overview of many-to-many relationships within a closed set of categories, and when the story concerns relative volumes rather than the path or topology of individual links.
Chord Diagram
Preparing your data as a matrix is the foundational step that determines how cleanly a chord diagram will render. A chord diagram expects a square matrix in which each row and each column corresponds to the same set of entities, so that every cell holds the value of the relationship between the entity at that row and the entity at that column. Begin by defining your full list of categories, whether they are countries, departments, products, or any other group you want to compare. The order of this list should be applied consistently to both axes. Build a table where the diagonal often represents flows within a group, while off-diagonal cells capture connections between distinct groups. Fill missing pairs with zeros so the matrix remains rectangular in shape, and confirm that each cell contains a single numeric value rather than text or mixed types.
Many visualization tools also accept a relational edge list, a two-column format listing a source and a target for each connection along with a weight. Converting an edge list into a square matrix is straightforward: collect every unique source and target into one shared set of labels, then place each weight at the intersection of its source row and target column. Watch for asymmetrical relationships, where the value from A to B differs from the value from B to A; a directed chord diagram needs both directions preserved, while an undirected one may require summing or averaging the pair.
Normalize or scale values when magnitudes vary widely, since very large numbers can swamp smaller connections visually. Remove empty rows and columns only after you have verified they hold no meaningful data, as dropping them shifts group indices. Finally, export the matrix in a format your tool recognizes, such as CSV with headers, and double-check that row and column labels match exactly before rendering.
Chord Diagram
Color serves as one of the most immediate tools for directing a reader’s eye within a chord diagram, and the strategic use of hue can transform a dense web of connections into a clear visual narrative. A practical starting point is to assign each source group its own distinct color, drawn from a palette with sufficient separation in lightness and saturation so that adjacent ribbons remain distinguishable even where they overlap. Once these base colors are fixed, the diagram becomes a system in which a viewer can trace any ribbon back to its origin purely through color, without needing to follow the curve with their finger.
From there, the analyst can shift emphasis by modulating intensity rather than introducing new hues. Dominant or critical connections can be rendered in fully saturated versions of their source color, while secondary links fade toward lighter tints or reduced opacity. This creates a visual hierarchy in which the eye lands first on the heaviest or most consequential flows and treats the remainder as supporting context. For instance, in a trade or migration diagram, the largest bilateral flows can be shown at full saturation while minor exchanges recede into pale background tones.
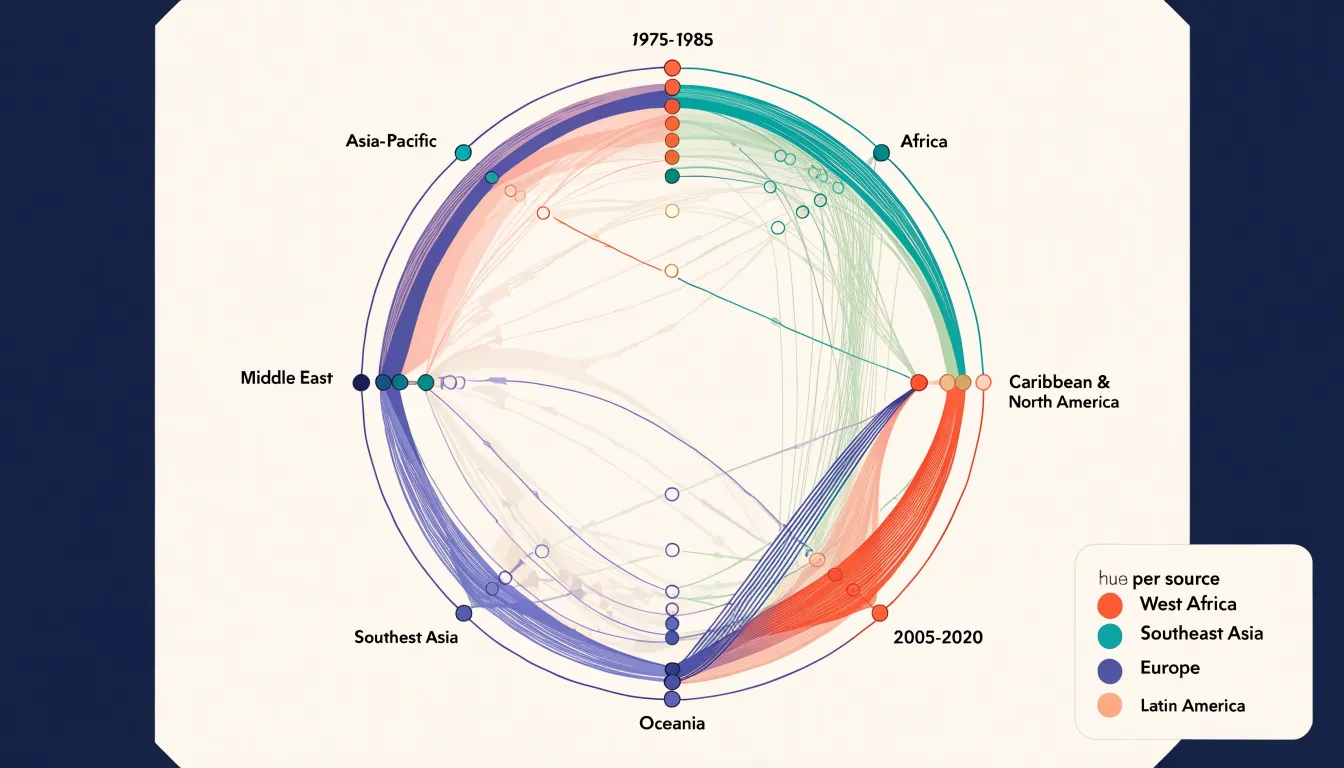
A complementary technique is to reserve one attention-grabbing color for relationships that carry particular importance, such as dependencies that cross otherwise separate clusters or links that signal risk. When most of the diagram is composed of muted or analogous colors, a single vivid accent will pull the viewer’s attention exactly where the author intends. Consistent legends, tooltips on hover, and careful testing for colorblind accessibility round out the approach.
Chord Diagram
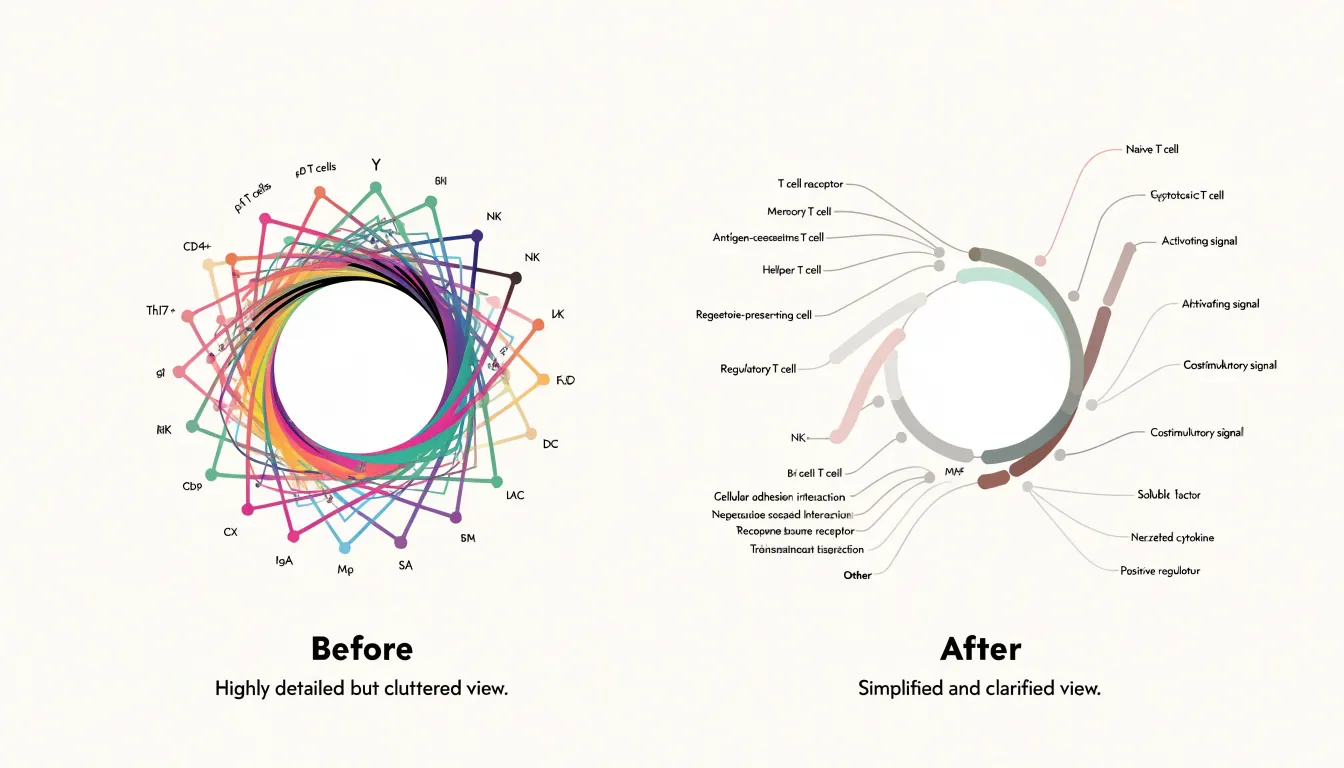
Dense chord diagrams can quickly become unreadable when hundreds of connections crisscross the circle, overlapping one another and obscuring the underlying patterns. One common technique for reducing visual clutter is filtering low-volume connections: by setting a threshold and removing links that fall below it, the diagram retains only the most significant relationships, allowing the viewer to focus on dominant flows without distraction from marginal ones. This approach works well when the goal is to highlight major patterns rather than provide an exhaustive account of every connection.
Grouping smaller nodes offers another route to clarity. When many entities each carry only a small share of the total volume, merging them into a single aggregated category, often labeled as ‘other,’ shrinks the number of chords and reduces the density of the circular layout. The remaining major nodes receive more space, and the visual hierarchy becomes easier to follow. This strategy preserves the overall balance of the data while simplifying the structure the viewer must parse.
Chord bundling addresses density in a different way, by routing related connections along shared paths so that they appear as thicker, unified bands rather than a multitude of individual strands. Bundling reduces the number of distinct crossing lines and makes the direction and magnitude of flows easier to trace, especially in hierarchical or network-style data where many links converge on the same endpoints. Designers typically combine filtering, aggregation, and bundling, tuning each to the specific structure of the data so that the diagram scales to larger datasets while remaining interpretable.
Chord Diagram
Adding hover behavior transforms a static chart into an exploratory instrument, which is especially helpful when many chords overlap in the center of the ring. When a viewer moves the pointer over a chord, the hover state can raise that chord’s opacity while dimming everything else, so the selected flow stands out against the tangle of connections. The same effect can highlight the two arc segments at either end of the chord, making it immediately clear which source and target the ribbon links together. Transitions applied to opacity and stroke width keep these changes smooth, allowing the eye to follow the connection rather than losing track of it during an abrupt redraw.
Tooltips complement the hover highlight by supplying the exact figures that the geometry only approximates. Ribbon thickness encodes a quantity, but estimating that quantity by eye is imprecise, especially for thin chords or for values that fall between gridline steps. A tooltip attached to the pointer can report the source category, the target category, and the precise flow value, along with any derived measures such as the percentage of the source’s total that the chord represents. Positioning the tooltip near the cursor while keeping it inside the chart bounds prevents it from obscuring the highlighted chord or drifting off-screen at the edges of the layout.
Together, the hover state and the tooltip create a layered reading experience: the highlight answers the question of which connection is being examined, and the tooltip answers the question of how large that connection is. This pairing lets viewers trace individual flows through a dense diagram without abandoning the overview, supporting precise comparison for both analysis and presentation.
Chord Diagram
The readability of a chord diagram depends heavily on the order in which segments are arranged around the ring. When connected entities sit far apart, their chords stretch across the center and cross many other chords, producing a dense tangle that obscures the structure of the data. When connected entities are placed near one another, their chords are short and stay close to the perimeter, so the overall picture becomes far easier to scan.
A useful first step is to sort segments by a meaningful quantitative measure, such as total flow volume, degree, or size of the entity. Placing the largest or most connected segments together groups the busiest relationships into one region of the circle and pushes quieter ones to the edges. Beyond simple sorting, an optimization approach can arrange segments to minimize total chord length or the number of crossings, often using a greedy heuristic or a traveling-salesman-style algorithm that treats pairwise connection strength as proximity. Fixed orderings also have value when segments belong to predefined categories, since grouping by category preserves interpretability. The goal is to balance statistical fidelity with visual clarity, and in practice a short trial of several orderings, compared side by side, reveals which arrangement produces the cleanest chord pattern for the specific dataset.
Chord Diagram
The width of each chord where it meets the outer ring is scaled through an angular span on the outer arc, with the chord’s two ends occupying arcs whose lengths correspond to the totals associated with each node. A chord linking two countries in a migration diagram, for example, grows wider at each end as the number of people moving between them increases, so a reader can compare flows at a glance without consulting a legend or a table of numbers. The same principle applies to monetary trade volume: the ordering of widths across the diagram mirrors the ranking of the underlying values.
This mapping from value to ribbon breadth is linear and continuous, so doubling a migration count or a trade sum doubles the visual thickness at the relevant endpoints. Because the width is anchored at the ring rather than at the middle of the chord, the eye can compare endpoints side by side, and node totals emerge from the combined widths of the chords attached to each segment of the ring.
Reading these widths accurately depends on consistent scaling across the whole diagram, so that every chord is measured against the same value-to-width ratio. When that ratio is held constant, the widest ribbons immediately identify the dominant relationships in the dataset and the narrowest reveal minor or marginal connections.
Chord Diagram
Chord diagrams excel at revealing the complex, bidirectional relationships inherent in global trade and social media ecosystems, where flows between entities are often reciprocal and multifaceted. In international trade, a diagram of global oil trade might show chords linking major exporters like Saudi Arabia, Russia, and the United States to importers such as China, India, and European countries. Grouping countries by region along the perimeter makes it easy to spot regional trade patterns, such as the dense web of intra-European trade or the heavy dependency of East Asian economies on Middle Eastern oil. With directional cues and interactive hover states to highlight a single country’s trade relationships, analysts can quickly grasp trade imbalances and dependencies.
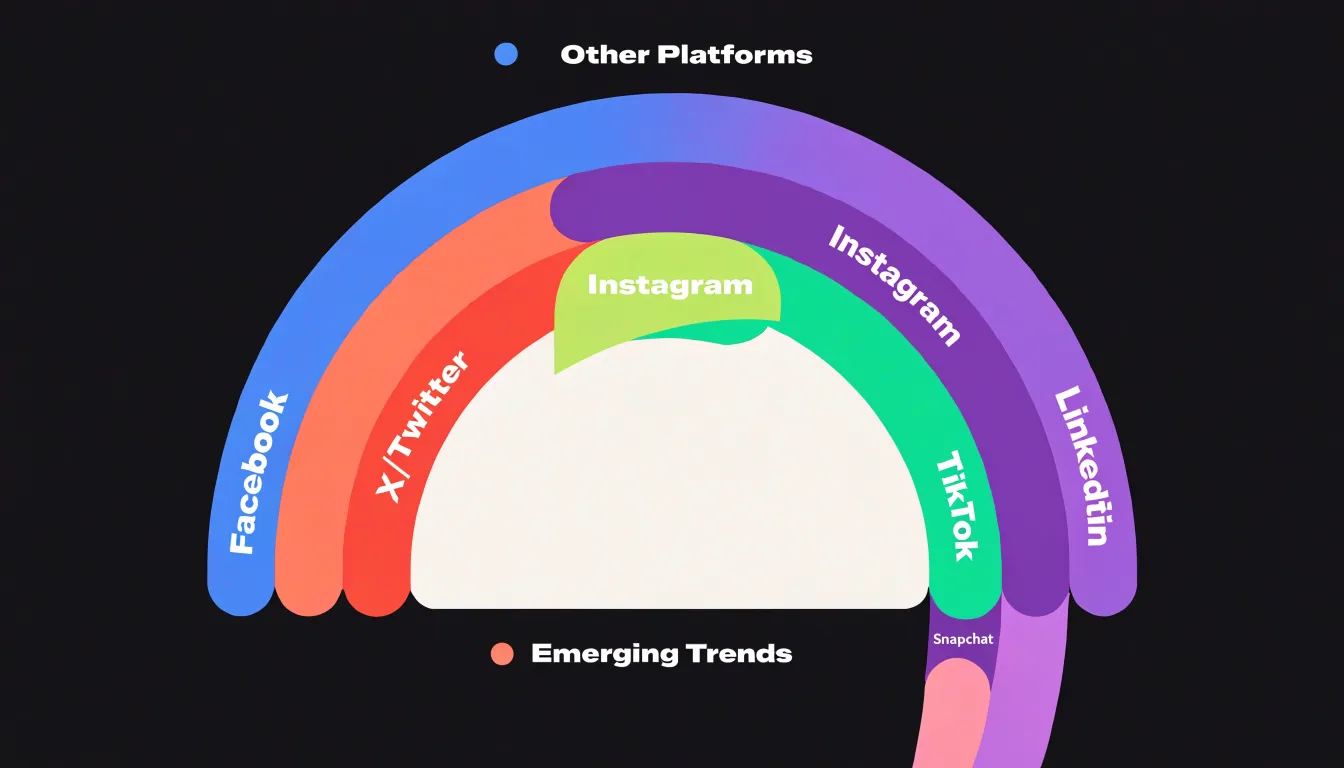
In the realm of social media, chord diagrams illuminate patterns of user migration and interaction across platforms. Consider a study of user movement between social networks: each platform (e.g., Facebook, Twitter, Instagram, TikTok) is an arc, and chords represent the number of users who are active on two platforms simultaneously or who have migrated from one to another over a given period. The width of the chord reveals which platforms share audiences or compete for attention. For instance, a thick chord between Instagram and TikTok might indicate a high overlap of young users, while a thinner chord between LinkedIn and Snapchat suggests distinct user bases. Beyond migration, chord diagrams can also depict interaction flows within a single platform, such as retweets or mentions between communities. By visualizing these flows, researchers can identify influential groups, echo chambers, or bridges between otherwise disconnected clusters.
Chord Diagram
Because chord diagrams carry a great deal of information in a single view, they are vulnerable to a handful of recurring design mistakes:
- The rainbow color scheme: Assigning a different hue to every group feels festive, but a dozen or more saturated colors quickly become indistinguishable, especially for viewers with color vision deficiencies. Adjacent arcs in a large palette blur together on screen and in print, so readers lose the ability to trace which group owns which segment. A restrained palette built from a few base colors with variations in lightness keeps the diagram readable while still separating major categories.
- Angled labels: Text placed on a chord diagram naturally wants to follow the arc of each segment, and once labels tilt beyond about forty-five degrees, reading becomes slow and effortful. Labels near the bottom of the circle often end up upside down or collide with neighboring text. Designers can rotate labels outward, shorten them to codes, or move long names into a companion legend, but leaving them angled and crowded defeats the purpose of labeling at all.
- Too many categories: Chord diagrams scale poorly; beyond roughly a dozen groups, arcs grow thin, flows overlap into spaghetti, and the eye has no anchor point. Audiences confronted with thirty interacting categories stop reading the structure and start guessing. Grouping minor categories into an “Other” band, filtering to the strongest relationships, or splitting the data across small multiples restores legibility.
Each of these mistakes shares a root cause: treating the diagram as a showcase for all available data rather than a tool for a specific audience. Pruning categories, calming the colors, and easing the labels turns a tangled wheel into an intelligible picture of relationships.
Chord Diagram
When building a chord diagram, the choice of tooling depends on your programming environment and the level of customization you need.
In the JavaScript ecosystem, D3.js is the most flexible option. Its d3-chord module provides the mathematical layout, computing the arcs and ribbons that represent relationships between categories. You then use D3’s data-binding and SVG generation to render the diagram. This approach requires more code, but it gives you complete control over every visual aspect, from arc thickness to ribbon color and interactivity. Plotly offers a higher-level alternative. Its JavaScript library includes a dedicated chord diagram trace type, so you can create an interactive chart with just a few lines of configuration. Plotly handles hover effects, zooming, and responsiveness out of the box, making it ideal for quick dashboards or when you need a polished result without deep customization.
For Python users, several packages simplify chord diagram creation:
- HoloViews: Built on the Bokeh plotting library, it provides a
Chordelement that integrates with the broader HoloViews ecosystem for interactive exploration. - Plotly’s Python API: Supports chord diagrams through the same trace type available in JavaScript, allowing you to generate web-ready charts directly from Python scripts or notebooks.
- chord: A lightweight library that uses matplotlib to produce static chord diagrams, though it lacks interactivity.
In R, the circlize package is a powerful and widely used tool for circular layouts, including chord diagrams. It offers extensive customization for genomic and other data, with functions to control sector colors, labels, and ribbon styles. For a more user-friendly interface, the chorddiag package wraps D3.js in an R interface, producing interactive HTML widgets that work seamlessly in R Markdown documents and Shiny applications.
Your choice will hinge on whether you prioritize ease of use, interactivity, or fine-grained control.
Chord Diagram
Accessibility and contrast considerations form an essential part of any chord diagram design, since these graphics rely heavily on color and visual density to convey relationships. Start by ensuring that every color used for chords and arcs achieves a high contrast ratio against its background and against neighboring elements. Strong contrast helps viewers with low vision, color vision deficiencies, or poor display conditions distinguish individual flows and labels without straining. Test candidate palettes against recognized contrast guidelines and adjust lightness or saturation until each pairing meets a reliable threshold.
Color alone rarely carries meaning safely, so pair hues with distinct pattern fills. Stripes, dots, crosshatching, or other textures let each chord remain identifiable even when two colors appear similar or when the diagram is printed in grayscale. Pattern fills also help when the chart is embedded at small sizes, where subtle hue differences collapse into indistinguishable tones. Choose patterns that stay legible at the stroke widths actually used, and confirm that the texture does not obscure the direction or thickness of the flow.
Beyond the visual layer, provide an accessible data table fallback that captures the same information encoded in the diagram. Screen readers cannot interpret the geometry of arcs and ribbons, so a structured table listing each source, target, and value gives non-visual users equivalent access to the relationships. Mark the table up with proper headers, keep the ordering logical, and connect it to the chart through a visible or programmatic link. Include concise alternative text that summarizes the diagram’s purpose and points to the detailed table. Together, contrast, pattern differentiation, and a table fallback make the chord diagram usable across a wide range of abilities and viewing contexts.
Chord Diagram
A chord diagram repays a structured build workflow, because each stage depends on the integrity of the one before it:
- Clean the raw relational data: Starting from a list of source-target pairs, remove duplicate records, resolve inconsistent labels for the same entity, strip whitespace and stray characters, and decide how to treat self-references or missing values. Document these decisions, since they will shape every later step.
- Establish entity ordering and build the matrix: Enumerate the full set of unique entities to establish a fixed ordering, then aggregate the pairs into a square matrix where cell values hold the summed magnitude. Validate the matrix by checking that its totals reconcile with the cleaned source data and that the diagonal is handled deliberately, either zeroed or displayed, depending on whether self-flows carry meaning.
- Compute spans and render: Calculate per-entity totals from the matrix to determine the angular span each outer arc receives, then draw the arcs and the connecting ribbons scaled to the matrix values. Apply your chosen grouping or ordering logic and color scheme.
- Polish and export: Tune label placement and rotation, add a legend and directional cues, adjust opacity so overlapping chords remain legible, and confirm the figure reads clearly at its intended size. Export at a resolution and format suited to its destination, keeping an editable copy of the source data and settings for future revisions.
Frequently Asked Questions
What is a chord diagram used for?
A chord diagram is a visual tool for displaying relationships between entities, often used to show flows, connections, or correlations. Nodes placed around a circle represent categories, and ribbons connecting them show relationships, with ribbon width proportional to the magnitude of the relationship.
How do you read a chord diagram?
To read a chord diagram, identify the nodes and their arc lengths, since longer arcs indicate larger totals. Then trace the ribbons: a thick band means a strong or large relationship, a thin band means a weaker or smaller one, and arrows or color gradients may show flow direction.
How can I show direction of flow in a chord diagram?
Use arrowheads, gradient fills, or offset chord origins with tapered width to show flow direction. Combining methods, such as a gradient for overall direction plus a modest taper or arrowhead at the terminus, often gives the clearest result, and directional conventions should stay consistent across all chords.
What data format do I need to make a chord diagram?
A chord diagram expects a square matrix where each row and column correspond to the same set of entities and each cell holds the relationship value. Many visualization tools also accept a relational edge list with source, target, and weight, which can be converted into a square matrix. Fill missing pairs with zeros and confirm each cell contains a single numeric value.
How do you make a dense chord diagram less cluttered?
To reduce clutter in a dense chord diagram, filter low-volume connections below a threshold, merge small nodes into an aggregated “other” category, or use chord bundling. You can also arrange segments so connected entities are near one another or sort them by a meaningful measure such as total flow volume.
How can I make a chord diagram accessible?
Make a chord diagram accessible by ensuring high contrast between chords, arcs, labels, and the background, and pair hues with distinct pattern fills because color alone rarely carries meaning safely. Also provide an accessible data table fallback and concise alternative text, since screen readers cannot interpret the geometry of arcs and ribbons.
Tony Astor
Tony writes about data visualization and the tools people use to build charts and dashboards. More about Data Illustrator