Chartjunk: What It Is and How to Avoid It
 By Tony Astor ·

Chartjunk
Chartjunk is any decorative element in a chart that doesn’t encode data—heavy borders, drop shadows, 3D effects, gradient fills, patterned bars, and redundant gridlines. It persists mainly because spreadsheet and presentation software adds these embellishments by default. Chartjunk consumes limited working memory, distorts perceived proportions, and slows comprehension, so removing it restores the chart’s core purpose: making trends legible at a glance.
Table of Contents
Chart Type
The chart type a designer selects often arrives pre-loaded with visual conventions that were never deliberately chosen for the data at hand. Spreadsheet and presentation software ships with default templates that prioritize decoration over communication: drop shadows, three-dimensional perspective, gradient fills, and textured backgrounds appear automatically the moment a user inserts a column or pie chart. These defaults emerged when desktop publishing was new and software vendors competed to demonstrate graphical sophistication. A chart that looked polished and dimensional signaled that the tool was powerful, and users rarely questioned the embellishments because they appeared to be part of what a professional chart should look like.
Aesthetic over-design compounded the problem. Designers working in print traditions carried ornamental habits into digital visualization, treating charts as illustrations rather than instruments for reading data. Three-dimensional bars, for instance, require viewers to judge depth and perspective to compare values, a perceptual task far harder than reading a flat length. Decorative gridlines, heavy borders, and patterned fills add visual noise that competes with the data marks for attention. When a chart is dressed in these details, the reader’s eye must work to separate signal from ornament, increasing the effort of decoding the display while decreasing the clarity of the underlying trend.
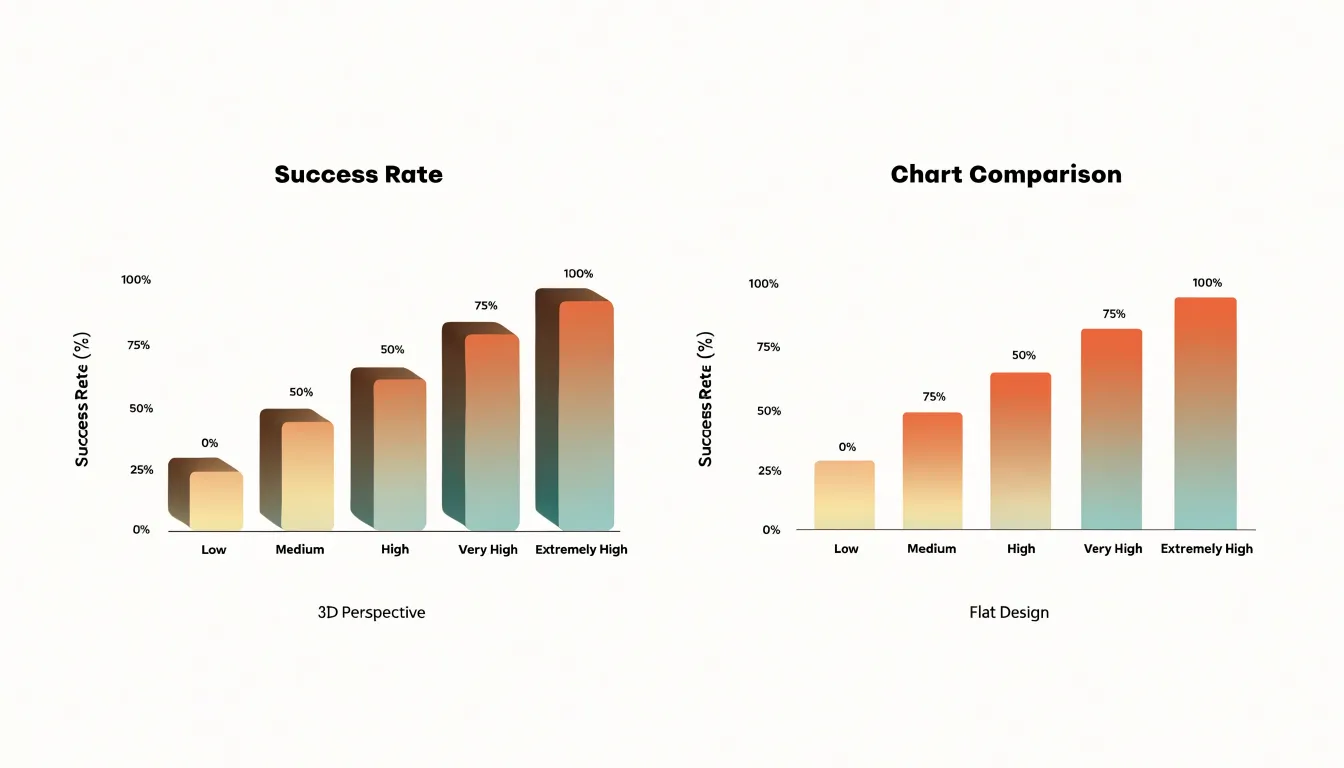
The historical origin matters because it explains why clutter persists despite widespread awareness of its costs. These visual elements are baked into the tools people use daily, carrying an implicit authority that discourages removal. Recognizing that superfluous detail entered charts through software convenience and stylistic fashion—rather than through evidence about how people read graphs—gives designers license to strip charts back to their essentials. Choosing a chart type based on what the data needs to show, and then removing default embellishments that obscure it, restores the chart to its core purpose: making trends legible at a glance.
Chart Type
Chartjunk often announces itself through easily recognizable visual indicators:
- Heavy borders: A thick frame around a plot area adds visual weight without carrying information. When rendered in a dark tone or doubled with an inner rule, it competes with the data for attention.
- Decorative shading: Gradients, drop shadows, and textured backgrounds introduce tonal variation that the eye must filter out before it can compare bars or trace a trend line, making the graphic feel dense and effortful to read.
- Gratuitous patterns: Filling bars with hatching, crosshatching, or repeating motifs creates high-frequency visual noise that interferes with judging length and area. A striped fill can make two bars of nearly equal height appear different simply because the eye catches on the pattern rather than the endpoint. The same applies to icons placed inside plotted shapes.
The practical lesson is to scan any chart for elements that do not encode a variable. Removing purely decorative borders, shading, and patterns sharpens the contrast between data and background, allowing statistical insights to emerge with less interpretive effort.
Chart Type
Cognitive load theory explains why chart decoration carries real costs for readers. The theory holds that working memory is limited, and comprehension suffers when a task demands more mental resources than are available. In a data visualization, the reader must hold several things in mind at once: the question they are asking, the values encoded in the marks, the mapping between those marks and the axes, and the comparisons the chart invites.
Every element on the page competes for a share of that finite capacity. Ornamental flourishes add visual information that the reader must process without gaining any data. The mind cannot simply ignore these elements; it must first recognize them, decide they are irrelevant, and set them aside. That filtering work consumes working memory that would otherwise go toward reading the actual numbers.
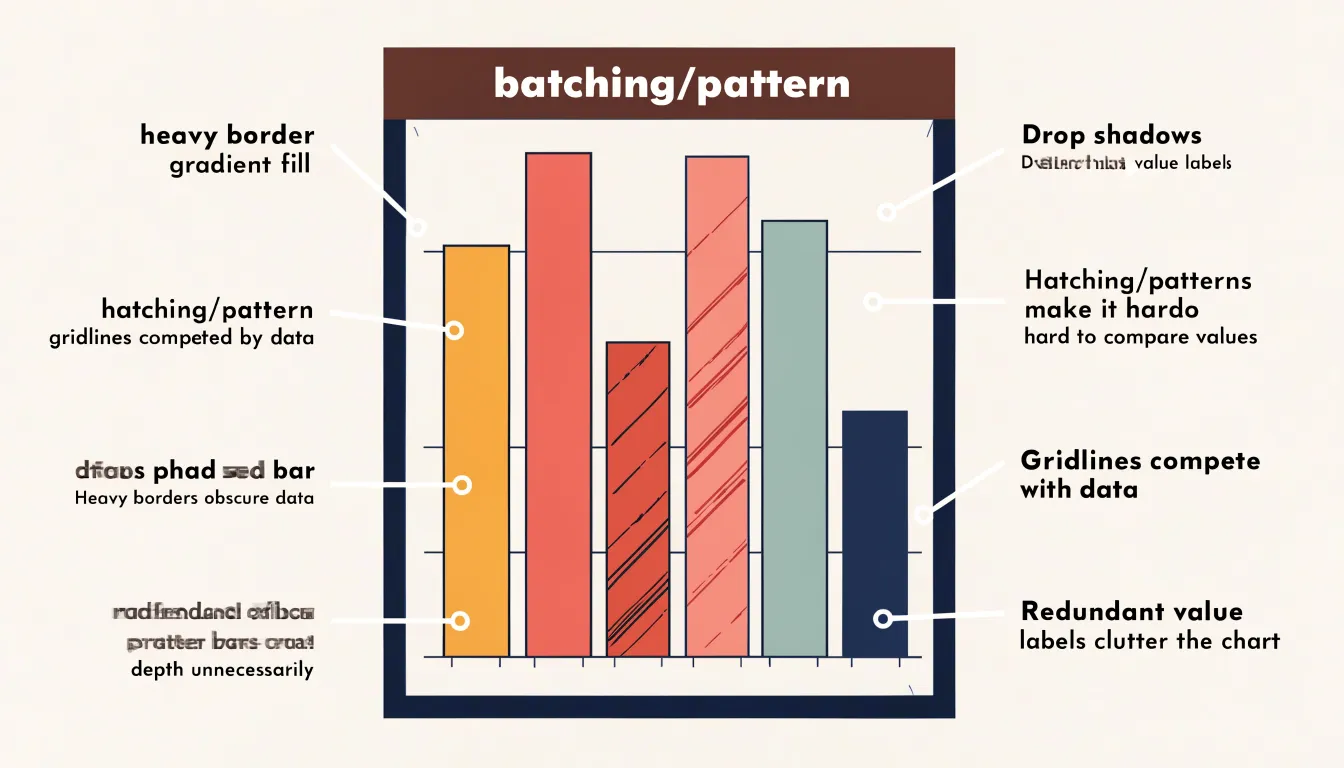
The consequences extend beyond mere slowness; when decoration distorts geometry, comprehension breaks down. Decorative gridlines darker than the data pull attention away from the series, causing readers to anchor on the grid rather than the trend. Patterns and textures inside bars create false visual groupings, leading viewers to perceive clusters that do not exist in the data. Because the reader’s limited cognitive resources are spent parsing the display rather than performing the analytical task, the chart becomes slower to interpret and more prone to produce mistaken conclusions. Clean design is therefore a matter of cognitive efficiency as much as aesthetics.
Chart Type
Grid lines help viewers trace a data point back to the value on an axis, yet when drawn with the same visual weight as the data, they create a dense, cluttered background. The practical fix is to treat grid lines as secondary furniture and lower their visual salience:
- Reduce opacity and lighten color: Lower opacity to between 10 and 30 percent so lines remain perceptible on close inspection while receding at a glance. Lighten the color toward a pale gray rather than solid black to soften the background without structural changes.
- Decrease line weight: Thick grid lines read as strongly as plotted series. Thinning them to a hairline or half-point stroke shifts the hierarchy in favor of the data. Dashed or dotted lines can further distinguish the background from solid data strokes, though this should be applied sparingly to avoid introducing a second texture.
- Reduce intervals: Rounding to fewer, well-chosen intervals reduces visual noise while still guiding the eye.
- Remove unnecessary lines: For simple bar or line charts with clearly labeled axes and direct data labels, dropping the grid entirely leaves the trend to speak for itself. A common compromise is keeping only horizontal grid lines and removing vertical ones, since most comparisons are made against the value axis rather than the category axis.
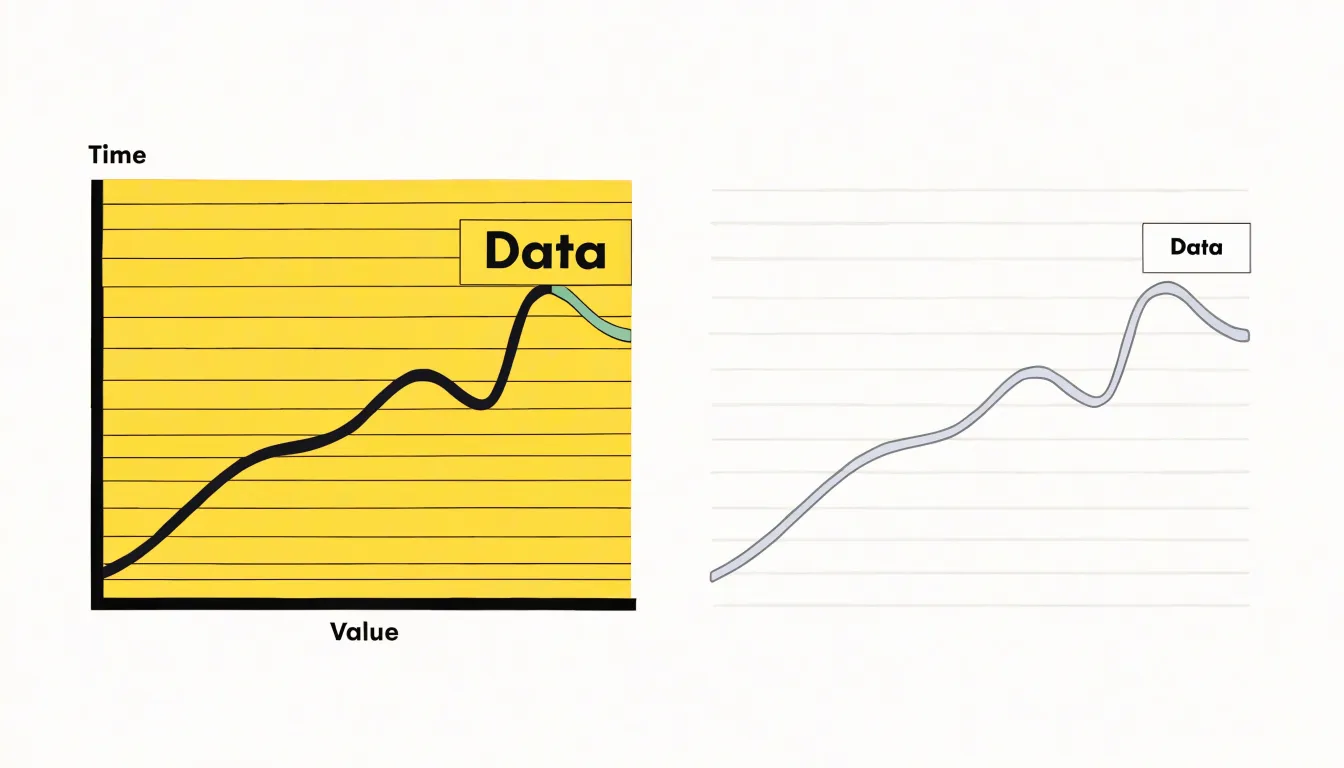
Chart Type
Three-dimensional effects introduce geometric distortions that undermine the accuracy of visual proportion perception. When a chart is rendered with perspective, depth cues, and shading, data marks are transformed in ways that no longer correspond directly to their underlying values.
A bar drawn as a 3D block gains a visible top and side face; those extra surfaces compete for attention while shrinking the apparent size of the front face. Two bars representing different quantities can appear closer in magnitude than they actually are, or a smaller value can seem larger depending on where it sits in the implied depth field. Perspective projection compounds this by scaling objects according to their position along the depth axis, so identical values placed at different points render at different sizes. Shading and gradient fills add further ambiguity, since darker or lighter regions suggest volume rather than quantity and lead the eye to judge magnitude from surface area instead of height or length.
Pie charts extruded into three dimensions are especially vulnerable. The tilt compresses the far segments and expands the near ones, distorting the very angles and apparent areas that encode the data. Even the choice of viewing angle introduces subjectivity, as the same dataset produces different apparent proportions depending on the assumed camera position.
Flat, two-dimensional rendering avoids these issues entirely. With no depth axis, perspective scaling, or decorative volume, each mark maps directly and consistently to its value. Length, height, angle, and position remain faithful to the data across the entire chart area, allowing viewers to compare proportions accurately without perceptual corrections.
Chart Type
Color is one of the easiest design decisions to get wrong. A rainbow palette applied across every category scatters attention across the plot, leaving the viewer with no path through the data. When every bar or line shouts in a different hue, the eye jumps between them and the central message dissolves. A deliberate approach begins by asking which elements carry the story and which simply provide context.
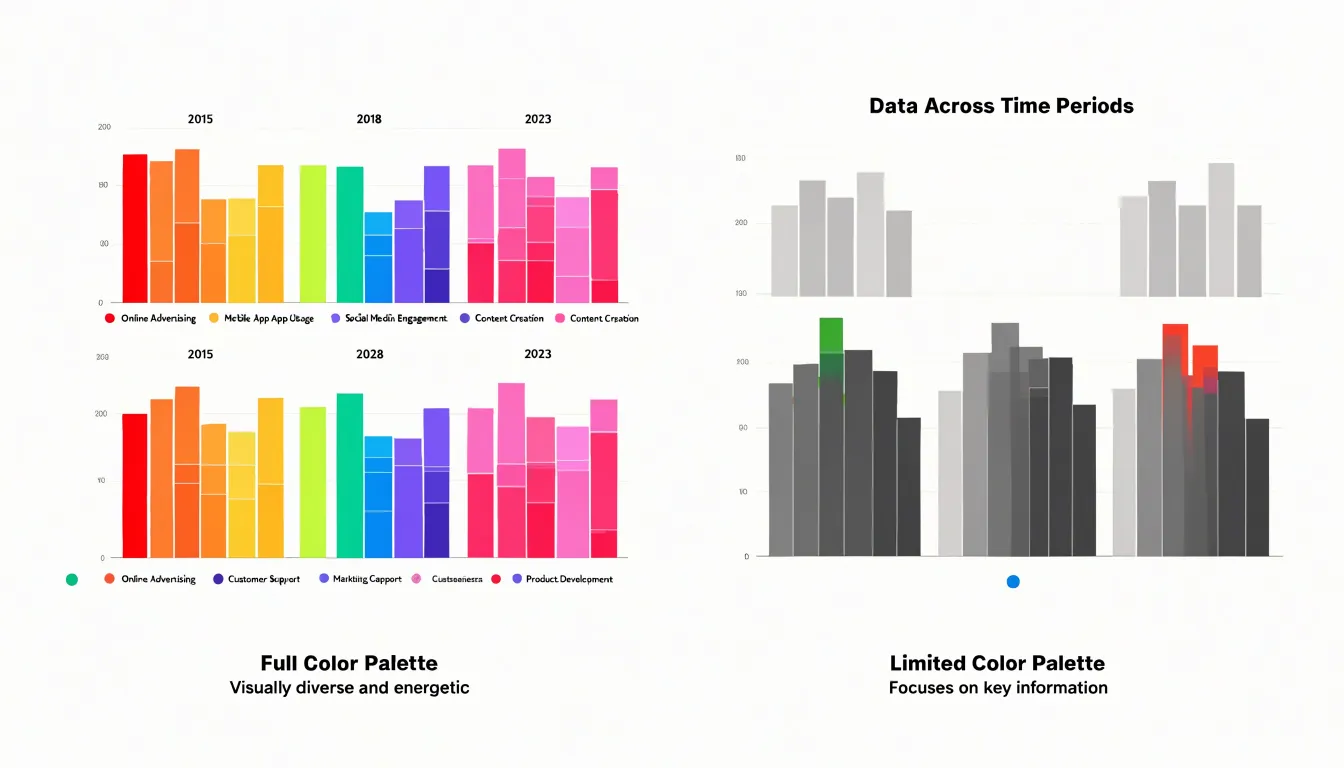
A functional palette typically starts with a neutral base—greys and muted tones that recede into the background and let structure emerge without competition. From there, one or two accent colors are reserved for the data points that matter most, such as the peak month, the outlier region, or the central trend. Because the accent is scarce, its presence signals significance and draws the eye immediately.
Sequential and diverging schemes are useful when data moves along a scale or crosses a meaningful midpoint, since ordered hues communicate magnitude and direction more honestly than arbitrary category colors. Consistency across a series of charts also matters: the same color should mean the same thing throughout a publication, allowing readers to carry understanding from one figure to the next. Restraint in saturation and brightness further keeps the chart legible on screens and in print, including for colorblind audiences who may struggle to separate similar hues. Deliberate color selection is ultimately an editorial act, asking the designer to decide what deserves emphasis and let everything else stay quiet.
Chart Type
Redundant data labels often creep in when a chart is assembled piece by piece rather than designed as a whole. A classic example is a bar chart with a printed value above every bar while a full numeric axis runs along the side, stating each quantity twice. To eliminate this double-labeling, decide which encoding carries the data and commit to one. When a scaled axis is present, value labels above the bars can usually go. When direct labels remain, axis ticks can often be thinned or dropped entirely, leaving a clean baseline.
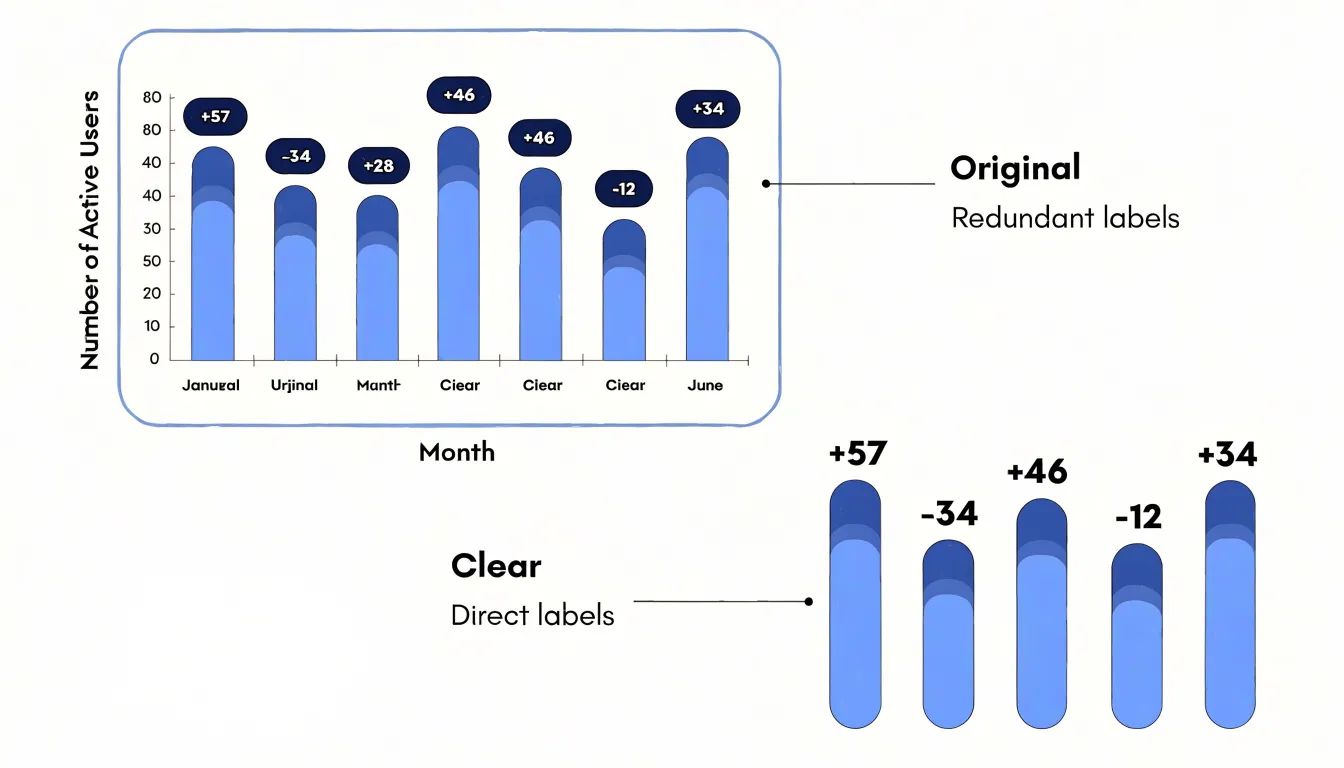
A similar redundancy appears when visual markers repeat what position already communicates. In a scatter plot, labeling every point with its coordinates duplicates the axes. Line charts that print the final value at the end of a line, next to an axis that already shows that value, create the same overlap. Keep only the single most useful label that readers can scan fastest.
Streamlining text also means pruning labels that restate categories, repeating units in every label, or spelling out values that a legend already defines. Move units to the axis title once, use consistent short forms, and let shared context do the work. Every removed label reduces decoding time and returns attention to the pattern, ensuring each piece of text earns its place by conveying something the visual encoding does not.
Chart Type
Selecting readable typography begins with choosing a typeface that holds up under the specific demands of a chart. Sans-serif families with generous x-heights, open letterforms, and clearly differentiated numerals work best because chart labels are read quickly and at small sizes, where subtle serifs and narrow apertures collapse into visual noise. Limit the chart to one or two families: a single family used across several weights and sizes usually produces a cleaner hierarchy than mixing faces, keeping attention on the data rather than the lettering.
Size establishes that hierarchy. Titles should sit noticeably above axis labels, which in turn sit above tick marks and source notes. A workable progression is roughly:
- Title: 14 to 18 points
- Axis labels and legends: 10 to 12 points
- Annotations: 8 to 9 points
Nothing should fall below the threshold of legibility when viewed on a phone or printed at reduced scale. Designers should test sizes at the smallest expected display width and adjust upward rather than relying on desktop rendering.
Orientation deserves equal care. Horizontal labels are always the default; rotate text only when space genuinely forces it, and prefer a 45-degree angle over vertical stacking, which slows reading considerably. When axis labels run long, abbreviate, wrap onto two lines, or move the label into the chart area instead of tilting it. Consistent alignment, adequate leading, restrained use of uppercase and italics, and deliberate contrast between label color and background guard legibility across projectors, print, and dark-mode formats.
Chart Type
The symbols used within a chart carry substantial weight in determining whether a graphic communicates clearly or collapses under its own decoration. Pictograms can earn their place when they map directly onto the data being presented: a chart showing the number of hospital beds may reasonably use a bed symbol, and a graphic tracking rainfall may use a cloud or droplet. In these cases, the symbol reinforces the message, aids recall, and helps readers grasp the unit of measurement without consulting a legend, acting as a shorthand that reduces cognitive load.
Chart Type
To measure and optimize the efficiency of a chart, follow this sequence to calculate the data-ink ratio:
- Define the components: Separate the ink that encodes data values from the ink that serves only structure. Data ink includes every mark whose position, length, area, or color carries information (bars, lines, plotted points, shaded data regions). Structural ink includes axes, gridlines, borders, tick marks, background fills, and frame lines.
- Estimate the area: For a bar chart, measure the total plotted area and subtract the portion covered by bars; the remainder, together with surrounding scaffolding, approximates structural ink. A simple pixel count or area estimate is enough for practical comparisons.
- Calculate the initial ratio: Divide data ink by total ink to obtain the data-ink ratio. A ratio near one indicates a dense, efficient display; a ratio near zero signals a chart dominated by decoration.
- Remove non-information elements: Strip out redundant gridlines, heavy borders, and decorative fills.
- Lighten remaining structure: Use thin lines and muted grays so structural elements recede.
- Streamline labels and axes: Replace labeled tick marks with direct labels on data points where space allows. Consolidate axes and eliminate duplicate scales.
- Optimize data ink: Check whether any data ink can be rendered more efficiently, such as using position rather than area, or condensing a sparse scatter into the same space with adjusted point size.
- Recalculate and test: Calculate the new ratio after each change so improvements are measured rather than assumed. Finally, test legibility with a reader unfamiliar with the data, since aggressive reduction can strip useful context.
Chart Type
Bar charts carry a reputation for simplicity, yet they are among the most frequently cluttered graphics in everyday reporting. Because the visual weight of a bar chart comes from the bars themselves, thinning or removing heavy plot frames, dark axis lines, and bold gridlines lets the bars stand forward as the primary signal.
Spacing is another lever for clarity. Bars that sit shoulder to shoulder create a dense block that is hard to parse, particularly across many categories. Widening the gaps between bars—and between groups of bars in a clustered chart—gives each category room to breathe and makes individual comparisons easier. A general rule of thumb is to let the gap approach the width of the bar itself, adjusting as the number of categories demands.
Direct labeling is especially effective in bar charts. Placing values at the end of each bar removes the need for the reader to trace a line across to a distant y-axis, often allowing you to drop the value axis and its ticks altogether. Category names can likewise be placed beside the bars rather than beneath a separate axis, cutting down on eye travel so the chart reads in a single pass: the label, the bar, the number.
Chart Type
Line charts carry dense information, which is precisely where clutter accumulates. To streamline a multi-series line chart, decide which series deserves attention and let the remaining series recede by rendering secondary lines in a muted gray or a lighter tint of the primary color, at a slightly thinner weight. Their data stays visible and comparable, yet the eye is guided toward the principal trend without a legend demanding that the viewer parse five competing colors at once.
Point markers are another common source of noise. When a line chart contains dozens of data points, drawing a filled circle at each one turns the plot into a field of dots that competes with the trajectory itself. Removing markers from dense series—or reserving them only for the final data point or sparse data where actual observations matter—keeps attention on the shape of the change over time.
Finally, rethink the legend. A separate legend forces the reader to look away from the data, decode a color, and look back. Placing the series label directly at the end of each track, aligned with the line it describes, eliminates that round trip. Where lines run close together, direct labeling at several points along the track keeps identification effortless without reintroducing a legend.
Chart Type
Pie charts are a staple of business presentations, yet they often suffer from specific forms of clutter that obscure the data:
- Too many slices: When a pie chart contains more than five or six categories, smaller slices become difficult to distinguish and compare. Group minor categories into an “Other” slice to reduce the count to a manageable number, allowing viewers to focus on the most significant portions.
- 3D and exploded effects: In addition to the geometric distortions of 3D perspective, exploded slices—while drawing attention to a specific category—distort the overall shape of the pie and make angle and area comparisons harder. Removing these effects results in a cleaner, more accurate chart.
When a pie chart remains complex even after these adjustments, convert it to a bar chart. Bar charts excel at facilitating comparison across categories, especially when there are many items or when differences between slices are small. The linear scale makes it easier to judge relative sizes accurately; for example, a pie chart with ten slices can be transformed into a horizontal bar chart sorted by value, providing a clear ranking.
Chart Type
Scatter plots pack a great deal of information into a small space, making density both their strength and their weakness. When many observations cluster in the same region, points overlap into a solid mass and the underlying distribution becomes unreadable. A practical remedy is to lower the opacity of individual points so overlapping markers accumulate into darker regions. A single point remains faint and unobtrusive, while a crowded cluster deepens naturally to reveal where observations concentrate. Combined with a small point size, transparency keeps modest samples legible while allowing large samples to breathe.
While faint reference lines, plotting frames, and tick marks should sit quietly in light gray behind the data to help readers trace values across the axes, decorations around trend lines require special restraint. Confidence bands rendered in saturated colors, drop shadows, elaborate arrow annotations, and ornamental markers around fitted curves draw the eye away from the underlying observations. A simple fitted line, if warranted at all, should be presented in a muted tone that clarifies the overall pattern without overpowering the points it summarizes.
Chart Type
Strategic negative space functions as an active compositional tool within chart design:
- Creating boundaries: Leaving deliberate gaps between the title, axis labels, plot area, and legend helps the reader parse each component without confusion. Whitespace separates the header from the plotting region so the eye knows where the visualization begins, and it isolates the legend from the marks so the key reads as reference material rather than competing with the data.
- Guiding focus: When key data points or annotations sit within open, uncrowded regions, the surrounding emptiness frames them and draws attention naturally. Controlling the rhythm of open and filled space establishes a visual hierarchy: the plot occupies the center, margins hold supporting information, and breathing room between gridlines or tick marks keeps data legible.
- Establishing balance: Generous margins around the chart frame give the graphic stability and prevent it from feeling crammed against surrounding page content. Consistent spacing between series, categories, or bars produces an orderly appearance that supports comparison, whereas uneven or absent negative space makes a chart feel tense and hurried.
Frequently Asked Questions
What are common signs of chartjunk in a chart?
Common signs include heavy borders, decorative shading such as gradients, drop shadows, and textured backgrounds, and gratuitous patterns such as hatching or crosshatching. The article recommends scanning any chart for elements that do not encode a variable.
Why does chart decoration make data harder to understand?
Ornamental flourishes add visual information that the reader must process without gaining any data, which consumes limited working memory. When decoration distorts geometry, comprehension can break down and readers may reach mistaken conclusions.
How should gridlines be styled in a chart?
The article suggests lowering gridline opacity to between 10 and 30 percent, lightening the color toward pale gray, decreasing line weight, and reducing intervals. It also suggests removing unnecessary lines, with a common compromise being to keep only horizontal grid lines and remove vertical ones.
Are 3D charts accurate for comparing values?
The article states that three-dimensional effects introduce geometric distortions that undermine accurate visual proportion perception. Flat, two-dimensional rendering avoids these issues because each mark maps directly and consistently to its value.
How can color be used more effectively in charts?
Start with a neutral base of greys and muted tones, then reserve one or two accent colors for the data points that matter most. Sequential and diverging schemes can help when data moves along a scale or crosses a meaningful midpoint, and restraint in saturation and brightness keeps charts legible, including for colorblind audiences.
When should I remove data labels from a chart?
Remove labels when they duplicate another encoding, such as printing a value above every bar while a full numeric axis already shows each quantity. The article advises deciding which encoding carries the data and committing to one; when a scaled axis is present, value labels above the bars can usually go.
Tony Astor
Tony writes about data visualization and the tools people use to build charts and dashboards. More about Data Illustrator