Chart vs Table: When to Show Data Visually
 By Tony Astor ·

Chart vs Table
Tables suit exact-value lookup and comparison, while charts reveal trends, patterns, and relationships at a glance. Choose tables when readers need precise figures or many variables; choose charts for trends, rankings, and category comparisons. Matching format to intent, audience, and data type prevents distortion and misreading.
Table of Contents
Tables
Tables excel when readers need exact values rather than general impressions. Structuring rows and columns begins with identifying the unit of analysis: each row should represent one distinct entity, such as a product, a region, or a time period, while each column holds a single variable measured across those entities. This grid discipline lets readers scan down a column to compare values of the same measure and across a row to assemble the full profile of one item.
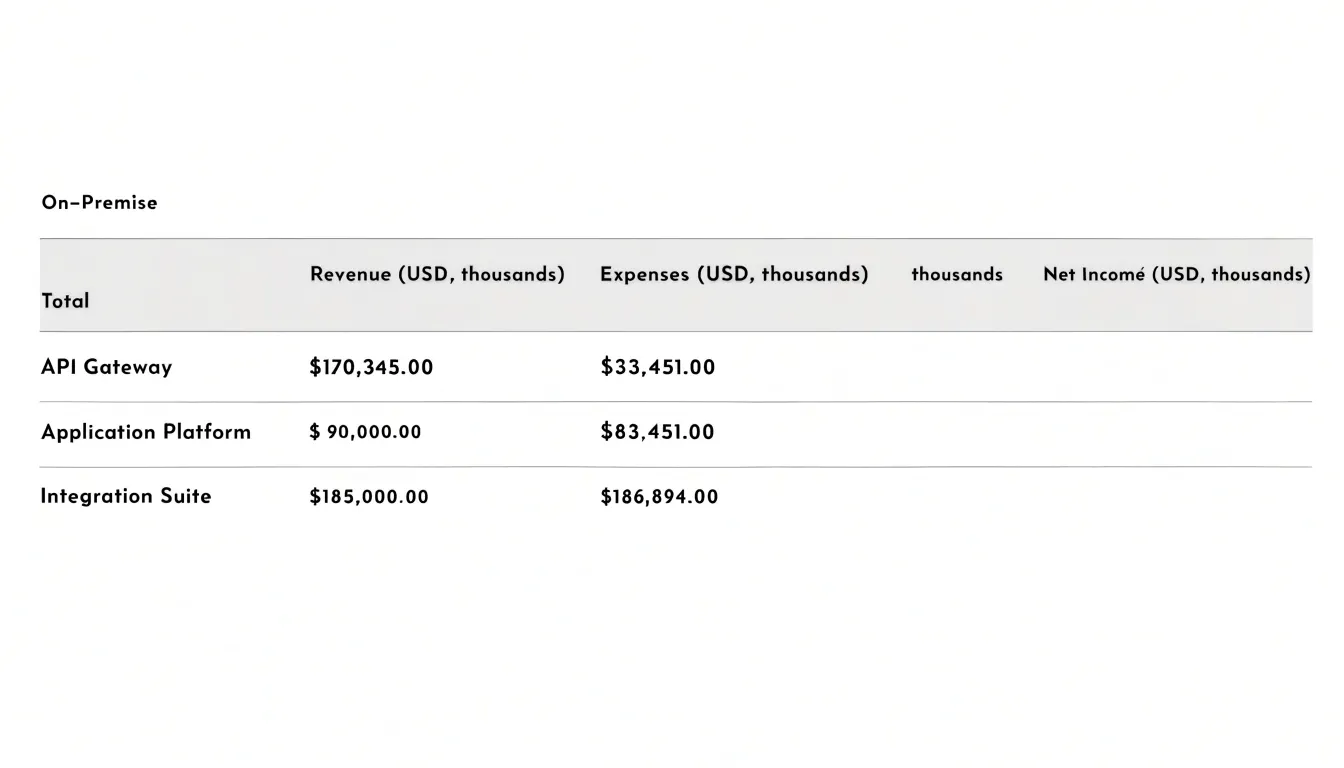
Column order matters. Place the identifying field first, then group related measures together, and move derived or secondary figures toward the right so the eye encounters primary data before computed values. Align numeric columns on the decimal point, keep a consistent number of decimal places, and use right alignment for figures so digit lengths can be compared at a glance. Clear headers, often with units stated directly in the column label, remove ambiguity and spare readers from hunting through footnotes.
When the table grows long, repeating the header on each printed page or freezing it on screen preserves orientation. Sorting rows by a meaningful value, such as descending revenue or chronological date, supports lookup and reveals ranking without extra explanation. Highlighting a key row or subtotal sparingly can guide attention while leaving the underlying precision intact. For audiences who will copy figures into reports, quote individual values, or audit specific records, this structure turns the table into a reliable reference tool for exact comparison and retrieval.
Line Charts
Line charts excel at showing how a value changes across a continuous span, most often time. The horizontal axis usually carries the continuous variable—dates, months, or years—and the vertical axis carries the measured value. Because the eye follows the connected points as a path, a line chart lets readers perceive direction, momentum, and turning points in a single glance. This makes it a strong choice for historical patterns such as monthly revenue, temperature readings, or website traffic, where the focus is the shape of the movement rather than any single figure. Rate changes also read naturally: a steep segment signals rapid change, a flat segment signals stability, and a crossing of lines signals a shift in relative position.
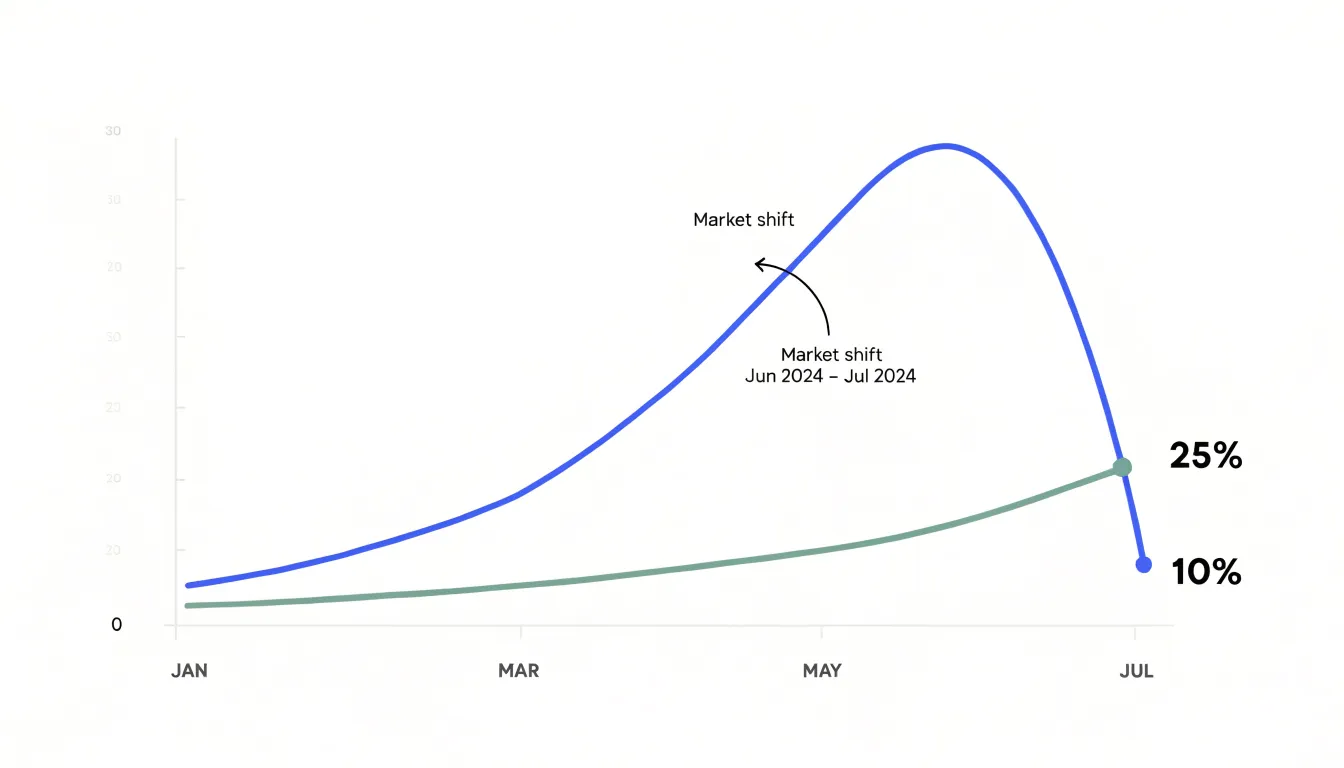
To keep the chart legible, limit the number of series. Two to four lines can usually be distinguished by color and a clear legend, while a dozen lines turn the plotting area into a tangle. Label axes directly where possible instead of forcing readers to decode a legend, and keep tick marks sparse and evenly spaced. Start the vertical axis at zero when the values are counts or amounts, since a truncated axis exaggerates small differences and can mislead. When the data represents a rate or an index, a non-zero baseline may be acceptable, provided the axis is clearly labeled.
Gridlines should be faint, and data points should be marked only when readers need to locate exact values. Annotate important events or anomalies directly on the chart so the trend has context. Ordering the horizontal axis chronologically and placing the most important series on top preserves the chart’s readability and keeps the focus on the pattern the data reveals.
Bar Charts
Bar charts are a workhorse when the central question is how several discrete categories stack up against one another. Each bar represents a single category, and its length or height encodes a value, so a reader can immediately see which categories are large, which are small, and how wide the gaps between them are.
Orientation matters:
- Vertical bars (column charts): Work well when categories are few and labels are short, since the eye naturally reads height as magnitude.
- Horizontal bars: Excel when category names are long or numerous, because the labels sit comfortably along the left edge instead of crowding beneath the axis or tilting at awkward angles.
Starting the value axis at zero is essential, because bar length is the entire visual argument and a truncated axis distorts the comparison. Once that baseline is fixed, ordering the bars by value rather than alphabetically or by some arbitrary sequence lets the ranking emerge at a glance.
Grouped bars extend the idea to subcategories, placing bars side by side within each category so that totals and internal splits appear together. Stacked bars show how parts combine into a whole, though readers compare segments less precisely than they compare full bars. Effective bar charts keep the number of categories manageable, use consistent color to signal grouping, label values directly where precision helps, and strip away gridlines and decoration that compete with the bars themselves.
Pie Charts
Pie charts display how individual categories contribute to a total. Each slice’s angle is proportional to its share, so viewers can quickly grasp the relative size of each part. They work best when the data represents a genuine whole—such as a budget breakdown or market share—and when the number of categories is small, typically no more than five or six. With too many slices, the chart becomes cluttered and differences become hard to judge. Grouping minor categories into an “Other” slice keeps the chart focused on the most significant components.
However, pie charts are prone to misinterpretation. People often struggle to compare angles and areas accurately, especially when slices are similar in size, which can lead to overestimating or underestimating differences. To mitigate this, label each slice with its percentage or value, and order slices from largest to smallest, starting at the 12 o’clock position and moving clockwise. This creates a predictable pattern that aids comparison.
Avoid 3D or exploded pie charts, which distort proportions and make accurate reading harder; stick to simple 2D charts with clear labels. Also, be cautious when using pie charts to show changes over time, as they are snapshots of a single moment. For trends, a line or bar chart is more effective.
Radar Charts
Radar charts, sometimes called spider charts or polar plots, display multivariate data across a set of shared radial axes that originate from a common center point. Each axis represents one attribute or variable, and values are plotted along these spokes at a distance proportional to their magnitude. The plotted points on adjacent axes connect with lines to form a closed polygon, giving each subject a distinctive shape that conveys its performance profile at a glance.
This construction makes radar charts especially useful when several subjects need to be compared across the same collection of attributes, such as evaluating employees on communication, technical skill, leadership, and collaboration, or comparing products on speed, cost, reliability, and ease of use.
Grids and Matrices
Grids and matrices offer a structured way to present multidimensional datasets so that users can compare intersecting criteria with minimal effort. When a dataset involves several dimensions—such as product category, region, time period, and a performance metric—a simple list of values quickly becomes unreadable. Organizing the information into a grid places one dimension along the rows and another along the columns, with each cell holding the value produced by the intersection of those two criteria. This layout lets a reader scan horizontally to compare across one dimension and vertically to compare across another without losing their place.
Matrices extend the same principle to datasets with more dimensions, often by nesting categories within rows or columns, or by using color intensity and small annotations inside each cell to encode additional variables. Cross-tabulated data benefits directly from this structure because the table form mirrors the analytical question being asked: how do these two criteria interact?
A well-constructed grid keeps headers aligned, groups related categories together, and uses consistent units throughout, so that outliers, clusters, or abrupt shifts become visible at a glance. Designers should also consider how readers will trace a single row or column across the grid, using subtle shading or hover states to maintain visual continuity. When the number of dimensions grows beyond what rows and columns can carry, small multiples or sparklines embedded within cells can preserve readability while supporting the evaluation of intersecting criteria.
Lookup Tables
Lookup tables hold the exact values readers consult when they need a precise figure rather than a visual trend. Every lookup table should be structured so a reader scanning for one specific detail can locate it in seconds. Following the column architecture principles established earlier, keep the total column count modest so rows remain readable without horizontal scrolling.
Clear column headers carry much of the retrieval burden. State the unit of measurement explicitly, such as “Revenue (USD, thousands)” or “Response Time (ms)”, so readers never have to infer scale from the values themselves. Consistent capitalization, aligned header text, and a shaded header row help the eye separate labels from data. Where abbreviations are unavoidable, add a short legend or footnote beneath the table.
Sorting mechanisms complete the retrieval workflow. Default sort order should match the reader’s most likely question, often alphabetical for name-based lookups or descending for ranked values. When the format allows, interactive sorting on header clicks lets readers reorder rows by any column, while static tables benefit from logical grouping and clear row banding that keeps the eye on track across wide rows. Zebra striping, adequate row height, and consistent number formatting all reduce scanning errors.
Highlighted Summaries
Highlighted summaries give readers a fast entry point into a dataset by surfacing the handful of numbers that matter most. Callout cards work well for this purpose: a compact block with a large figure, a short label, and a colored accent can communicate a headline result at a glance. A card might show total revenue, the percentage of users who completed onboarding, or the single region that outperformed every other. Because each card isolates one metric, readers absorb the information without scanning rows of supporting detail. KPI blocks extend this idea by grouping a small set of related indicators into a consistent grid, so a dashboard can display current performance alongside targets and trend direction. When every block follows the same layout, comparison across metrics feels effortless.
Conditional formatting adds another layer of guidance by changing the appearance of a value based on rules. Cells that exceed a benchmark can receive a green background, values that fall below a threshold can turn red, and data bars or icon sets can show relative magnitude inside the cell itself. A sales table, for instance, might shade the top three representatives in a strong accent color while flagging anyone under quota in a warning tone. The same rules can highlight a benchmark line, such as a target margin, so readers see instantly which rows sit above or below it.
Used together, these devices create a layered reading experience: the card or KPI block captures attention, and the formatted table provides the supporting evidence. The approach works best when the rules stay simple and the highlighted set stays small, so visual emphasis retains its meaning.
Hybrid Reports
Hybrid reports place tables and charts side by side in a single document, so each format covers what the other handles less well. In practice, a hybrid layout usually leads with a visual summary—such as a trend line, a stacked bar, or a small set of KPIs—and follows with a detailed table holding the full figures behind that visual. Executives and time-pressed readers can scan the chart first to grasp the headline movement in seconds. Analysts, auditors, and detail-oriented readers can move to the table beneath it to verify exact values, check totals, and trace how each number was derived.
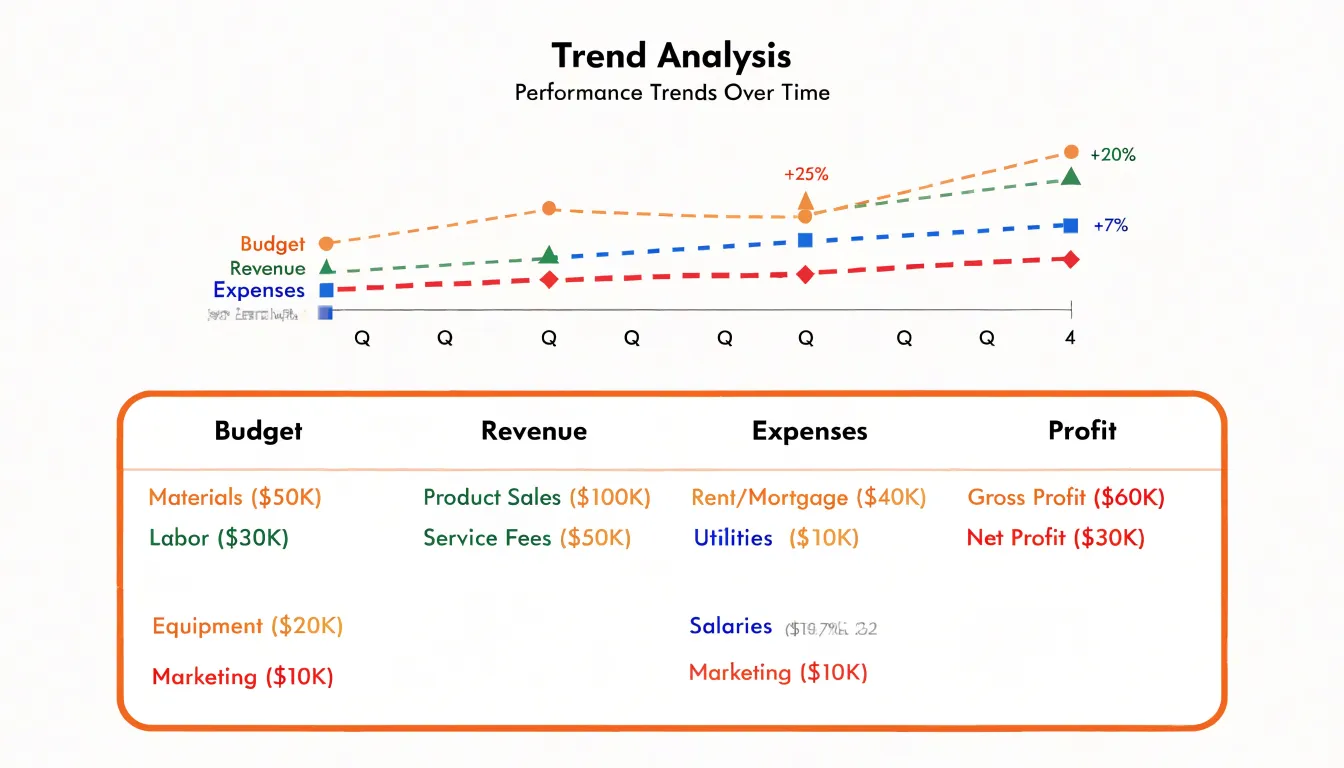
The chart and table should share the same categories, time periods, and units, so a reader can move from one to the other without recalibrating. Labels, color coding, and ordering should match across both elements. A common approach is to order table rows in the same sequence as the chart’s bars or lines, and to highlight the same subset of figures in each. Footnotes can explain definitions, data sources, and any adjustments applied, keeping the table compact while preserving auditability.
Placement matters as well. Putting the chart first signals that the visual summary is the primary message, while the table acts as supporting evidence. Placing the table first suits compliance-driven or technical audiences who need the numbers before they trust the picture. Many reports alternate between the two, using a chart to introduce each section and a table to close it, giving readers a guided path from overview to detail.
Accessibility
Accessibility in data visualization begins with color and contrast choices that ensure all users can interpret the information. The Web Content Accessibility Guidelines (WCAG) require a contrast ratio of at least 4.5:1 against the background for normal text, and at least 3:1 for large text or graphical elements. These ratios help users with low vision or color vision deficiencies distinguish chart elements.
When selecting colors, avoid relying solely on hue to convey meaning. Instead, use colorblind-safe palettes that vary in lightness and saturation as well as hue. Tools like ColorBrewer or Coblis can simulate how a palette appears to people with different types of color blindness, such as deuteranopia or protanopia. A common pitfall is using red and green to indicate positive and negative values, which can be indistinguishable to many viewers. Pairing colors with patterns or shapes adds another layer of distinction.
Direct text labels—such as series names at the end of lines or values printed at the end of bars—are equally important. Placing labels directly on or near data points reduces cognitive load and eliminates the need for color perception to match a legend. When a legend is necessary, ensure it uses high-contrast text and symbols, and consider adding textures or patterns to fill areas. Testing with real users, including those with disabilities, is the best way to validate accessibility.
Mobile Display
Adapting tables for small screens is critical in responsive design, as traditional table layouts often become cramped and illegible on handheld devices. Three common techniques address this, each with trade-offs depending on the data and user needs:
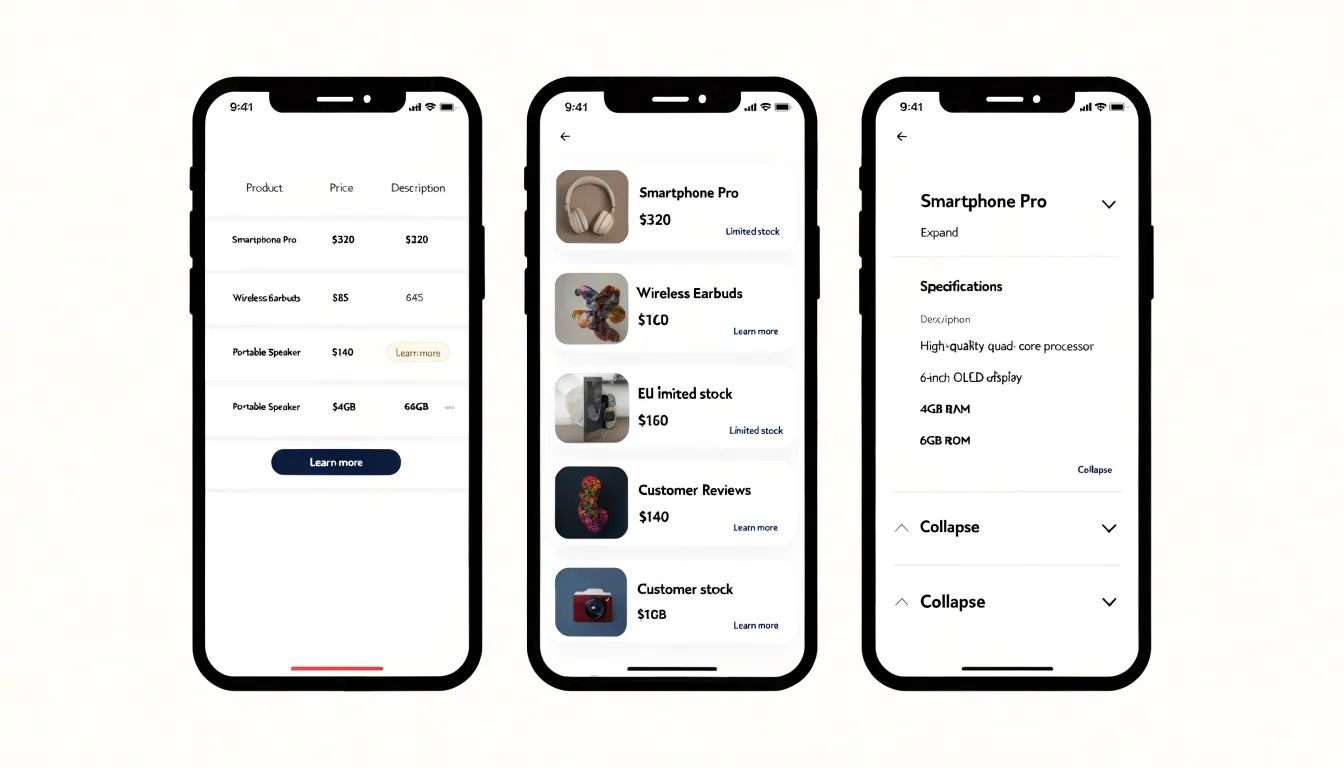
- Horizontal scrolling: Allows the table to maintain its tabular structure and data relationships while enabling users to swipe left and right to view all columns. It requires visible scroll indicators and careful implementation to remain accessible.
- Card views: Transforms each row into a self-contained card stacked vertically. This eliminates horizontal scrolling and presents data in a digestible format, though it increases vertical length and requires more scrolling.
- Collapsible rows: Allows rows to be expanded or collapsed to reveal or hide details. This is particularly useful for tables with many columns, letting users focus on the most relevant information while keeping the interface clean.
Common Pitfalls
Several recurring pitfalls undermine the credibility of data visualizations:
- Truncated axes: As noted with line and bar charts, starting a vertical scale above zero makes small differences appear dramatically larger than they are. Where a non-zero baseline is defensible, it demands clear labeling so the audience understands the visual comparison is amplified.
- Misleading scales: Uneven intervals, logarithmic axes presented without explanation, or charts that switch units midway lead readers to incorrect conclusions about magnitude and trend. Consistency in scale is essential when several charts sit side by side, since the eye naturally compares heights and lengths across panels.
- Three-dimensional effects: Perspective and depth cues shift the apparent size of bars and wedges depending on their position in the visual field, making a value look larger simply because it sits in the foreground. Decorative shading and angled axes add visual noise while obscuring the data.
- Overcomplication: Simple insights, such as a single figure rising over five years or one category outpacing another, are best expressed with straightforward formats. Packing a modest dataset into a radar chart, a stacked area graph, or a pie chart with many thin slices forces the reader to decode the graphic before grasping the message.
Before publishing any chart, ask whether a reader could misread the scale, whether decorative elements obscure the values, and whether a simpler format would communicate the insight more directly.
Audience Fit
Audience fit begins with assessing who will read the data and what they already know. Domain experts arrive with a working vocabulary, an understanding of typical ranges, and a tolerance for complexity that lets them scan a dense table quickly. They can hold multiple variables in mind at once, recognize anomalies without prompting, and move straight to the rows that matter to them. For this group, a table packed with precise figures often serves better than a simplified chart, because it preserves the granularity needed to verify, compare, and drill down.
Casual stakeholders operate under different constraints. They may lack familiarity with the jargon, the units, or the relationships between variables, and they typically give the display only a moment of attention. For them, data density becomes noise, technical terminology creates friction, and visual complexity—such as overlapping series or dual axes—adds cognitive load. A cleaner chart that highlights one comparison, uses plain labels, and rounds figures sensibly will communicate more effectively than an exhaustive table.
Tailoring the display means adjusting along three independent axes, allowing a single dataset to serve several audiences through separate views:
- Data density: How many figures and dimensions appear at once.
- Technical terminology: The language used in labels, titles, and annotations.
- Visual complexity: The chart type, color use, and number of elements competing for attention.
Where a single document must serve both groups, a hybrid report pairing a summary chart with a detailed table lets each reader engage at the level of detail their expertise supports.
Final Checklist
Before publishing any data visualization, systematically review these five factors to avoid defaulting to familiar formats without considering the task at hand:
- Data types and volume: Are the variables categorical, numerical, temporal, or relational? Categorical data often works well in tables when precision matters, while numerical trends are clearer in charts. Large datasets with many categories can overwhelm a chart, whereas tables support detailed lookups.
- User intent: Will readers compare values, identify patterns, or extract exact figures? Charts excel at comparisons and trends; tables support precise retrieval and reference.
- Communication goals: If the message is a single headline number or quick impression, a chart is often more impactful. If the goal is comprehensive detail or multi-variable decision-making, a table may be better.
- Audience and context: Consider expectations—some users expect tables in financial reports, while others prefer visual summaries in dashboards.
- Medium: Printed documents may favor tables for density, while web interfaces can support interactive charts.
Dashboards
A dashboard succeeds when a viewer can absorb the state of a system within seconds. That outcome depends less on individual charts than on how they are arranged and related to one another. The layout should follow a clear hierarchy: the few metrics that matter most occupy the prominent positions, usually across the top or in a large focal panel, while supporting detail sits below or to the side. Grouping related indicators together lets the eye travel naturally from summary to detail, so a reader who notices an anomaly in a headline figure can immediately find the context that explains it.
Filtering controls deserve deliberate placement. A consistent filter bar, typically anchored along one edge, keeps the available dimensions of the data visible without competing with the visualizations. When every chart responds to the same set of controls, the dashboard behaves as a single instrument rather than a collection of unrelated pictures. Interconnected charts reinforce this cohesion: selecting a region or time period in one view should update the others, keeping the reader’s exploration synchronized across the whole display.
Visual consistency carries much of the structure. Shared color meanings, aligned axes, and matched scales prevent readers from misreading a trend or comparing values that were never meant to be compared. Each chart should earn its place by answering a specific question, and the sequence of charts should follow a clear progression: overall health, where attention is needed, and the evidence behind that signal. When these principles hold, the arrangement itself guides the reader toward the decisions the data supports.
Frequently Asked Questions
When should I use a table instead of a chart?
Tables are best when readers need exact values rather than general impressions, and they support precise retrieval and reference. Charts are better for comparisons and trends.
What is the difference between a line chart and a bar chart?
Line charts excel at showing how a value changes across a continuous span, usually time. Bar charts are used when the central question is how several discrete categories stack up against one another.
Should a bar chart axis start at zero?
Yes. Starting the value axis at zero is essential for bar charts because bar length is the entire visual argument, and a truncated axis distorts the comparison.
How many slices should a pie chart have?
Pie charts work best when the data represents a genuine whole and the number of categories is small, typically no more than five or six. Grouping minor categories into an “Other” slice keeps the chart focused on the most significant components.
How can I make charts accessible to colorblind users?
Avoid relying solely on hue; use colorblind-safe palettes that vary in lightness and saturation as well as hue, and pair colors with patterns or shapes. A common pitfall is using red and green to indicate positive and negative values, which can be indistinguishable to many viewers.
How can I adapt tables for mobile screens?
You can adapt tables for small screens with horizontal scrolling, card views, or collapsible rows. Each technique has trade-offs depending on the data and user needs.
Tony Astor
Tony writes about data visualization and the tools people use to build charts and dashboards. More about Data Illustrator