Chart vs Graph: Is There Really a Difference?
 By Tony Astor ·
Chart vs Graph
A graph is a type of chart that plots numeric data on X and Y axes to show mathematical relationships between variables, such as how temperature changes over time. Charts are broader and can be qualitative or illustrative, like pie charts or flowcharts. Use graphs for precise values and trends; use other charts for proportions or processes.
Table of Contents
Chart vs Graph
Graphs are a specialized subset of charts designed to represent mathematical relationships. A graph explicitly plots numeric data along two axes—typically an X-axis (horizontal) and a Y-axis (vertical)—to show how one variable affects another. For example, a line graph plotting temperature over time uses the X-axis for time and the Y-axis for temperature to show how temperature changes.
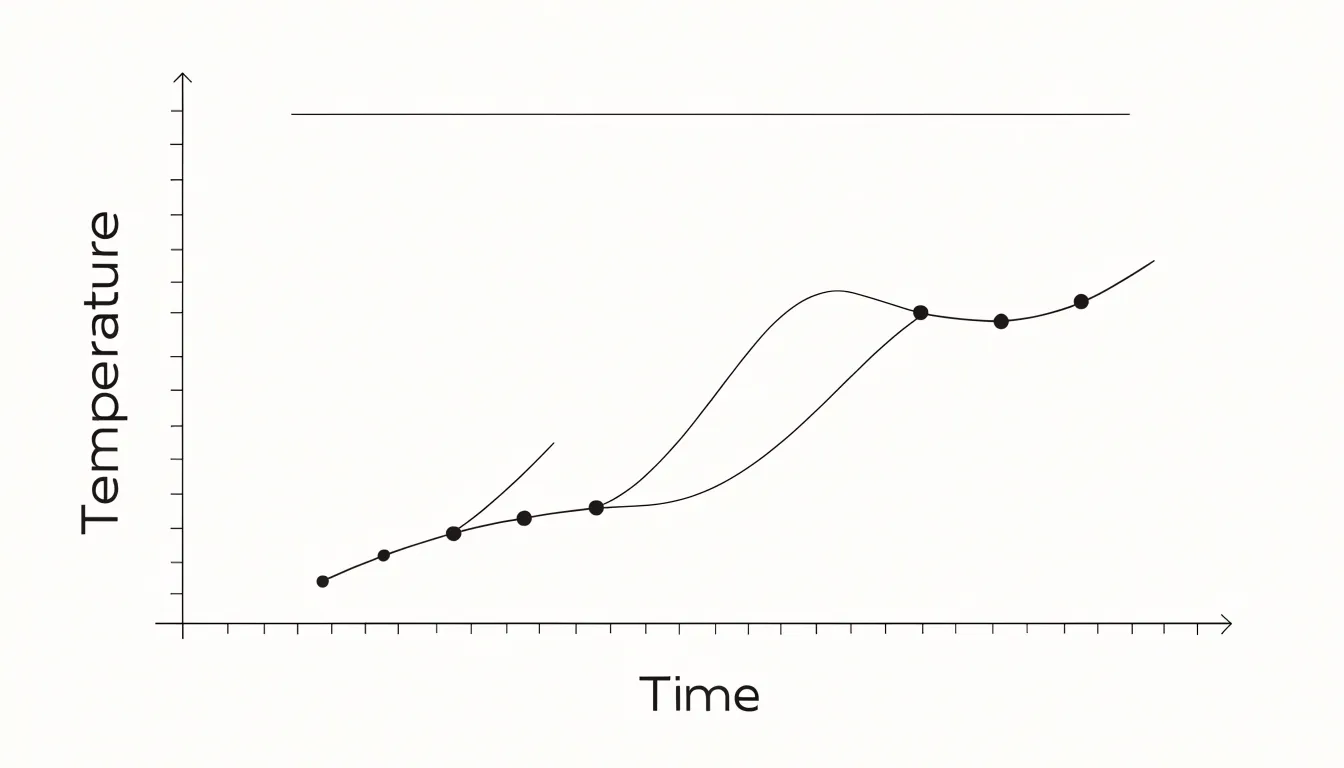
Graphs rely on a coordinate system where each point corresponds to a pair of values, making them suited to quantitative data and precise analysis. They can illustrate mathematical functions, such as y = 2x + 3, by plotting points that satisfy the equation and connecting them to form a line. Common types include bar graphs, which compare discrete categories using bars of varying heights, and scatter graphs, which display individual data points to reveal correlations.
Because graphs always involve a numeric scale and a direct mapping between data values and visual positions, they differ from the broader category of charts, which can be qualitative or illustrative. A chart might use icons, colors, or spatial arrangements without strict numerical axes—such as a pie chart showing market share or a flowchart depicting a process.
When the goal is to show exact values, trends, or mathematical relationships, a graph is often the best choice. When the goal is to show proportions or illustrate a sequence, other chart types may be more effective.
Chart Types
In business and academic settings, different chart formats answer different analytical questions:
- Bar charts use rectangular bars to compare quantities across categories, such as quarterly sales by region or survey responses by demographic.
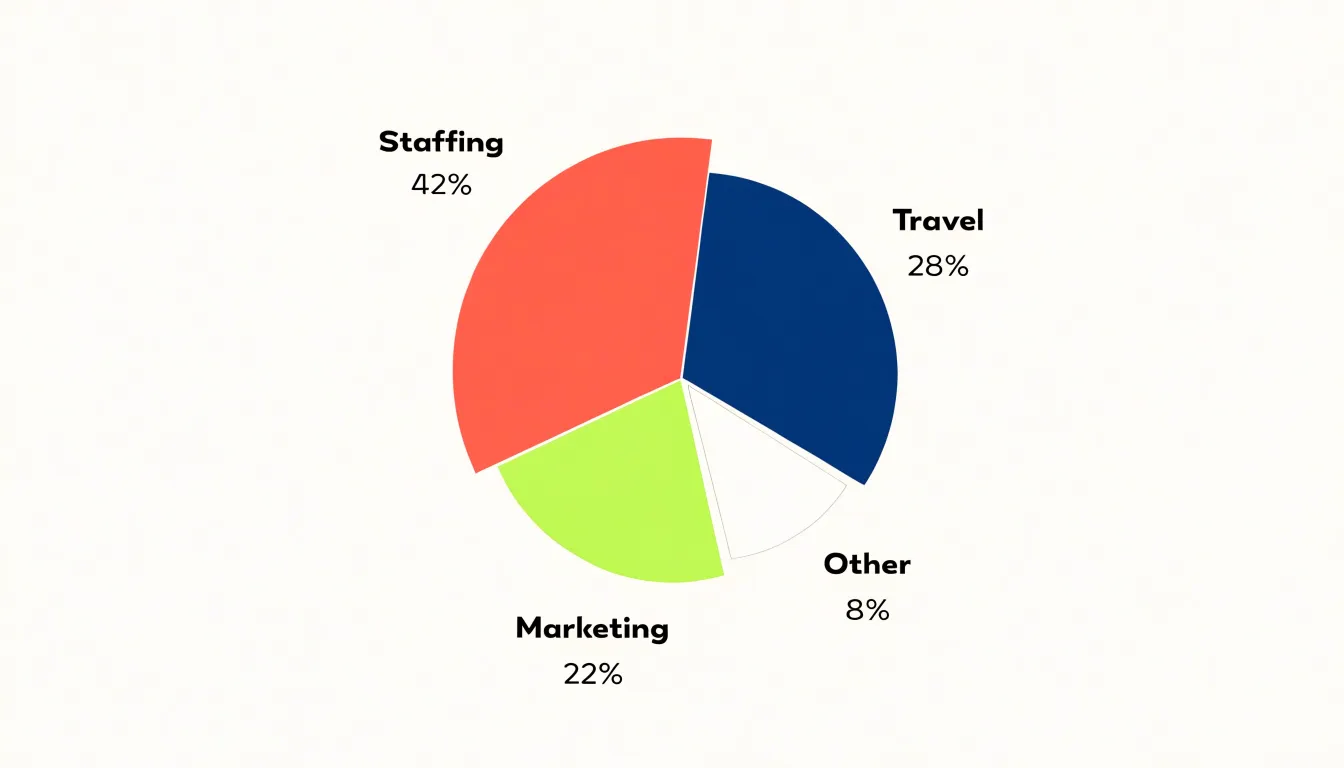
- Pie charts divide a circle into slices to show how parts contribute to a whole, appearing frequently in reports on budget allocation or market segmentation.
- Line charts connect plotted points to trace change over time, such as revenue growth, temperature records, or enrollment figures across semesters.
- Scatter plots map relationships between two variables and appear often in academic research.
- Flowcharts map sequential steps and decision points for process documentation and operations manuals.
- Organizational charts display hierarchy and reporting lines.
- Gantt charts arrange tasks along a timeline for project planning.
- Heat maps use color intensity to show concentration across a grid.
Comparisons favor bars, composition favors pies, trends favor lines, and processes or hierarchies favor diagrams.
Pie Chart
A pie chart represents a single total divided into categorical slices, with each slice’s angle proportional to its share of the whole. This makes it a natural fit for displaying percentages that sum to 100, such as survey responses on a single-choice question. The format works best when one slice dominates or the relationship between a few categories is obvious at a glance.
Best practices for pie charts include:
- Limit slices: Keep slices between three and five where possible, with seven as a practical ceiling. Group minor categories into an “Other” slice so tiny slivers and crowded perimeter labels do not make the chart illegible.
- Order logically: Arrange slices by size starting at the twelve o’clock position and moving clockwise.
- Label directly: Place category names and percentages on or beside each slice to remove the need for a separate legend and reduce back-and-forth eye movement.
- Keep styling flat: Use a limited, distinguishable color palette and avoid 3D effects, which distort angles.
Pie charts falter when readers need to compare similar values or track changes across multiple datasets. Human perception judges angles less accurately than lengths, making differences of a few percentage points hard to detect. When categories are close in size, numerous, or need ranking rather than composition, a horizontal bar graph works better. Bar graphs also accommodate negative values and multi-period comparisons, which a pie cannot show.
Line Graph
A line graph connects individual data points with a continuous line to track change over time. Each point marks a measured value at a specific moment, while the connecting line reveals direction and momentum across intervals.
When the horizontal axis represents a continuous span of time—days, months, or years—the line’s shape exposes several patterns:
- Trends: The broad upward or downward drift of a measure, such as a gradual rise in average temperature, a steady increase in monthly revenue, or a slow decline in customer churn.
- Seasonality: Recurring rises and dips tied to cycles like holidays, quarters, or weather, such as a retail line that spikes every December and sags every February.
- Chronological shifts: Inflection points where a trend reverses, plateaus where growth stalls, and periods of volatility where the line grows jagged.
Because time flows from left to right along the axis, the viewer reads the chart as a sequence of events. Evenly spaced intervals along the axis are essential to keep the slope honest and preserve the proportional relationship between elapsed time and visible change.
Bar Chart
A bar chart compares distinct groups using rectangular bars whose lengths are proportional to the values they represent. A retailer might compare sales figures for five store locations, a researcher might display survey responses across age brackets, or an analyst might show revenue by product line. The height or length of each bar carries the metric, letting the eye rank categories, spot outliers, and gauge the gap between the largest and smallest values.
Bars are drawn separately with visible gaps between them. These gaps signal that the categories are discrete entities rather than points along a continuous scale. Because the bars are separated, the layout avoids implying that one category flows into the next or that a trendline could be drawn meaningfully between them.
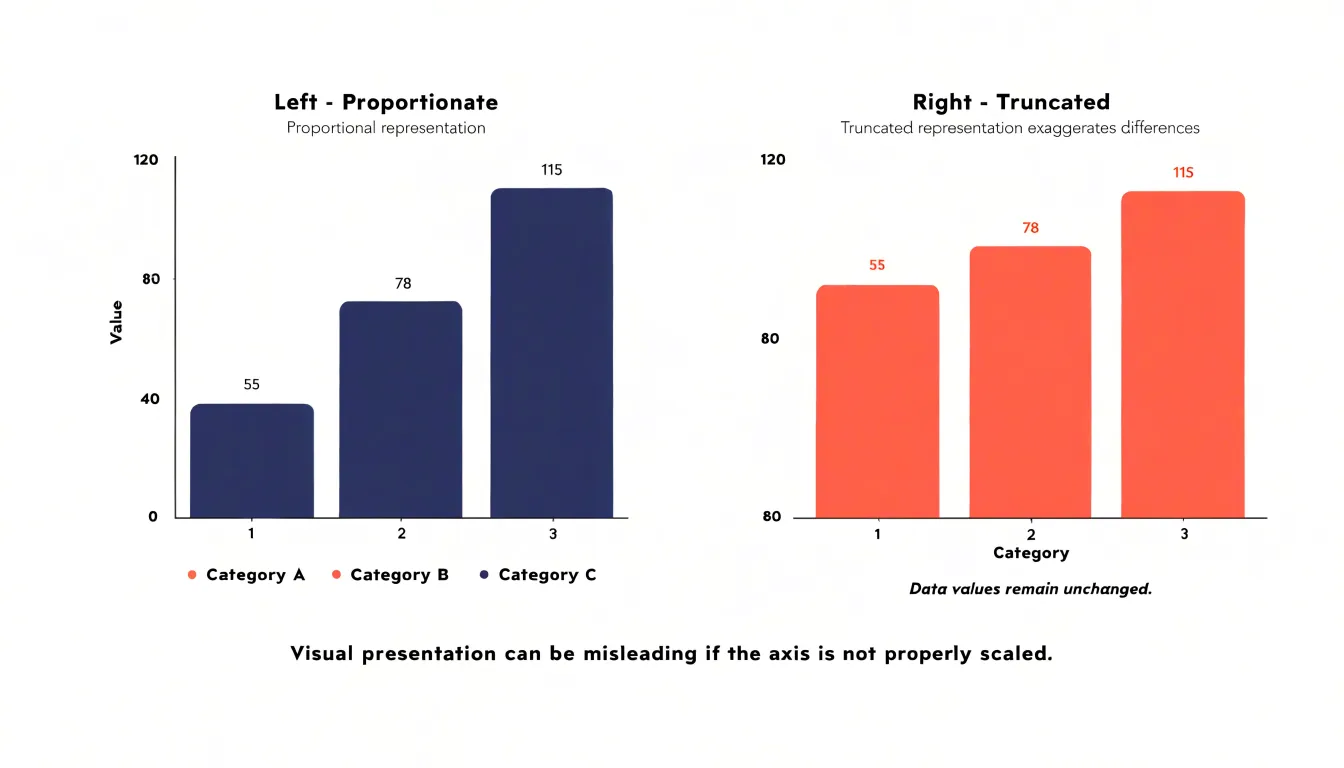
For clear bar charts, start the value axis at zero so bar lengths stay proportionate, order bars by value or by a logical category sequence, and keep labels tied directly to each bar. Horizontal orientation often suits longer category names, while vertical bars work well for shorter ones.
Scatter Plot
A scatter plot displays individual data points on a two-dimensional plane, with each point representing a pair of numerical values for a single observation. One variable is plotted along the horizontal axis and the other along the vertical axis, making this graph effective for exploring relationships between two variables without making assumptions about linearity or distribution.
Plotting paired observations helps analysts identify several patterns during exploratory data analysis:
- Correlations: A positive correlation trends upward from left to right (as one variable increases, the other increases). A negative correlation trends downward (one increases as the other decreases). How closely points cluster around a line or curve indicates correlation strength.
- Clusters: Groups of points sharing similar values on both variables, which can suggest subgroups within the data.
- Outliers: Points falling far from the main cluster that may warrant further investigation.
- Variability: When a trend line is added to highlight overall direction, the spread of points around the line indicates noise or variability in the data.
Flowchart
A flowchart maps processes and operational logic rather than numeric data. It uses standardized geometric shapes connected by arrows to show how a sequence of steps unfolds:
- Rectangles denote actions or tasks.
- Diamonds mark decision points where the path branches based on a yes-or-no condition.
- Ovals signal the start or end of a process.
- Parallelograms often represent inputs or outputs.
- Arrows show the direction of flow, including loops that return to an earlier stage.
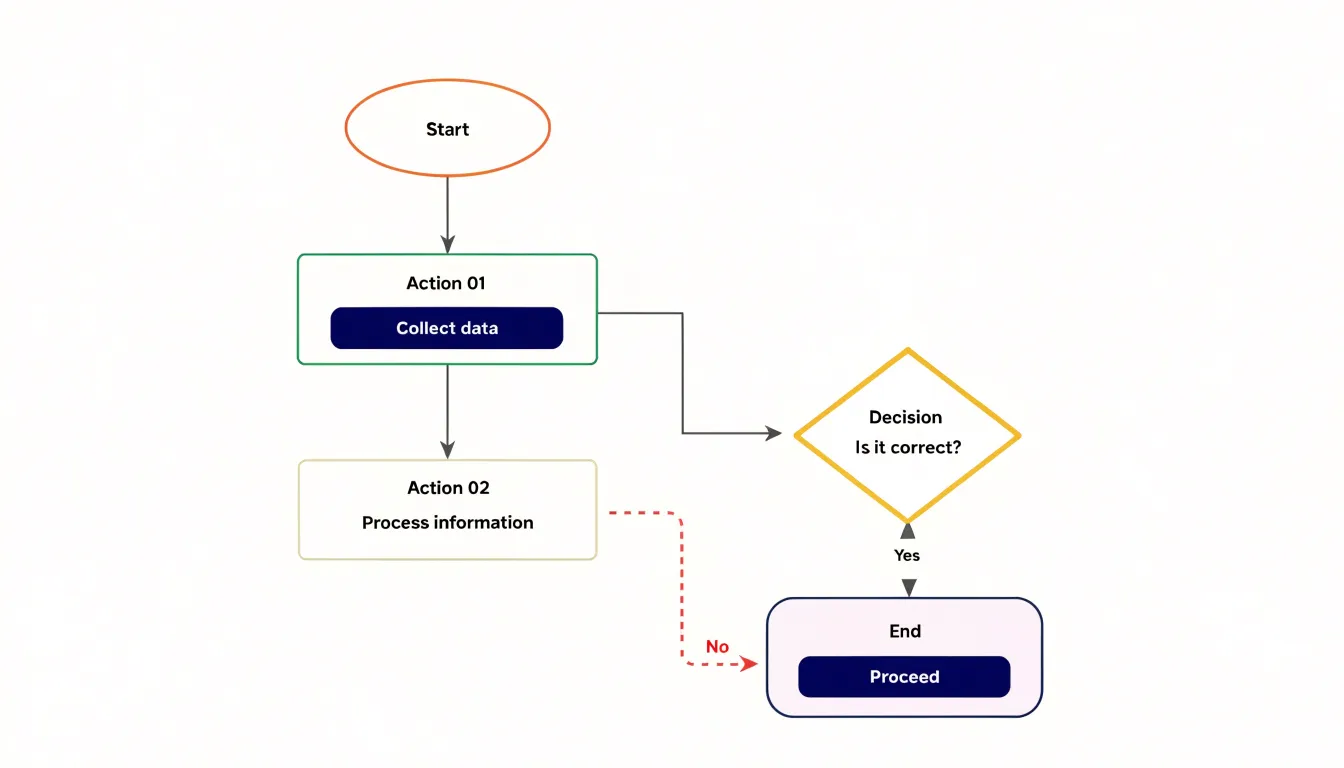
This structure makes sequential workflows and decision trees easy to trace in troubleshooting guides, approval procedures, onboarding routines, and software algorithms. Laying out a process spatially also exposes bottlenecks, redundant steps, and missing branches that prose often obscures, making flowcharts practical for auditing and improving procedures.
Graph Axes
A graph’s axes provide the coordinate framework that gives every plotted point a precise location. The horizontal X-axis typically carries the independent variable (the quantity the observer controls or selects), while the vertical Y-axis carries the dependent variable (the quantity that responds). Placing the input horizontally and the measured outcome vertically means a rising line reads naturally as the dependent value increasing alongside the independent one.
Each axis has a scale with labeled intervals. To plot an observation, move along the horizontal axis to the X value, move vertically to the matching Y value, and mark the intersection. The distance from the origin on each axis reflects how far a value sits from the baseline, while grid lines or tick marks help readers translate a point back into its underlying numbers. Clear axis labels, explicit units, and consistent scaling keep this reading reliable.
Choosing a Visual
Selecting a chart starts with identifying whether your data is categorical (distinct groups like product types or regions), continuous (measurable quantities within a range, like temperature or revenue), or both.
Next, match the quantitative relationship you want to highlight to the appropriate format:
- Comparisons: Bar charts or dot plots.
- Trends: Line charts or area charts.
- Compositions (parts of a whole): Stacked bars, pie charts, or treemaps.
- Correlations: Scatter plots.
Finally, factor in your audience and presentation context. A technical audience may appreciate heatmaps or box plots, while a general audience benefits from simpler designs. A detailed report can accommodate multiple charts, whereas a slide deck demands quick insights.
Clear Design
Effective visual hierarchy rests on three design practices: typography, color contrast, and decluttering.
Choose a legible typeface sized for both print and phone screens. Place labels close to the elements they describe, and use consistent capitalization and phrasing for axis titles. Setting the most important numbers or categories slightly larger or darker creates a hierarchy that gives the viewer a clear entry point.
Data marks need strong contrast against the background and surrounding whitespace so they remain visible at small sizes or in low-quality reproductions. Text must also stay legible against whatever fill sits behind it. A restrained palette of distinct hues, used consistently, lets viewers track categories without repeatedly consulting a legend.
To declutter, remove gridlines that add no reference value, trim redundant tick marks, and drop decorative borders and background shading. Replace separate legends with direct labels next to the data series where possible. In a clean hierarchy, the title states the subject, the axes and labels orient the viewer, and the data marks carry the message.
Common Mistakes
Common design errors can distort data even when the underlying numbers are accurate:
- Truncated axes: Starting a vertical scale at a value other than zero makes small differences look dramatic. A bar chart starting at 80 instead of 0 can make a three-point change look like a doubling because readers absorb visual proportions before reading labels.
- Improper scaling: Uneven tick marks, unlabeled logarithmic scales, or dual axes with differing increments compress some changes and inflate others. Intervals should be uniform, and any nonstandard scale must be clearly labeled.
- Cherry-picked date ranges: Starting a time window at a trough or ending at a peak can reverse the apparent trend of a longer series, and comparing two line charts over different periods compounds the error. State time frames explicitly and hold the window constant across compared series.
- Visual distortions: Stretched icons, 3D effects that inflate foreground elements, and shaded areas that exaggerate magnitude all misrepresent values. Always check whether the visual impression matches the underlying numbers.
Real-World Usage
In everyday practice, workplace vocabulary and software conventions shape how people use the words chart and graph.
In corporate communication, chart usually signals a structured overview: org chart, Gantt chart, chart of accounts, or phrases like “charting progress,” which borrow from the maritime sense of mapping a route. Graph tends to appear in quantitative contexts, such as performance graphs, growth graphs, or quarterly review graphs.
Software naming reinforces this split. Spreadsheet programs offer a chart wizard and chart gallery to produce summaries like pie or bar charts, while statistical and mathematical packages feature graphing calculators, graph editors, and graph databases that deal with nodes, edges, or plotted coordinates.
In casual speech, however, the terms often function as synonyms. People use bar chart and bar graph interchangeably, weather reports show a “chart of temperatures,” and news anchors refer to “graphs of unemployment” without causing confusion.
Selection Guide
Use these six rapid-fire questions to pick or verify a format in under a minute:
- Does the content involve numbers? If no, use a diagram, flowchart, or schematic rather than a numeric visual.
- What relationship matters most? For comparing quantities, use a bar chart or dot plot. For showing how one quantity changes across a continuous range or time, use a plotted graph.
- Does the audience need exact figures or a broad pattern? Precision favors clearly labeled charts with few series; pattern recognition favors graphs where the shape of a line or curve carries the message.
- How many variables are in play? Two or three series remain readable in almost any format, while many series require grouping, facets, or a summary view.
- What is the destination? Match the complexity to the space and attention constraints of a slide, dashboard, or report.
- Does it pass the five-second test? Ask a colleague to glance at the draft for five seconds and state the takeaway. If their answer drifts from your intended message, revisit the format.
Dashboard
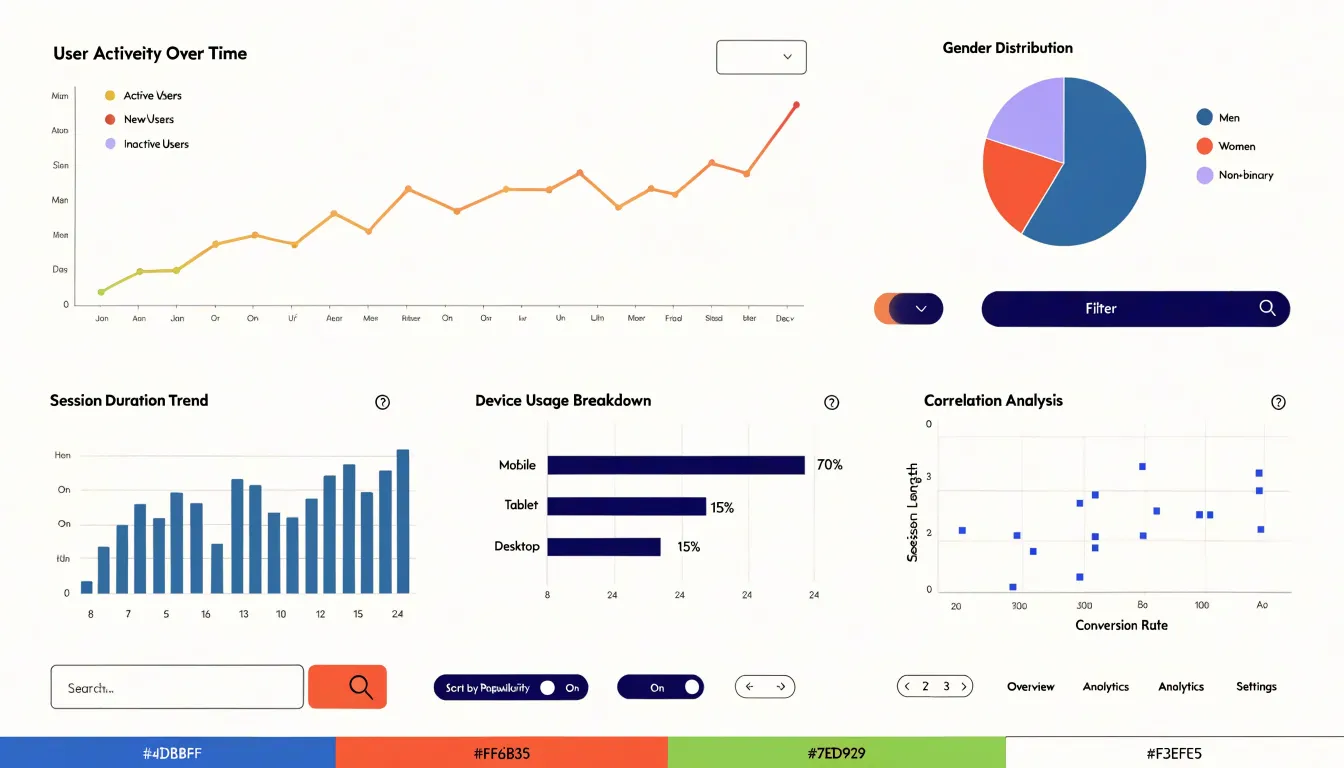
A dashboard assembles multiple charts and graphs into a single view. To inform rather than overwhelm, organize it around hierarchy, interactivity, layout, and audience:
- Hierarchy and consistency: Give the chart answering the primary question the largest space and most prominent position—typically the upper left for left-to-right reading cultures—with supporting charts in secondary positions. Maintain consistent axis conventions and a shared color vocabulary across widgets; if one chart uses red for growth and another uses red for decline, viewers waste energy decoding.
- Predictable interactivity: Filters and selectors should update every relevant chart in concert. Cross-filtering (clicking a data point in one chart to narrow the others) must be obvious and reversible, supported by clear reset controls and visible filter states so viewers do not misread a filtered view.
- Layout and performance: Group related charts into visual panels, use whitespace to separate themes, and align widgets to a consistent grid. Ensure the dashboard loads quickly and refreshes predictably to maintain user trust.
- Audience fit: Tailor the view to its use case—an executive summary prioritizes headline metrics, while an analyst view can carry granular charts with drill-down paths.
Frequently Asked Questions
What is the difference between a chart and a graph?
A graph is a specialized subset of charts designed to represent mathematical relationships, typically plotting numeric data along two axes. Charts are broader and can be qualitative or illustrative, using icons, colors, or spatial arrangements without strict numerical axes.
How many slices should a pie chart have?
Keep pie chart slices between three and five where possible, with seven as a practical ceiling. Group minor categories into an “Other” slice so tiny slivers and crowded perimeter labels do not make the chart illegible.
What can a line graph show over time?
A line graph can expose trends, seasonality, and chronological shifts such as inflection points, plateaus, and periods of volatility. It connects individual data points with a continuous line to track change over time.
Why should a bar chart start at zero?
Start the value axis at zero so bar lengths stay proportionate. A truncated axis starting at a value other than zero can make small differences look dramatic.
What patterns can a scatter plot reveal?
A scatter plot can reveal correlations, clusters, outliers, and variability. Plotting paired observations helps analysts explore relationships between two variables during exploratory data analysis.
When should you use a bar chart instead of a pie chart?
Use a horizontal bar graph when categories are close in size, numerous, or need ranking rather than composition. Bar graphs also accommodate negative values and multi-period comparisons, which a pie cannot show.
Tony Astor
Tony writes about data visualization and the tools people use to build charts and dashboards. More about Data Illustrator