Chart Legends: Best Practices (and When to Skip Them)
 By Tony Astor ·

Chart Legends
A chart legend is a visual key that maps each color, shape, or line style in a chart to the data category it represents, letting readers decode and compare plotted marks. It should sit close to the data, use concise labels and consistent encoding, and be omitted entirely when direct labeling or a single series makes it redundant.
Table of Contents
Legend Purpose
A legend serves as the reader’s translation key for everything the chart encodes visually. When a chart uses color, shape, or line style to distinguish among categories, those visual differences carry meaning only if the reader can map each one back to the data it represents. A blue line means one thing, an orange dashed line means another, and without a legend the reader is left guessing at which is which.
This decoding function becomes more important as the number of encoded categories grows. A chart with two series may survive without a legend if the labels are placed directly beside the lines, but a chart with six series, a scatter plot with three marker shapes, or a map with a graduated color scale all depend on a clear key to be readable at all.
The legend also supports comparison. Once readers have decoded the encoding, they can scan back and forth between the plotted marks and the legend to identify which series is rising fastest, which category clusters in a particular region, or which line diverges from the rest. Because this back-and-forth reading is a normal part of how people interpret charts, the legend needs to sit close enough to the plotting area to support it.
Consistency matters as well: the same color, shape, or line style used in the legend must appear identically in the chart, with matching swatches and clear labels. A legend that is incomplete, ambiguous, or visually disconnected from the marks it describes forces readers to work harder than the data itself requires.
Legend Placement
Legend placement determines how quickly a reader can connect a label to the data it describes. Every glance away from the data to hunt for a legend costs attention and interrupts the comparison the reader is trying to make.
When a legend sits at the top of a chart, it establishes a visual key before the eye moves into the plotted area. Western readers typically scan from top-left downward and across, so a horizontal legend anchored above the plot follows the same path the eye is already traveling. The reader encounters the color swatches and their names first, holds that mapping briefly in mind, and then meets the marks with the code already loaded.
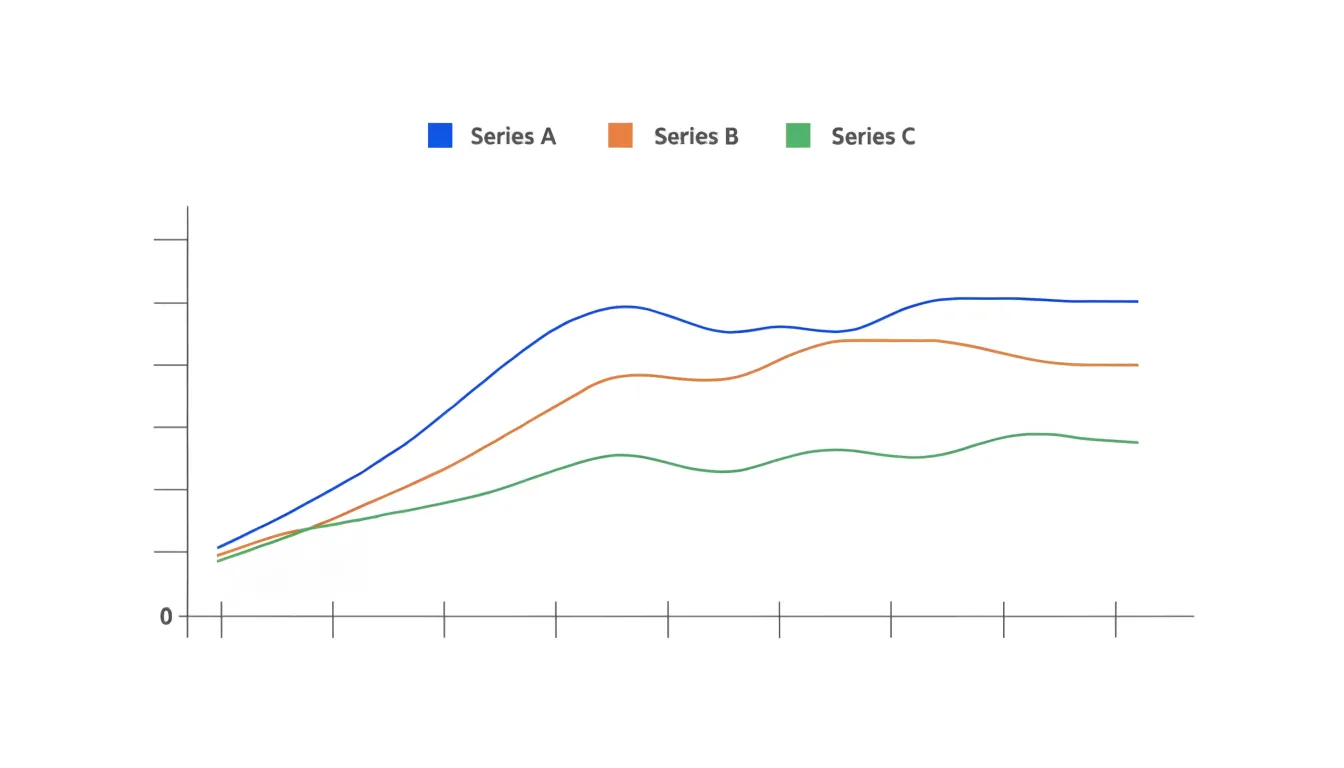
A legend placed to the right of the plot works in a similar way for side-by-side arrangements, keeping the key within the same horizontal band as the data and preventing the eye from jumping back and forth across the full width of the graphic. Both positions keep the legend outside the plotting region, where it can name categories without colliding with marks or gridlines.
Placement also affects how much of the chart can be devoted to data, so the choice involves balancing scan efficiency against available space. Top and side positions generally preserve a compact plotting area while keeping labels legible and close at hand.
Direct Labeling
Direct labeling places the descriptive text right on or immediately beside the data it describes: a line carries its own name at its endpoint, a bar shows its value at the tip, and a plotted point sits next to its identifier. The reader’s eye travels a short distance from mark to word, and the act of interpretation stays local to the element being examined.
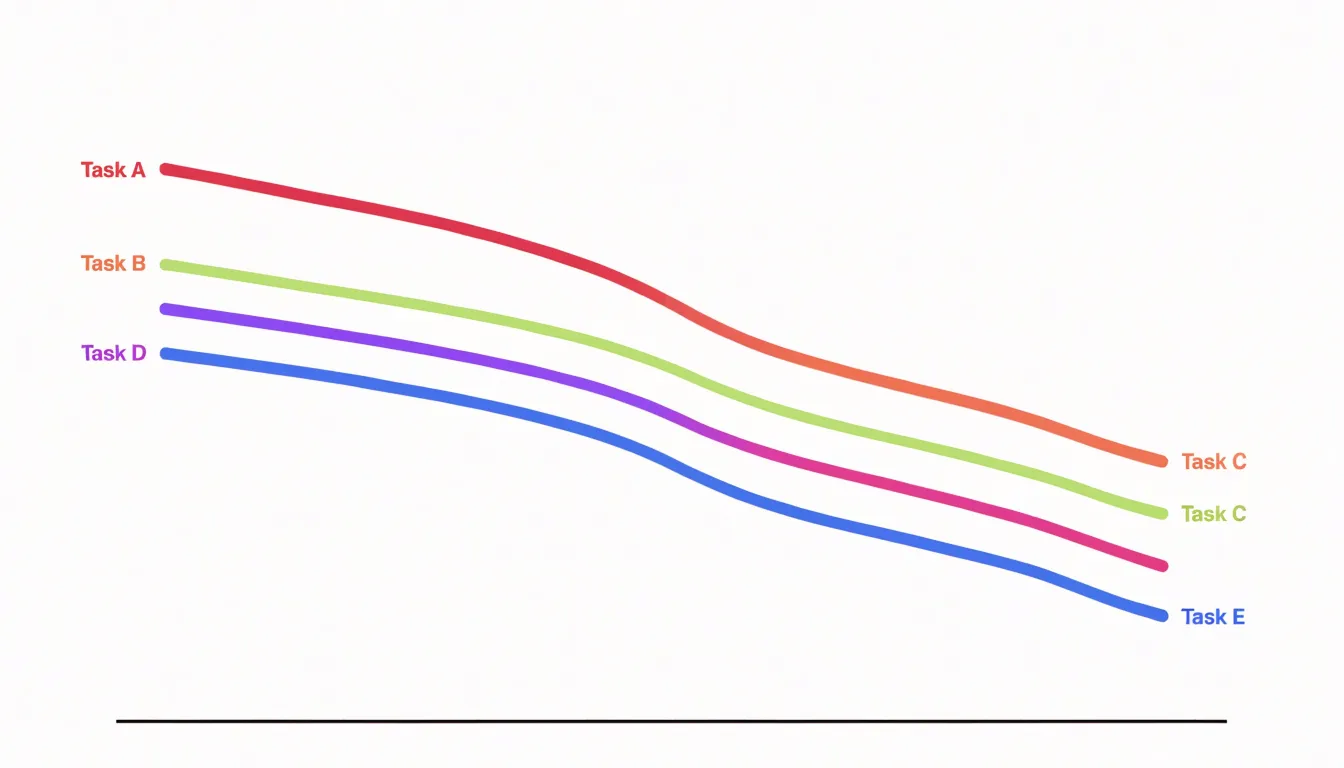
When a label sits adjacent to a data point, the viewer registers the connection instantly, eliminating the scanning detour to a distant key and the risk of mismatching a color swatch with the wrong category.
In practice, the technique often simplifies the chart’s structure. Removing the legend box lets the plotting area breathe or grow. The palette also loosens: when every series is named at its mark, color no longer has to carry the whole burden of identification, so a designer can choose hues for aesthetic harmony or accessibility rather than maximum contrast between swatches. The labels themselves become part of the visual composition, creating a typographic rhythm that guides the eye along the data.
Labels should sit where they do not collide with marks or with one another, commonly just above a line’s final point, at the end of a bar, or offset slightly from a marker. A small halo or matching text color can tie the label to its series. On dense charts, selective labeling works well: name the series that matter most and let the rest recede, preserving clarity without visual noise.
Color Coding
When an analyst assigns shades of the same hue to related categories, the eye picks up on that family resemblance before any label is read. A sequential palette of blues, for instance, can carry the reader from a light, almost tentative tint through to a deep, saturated navy, and the legend simply names the steps along that path.
Intuitive hue palettes matter because they lean on associations viewers already carry:
- Greens suggest growth or positive movement.
- Warm oranges and reds read as intensity or caution.
- Cool grays recede into background roles.
When the legend’s color choices align with those expectations, the chart requires less decoding, and readers move through the data without pausing to consult the legend for every mark.
Distinct contrast levels reinforce this effect. Adjacent categories need enough separation in lightness or saturation that they remain distinguishable, even for viewers with reduced color sensitivity or those reading on a dim screen. A legend built on well-spaced steps gives each category its own visual weight.
The balancing act is restraint. Too many hues turn a legend into a rainbow and force viewers to match marks against a crowded key, while too few distinctions blur categories together. A careful designer limits the palette to the number of groups that genuinely need separation, then uses contrast to signal hierarchy within that set.
When to Skip the Legend
A legend earns its place on a chart by resolving ambiguity. When every mark on the canvas belongs to one series, there is nothing to resolve. A single line tracking revenue over twelve months, a lone bar sequence showing monthly signups, or one scatter of points representing a survey sample all communicate their meaning through axis labels and a clear title. Adding a legend box in these cases introduces visual noise: an extra bordered box, an extra swatch, and an extra line of text competing for attention with the information itself.
The same logic applies to charts whose encoding is self-explanatory. When a bar chart’s categories are printed directly beneath each bar, or a pie chart’s segments are labeled in place, a separate key simply restates the obvious. A legend becomes necessary only when in-place labeling is impractical, such as when many segments crowd a small space or colors must be distinguished across a dense visual field.
Every element on a chart should justify its presence by adding information rather than restating it. Titles, axis labels, and annotations carry the interpretive burden; a redundant legend merely occupies space that could hold data, and in small multiples or dashboards that space is precious. The test is simple: if removing the legend leaves no reader question unanswered, leave it out.
Concise Labels
The space a legend occupies is precious, and every word competing for attention in that small area weakens the chart’s overall impact. Start by identifying the single concept each legend entry needs to convey. A label reading “Total Quarterly Revenue from Domestic Sales” can usually become “Domestic revenue” or simply “Domestic” when the surrounding context already establishes the subject.
Techniques for trimming wordy descriptor keys down to core terms include:
- Removing redundant category words such as “total,” “amount,” or “value” when the units and axis titles already communicate them.
- Dropping prepositions and articles that add grammatical completeness but no meaning.
- Standardizing the grammatical form across all entries so that parallel construction itself shortens labels.
For example, a legend listing “Number of New Customers Acquired in Region A” next to “Number of New Customers Acquired in Region B” collapses neatly into “Region A” and “Region B” once the chart title supplies the rest of the story.
Avoid the opposite failure, where compression produces obscure jargon or labels readers cannot decode without effort. Abbreviations work best when they are widely recognized in the audience’s domain, such as “Q1” or “USD,” and poorly when they demand recall of an earlier definition. Acronyms invented solely to save space tend to confuse rather than clarify.
A useful test is to imagine a reader encountering the legend without having read the article body; if the label remains intelligible, the compression has succeeded. Reading labels aloud also helps, since awkward truncations become obvious in speech. Keeping the core noun or distinguishing term and discarding modifying phrases usually lands on the right balance.
Symbols and Icons
In any chart with more than a handful of series, color alone becomes a fragile carrier of meaning. Symbols and icons solve this by attaching a second, independent channel of identification to every data series. A triangle, square, diamond, or cross can be distinguished at a glance even when a reader’s color perception is limited, when a chart is printed in grayscale, or when two hues sit close together on the spectrum. Each series should be recognizable through shape as well as through color, so that identification never depends on a single visual cue.
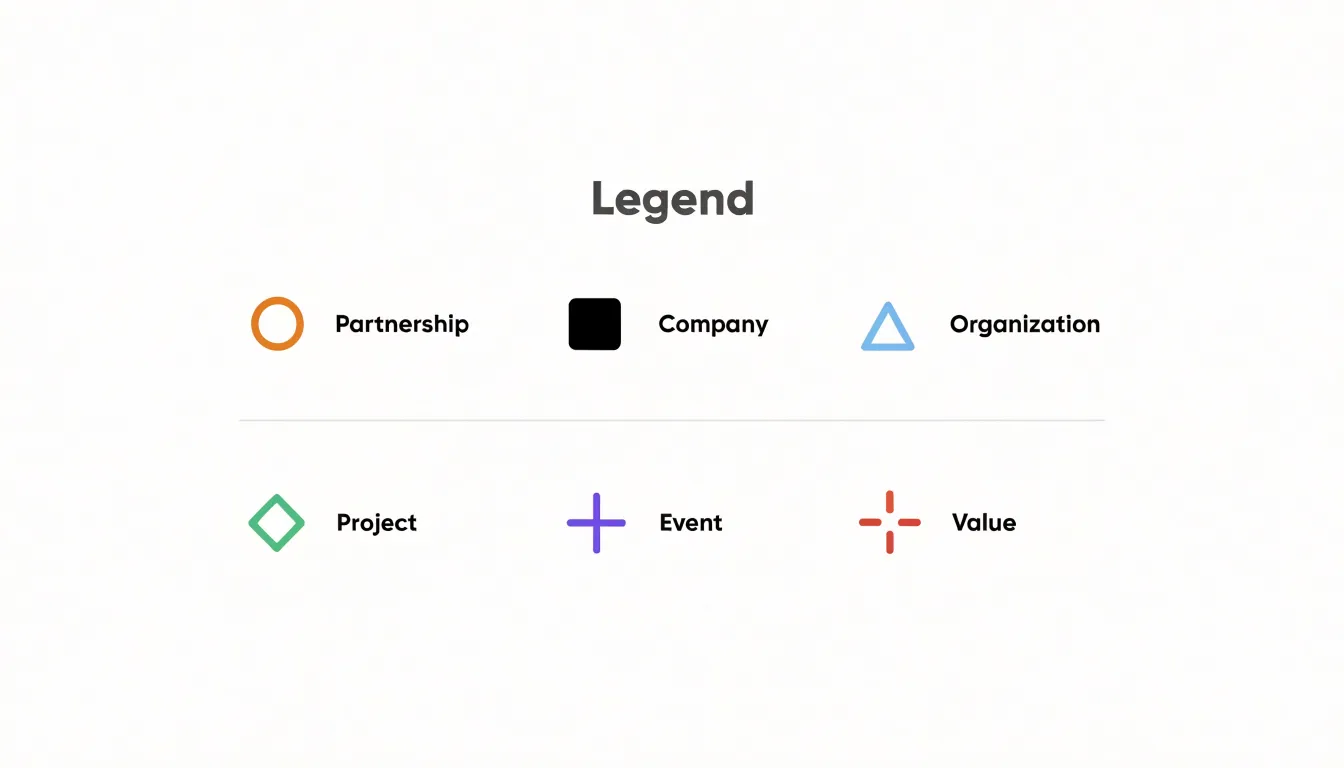
Distinct shapes work best when they differ structurally rather than subtly. A filled circle and a hollow circle read as variations, while a circle, triangle, and square read as categories. Designers typically build a small library of markers that remain legible at 6 to 8 pixels: circle, square, triangle, diamond, plus, and cross cover most needs before repetition or visual noise sets in. For line charts, the marker sits directly on the line, so its silhouette must stay sharp against both the stroke and the background.
Icon markers extend this logic for thematic data. A chart of transport modes might use a small train, car, or plane glyph; a weather chart might use a sun or cloud. Icons carry meaning instantly and reduce the need for a legend lookup, but they must be simplified to their essential silhouette so they remain crisp at small sizes. Pairing icons with consistent colors, so the sun glyph is always the same amber, strengthens recognition across a report or dashboard.
The combination of shape and color yields charts that stay readable across print, projection, color-vision deficiency, and dense multi-series overlays.
Font Choice and Sizing
The labels in a legend are read quickly and often at a glance, so legibility must guide every typographic decision. Start with a typeface that holds up at small sizes: a clean sans-serif with open counters and generous letter spacing tends to render more clearly than condensed or decorative faces. The font used in the legend should match the chart’s overall typography, creating visual continuity between the data marks and their explanations.
Hierarchy matters as much as the typeface itself. The legend title, where one exists, should sit slightly above the individual entries in size or weight, giving readers an entry point before they scan the labels. Individual legend entries should share a single consistent size, usually two to four points smaller than the main body text of the surrounding document, so the legend reads as supporting material without becoming illegible. A medium or semibold weight for the title and a regular weight for entries keeps the distinction clear without relying on size alone.
Minimum size requirements deserve careful attention:
- On screen: Legend text should rarely fall below 10 to 12 pixels.
- In print: Roughly 7 to 8 points is the practical floor for comfortable reading.
These thresholds shift with viewing distance and output medium, so a printed poster tolerates smaller relative sizes than a mobile dashboard. Testing the legend at its final display size, on the intended device or paper, reveals problems that designs viewed at full zoom will hide. When space is tight, trimming or abbreviating labels serves legibility better than shrinking the type. Generous line spacing and adequate contrast between text and background ensure every label remains easy to read under real-world conditions.
Mobile Charts
Mobile viewports present a distinct set of constraints for chart legends, where horizontal space is scarce and touch interaction replaces pointer input. On a handheld screen, a legend that sits comfortably beside a chart on a desktop layout can quickly consume the majority of the available width, squeezing the plotting area into an unusable sliver. Responsive design addresses this by treating the legend as a flexible element whose form changes with the viewport:
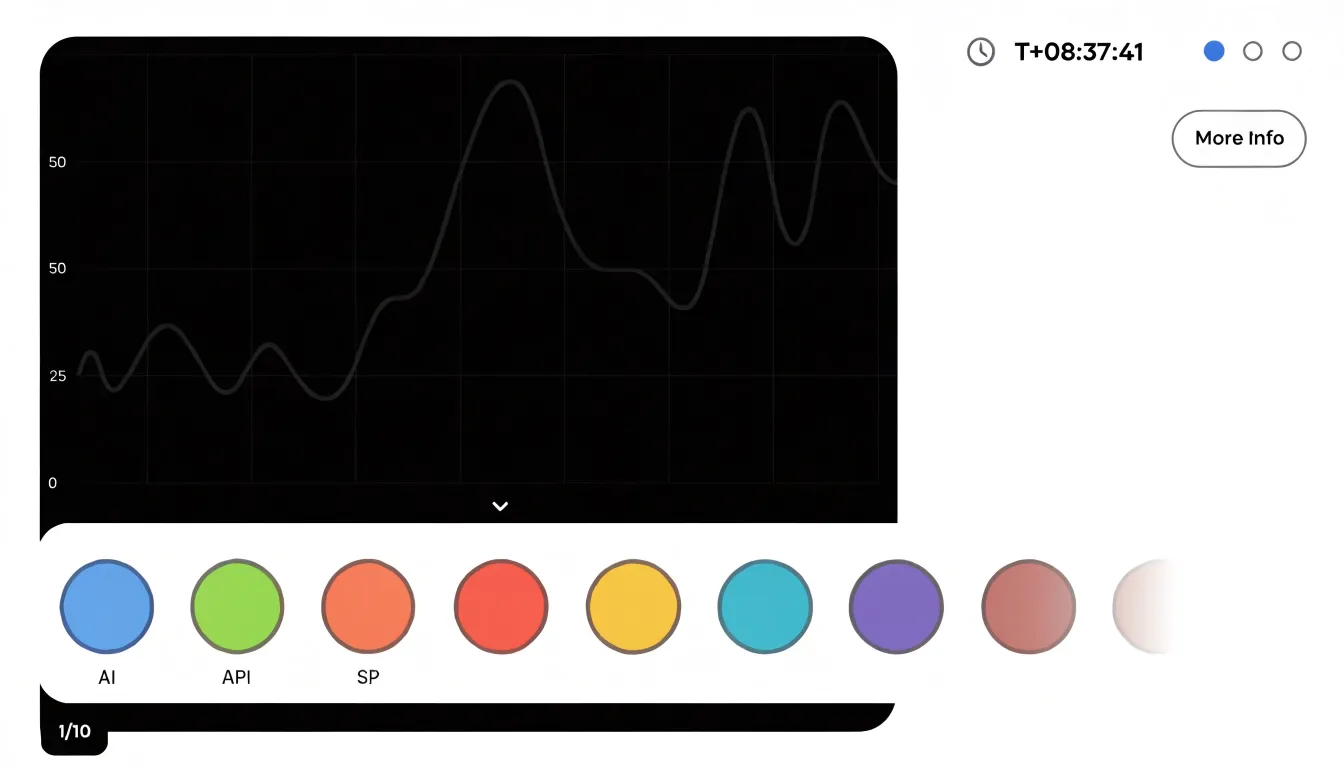
- Wrapping: Legend items flow onto multiple lines beneath or above the chart, with items sized to their labels and the container reflowing as width changes. Wrapping keeps every series visible at once, which suits charts with a modest number of categories, though it can push the chart itself down the page when many items are present.
- Scrolling: Entries sit in a horizontally scrollable strip or a vertically scrollable panel so the chart retains a fixed footprint. This preserves screen real estate for long item lists but hides some entries off-screen, so clear affordances such as partial item visibility or a fade edge help users discover the additional content.
- Collapsing: The legend tucks behind a toggle or summary control that expands on tap. This works well when the chart is the primary focus and the legend is consulted only occasionally, though it adds an interaction step and requires careful labeling so users know what the control reveals.
In practice, these techniques are often combined: items wrap until a threshold, then scroll or collapse beyond it. Designers also adjust touch target sizes, font scaling, and item spacing for finger input, and they test across portrait and landscape orientations to confirm the legend remains legible without crowding the visualization.
Accessibility
Accessibility in chart legends begins with contrast. Legend text, swatches, and the surrounding background all need to meet recognized WCAG contrast ratios so that labels remain legible for people with low vision or for anyone reading on a screen in bright ambient light. Light gray legend text against a white background looks elegant in a design mockup but becomes nearly invisible for a substantial portion of readers. The same principle applies to borders around swatches, which help distinguish pale fills from the chart background.
Screen reader compatibility extends this work into the markup layer. A legend rendered purely as visual elements, such as colored rectangles positioned with CSS, carries no meaning for assistive technology. Proper implementation associates each legend label with its corresponding series so that a screen reader announces something meaningful, like “Revenue, blue square,” rather than reading an unlabeled decorative block. Where charts are embedded as images, the surrounding text and alt descriptions should summarize what the legend conveys. Keyboard navigation matters too, particularly for interactive legends that toggle series visibility.
Pattern fills address the needs of readers with color vision deficiencies. Overlaying distinct patterns, such as stripes, dots, or crosshatching, on each series gives every category a second visual channel beyond color. Combined with direct labeling where space allows, pattern fills let readers match legend entries to chart marks without relying on subtle shade differences.
Pie and Donut Charts
When category names sit in a separate legend beside a pie or donut chart, the eye must travel from slice to key and back again, holding the color in working memory during the journey. Direct labeling removes that friction by placing the category name and its percentage right on or beside the slice it describes, so the reader absorbs both in a single glance.
Positioning matters as much as the pairing:
- Place names and percentages along the outer arc of each slice, sitting in the natural reading path of the eye as it sweeps around the circle.
- For small slices where text cannot fit inside, use a short leader line to carry the label outward without ambiguity.
- Position percentages near the outer edge, where the slice is widest, so they stay legible even in donut charts with narrow rings.
The result is a compact chart where color serves as a supporting cue rather than the sole carrier of identity. Readers can immediately see which category is largest and roughly what share it holds without scanning a key or counting color swatches.
Scatter Plots
Scatter plots earn their place when a dataset carries several variables at once, and the legend is where that complexity becomes readable. A single point can encode position on two axes, size for a third variable, shape for a fourth categorical dimension, and color gradient for a fifth continuous measure. Each of these channels needs its own key entry:
- Size: Show a few reference bubbles at meaningful intervals so viewers can calibrate magnitude without guessing.
- Shape: Provide a labeled sample in the key for every distinct categorical marker used in the plot.
- Color gradients: Include a continuous scale bar with tick values, particularly when the underlying variable spans orders of magnitude.
The decision about legend depth follows directly from how many visual channels are active. A simple scatter plot with one series may need nothing more than a title and axis labels. Add a second or third categorical group and a compact key of shape or color swatches becomes necessary. Once sizing and gradients enter the picture, the legend grows into a small reference panel: place it outside the plotting area to prevent overlap with data points, and group related entries together to keep the reading order logical.
Interactive charts can offload some of this burden through hover tooltips, though a static legend remains essential for printing and for readers scanning the overall structure before examining individual points.
Interactive Hover
Interactive hover behavior gives web charts a way to present legend information precisely when a reader needs it, rather than reserving permanent screen space for a static key. When a pointer moves over a legend entry or a plotted series, a dynamic tooltip can surface the series name, its current value at the nearest data point, and any relevant units or annotations. Because the detail appears at the moment of interest and then recedes, the chart stays uncluttered while still offering depth on demand.
Hovering over a legend entry can also trigger an active highlight state: the corresponding line, bar series, or scatter group brightens while other elements dim, letting the reader isolate one variable and trace it across the plot without losing the surrounding context. The same interaction works in reverse, with hovering a data mark lighting up its legend label so the reader can confirm what they are looking at. On touch devices, this translates into tap-to-reveal patterns with the same tooltip and highlight logic applied to a pressed element.
Careful implementations keep tooltips positioned near the cursor without covering the data they describe, transition highlight states smoothly enough to avoid flicker, and ensure that keyboard focus can reach legend entries so the same details remain available to users who cannot hover.
Common Legend Mistakes
Three frequent design traps account for a large share of legend-related confusion:
- Distant positioning: A legend placed at the opposite corner of a wide chart forces readers to shift their gaze across the figure on every reading, increasing the chance that a color or symbol is matched to the wrong series. Keep the legend within comfortable scanning distance of the plotted marks, ideally near where the corresponding series appear, or label series directly when space permits.
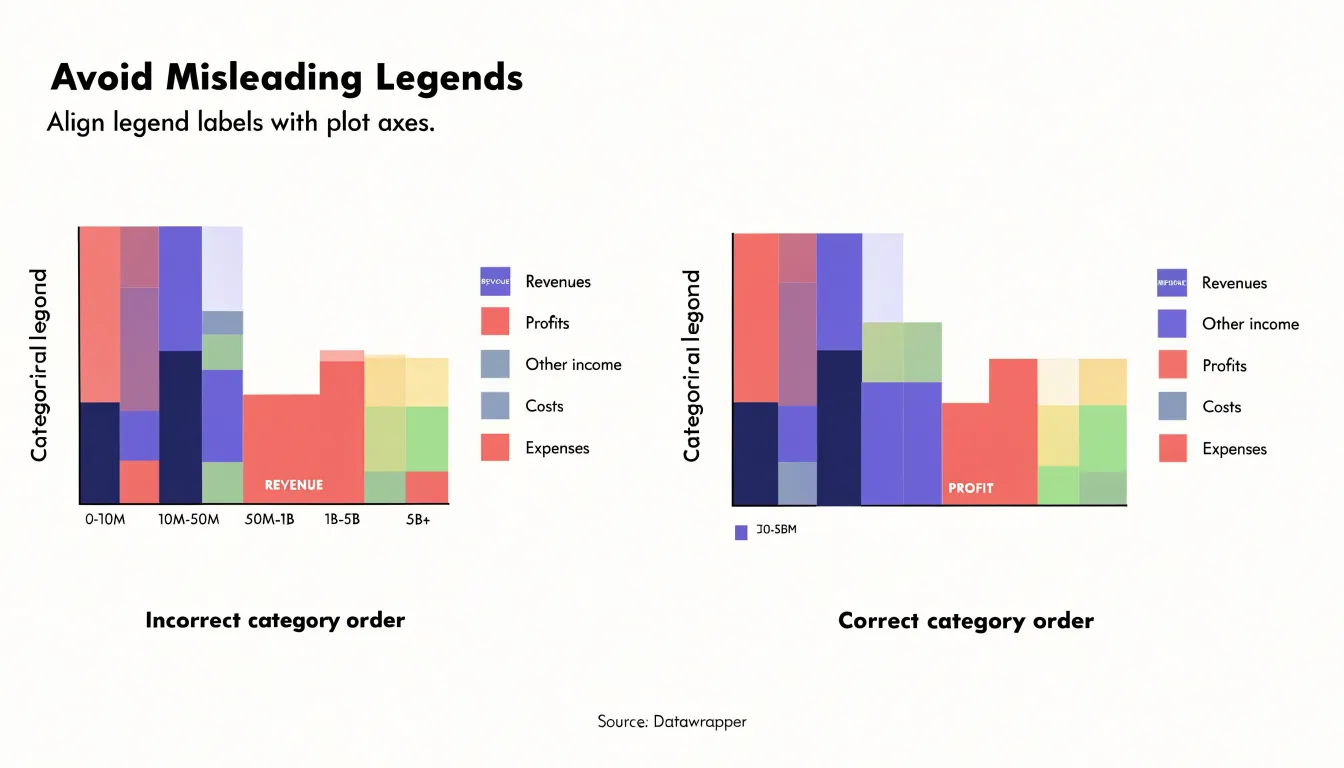
- Misleading color orders: If a legend lists categories in an order that does not match their visual prominence, their natural sequence, or their order along an axis, readers carry a false mental model into the chart. A gradient legend whose color stops run in a different direction from the underlying values, or a categorical legend whose entries are shuffled relative to the x-axis, invites misreading. Order legend entries to mirror the data’s logical structure, such as ascending values or left-to-right series placement.
- Redundant entries: A legend that repeats a category already labeled on the chart, or includes a series that appears only once and is directly annotated, adds clutter without adding information. Remove duplicates and directly label single-occurrence series to keep the legend lean and make the remaining entries faster to scan.
Dashboard Overview
When a reporting system contains a dozen or more visuals, each one carries its own legend decisions: which font, which swatch shape, how much spacing between entries, whether labels sit beside the marks or above them, and where the legend block is anchored relative to the plot. Left to individual choice, these decisions multiply into visual noise. Standardizing them turns a crowded dashboard into a coherent system a reader can scan without re-learning the rules at every chart.
Unified formatting begins with typography, key styles, and color:
- Typography: Apply a single font family and size for legend labels everywhere so the eye does not have to adjust between visuals.
- Key styles: Use a shared swatch, line sample, or symbol across charts; if one chart uses filled circles and another uses small squares for the same category, the reader has to translate.
- Color assignments: Map the same category to the same hue in every visual where it appears.
Placement is the other half of consistency. Fixing legend position across charts, typically in a predictable corner or along a shared margin, creates a stable visual rhythm so the reader never has to hunt for the key. Where dashboards share a common set of dimensions, a single shared legend can replace many repeated ones, freeing space and reinforcing that all the visuals describe the same underlying data.
Frequently Asked Questions
Should every chart have a legend?
No. A legend earns its place by resolving ambiguity; skip it when every mark belongs to one series or the encoding is self-explanatory through in-place labels. If removing the legend leaves no reader question unanswered, leave it out.
Where should a chart legend be placed?
Top and right positions keep the legend outside the plotting region while staying close enough to support back-and-forth reading between the key and the marks. A top horizontal legend follows Western scanning, while a right-side legend works for side-by-side arrangements.
How do you write concise legend labels?
Start by identifying the single concept each entry needs to convey, then remove redundant category words, drop prepositions and articles, and standardize grammatical form across entries. Avoid obscure jargon or invented acronyms, and test whether the label is still intelligible to a reader who has not read the article body.
What are common chart legend mistakes?
Common traps are distant positioning, misleading color orders, and redundant entries. Keep the legend within comfortable scanning distance, order entries to mirror the data’s logical structure, and remove duplicates or directly label single-occurrence series.
How can chart legends be made accessible?
Legend text, swatches, and backgrounds should meet recognized WCAG contrast ratios, pale swatches should have borders, and each legend label should be associated with its series so screen readers announce something meaningful. Keyboard focus should reach interactive legend entries, and pattern fills can add a second visual channel for readers with color vision deficiencies.
How should chart legends work on mobile?
Use responsive wrapping, scrolling, or collapsing—often combined—so the legend adapts to scarce horizontal space without squeezing the plot. Adjust touch target sizes, font scaling, and item spacing, and test portrait and landscape orientations to confirm the legend remains legible without crowding the visualization.
Tony Astor
Tony writes about data visualization and the tools people use to build charts and dashboards. More about Data Illustrator