Chart Labels: Best Practices for Clear Data Labels
 By Tony Astor ·

Chart Labels
Chart labels should use sans-serif fonts at 10–12 points, positioned directly beside data with at least 4.5:1 color contrast, and formatted with abbreviated units like 1.28M. Place labels consistently—at bar ends or line endpoints—keep text horizontal, remove redundant gridlines, and label series directly to eliminate legends and reduce cognitive load.
Table of Contents
Formatting Essentials
Typography choices directly affect how quickly and comfortably a reader can absorb chart information. Sans-serif typefaces such as Helvetica, Arial, Roboto, and Open Sans tend to perform well on digital screens because their uniform stroke widths and absence of decorative serifs remain distinct at smaller sizes. When a chart must match a publication or brand style guide, serif and display faces can still work, provided the weight is sturdy enough to survive rendering at reduced dimensions. Font weight matters alongside family: a medium or semibold cut often reads more clearly in labels than a thin or light variant, which can fade into the background or break apart on lower-resolution displays.
As a working guideline, chart labels should sit between 10 and 12 points for body-level annotations, with axis labels at the lower end of that range and titles or callouts at 14 points or above. Adjust the size in relation to the overall chart dimensions and expected viewing distance. A label that looks generous on a desktop monitor may become unreadable when embedded in a report, viewed on a phone, or projected across a room. Testing the finished chart at its smallest anticipated display size is a practical way to confirm legibility before publishing.
Slightly open tracking helps small caps and all-caps labels avoid crowding, while consistent kerning prevents awkward gaps between letter pairs. Set line spacing so multi-line labels do not merge into a dense block. Together these spacing details keep label text crisp and let readers scan axis values and annotations without strain.
Strategic Placement
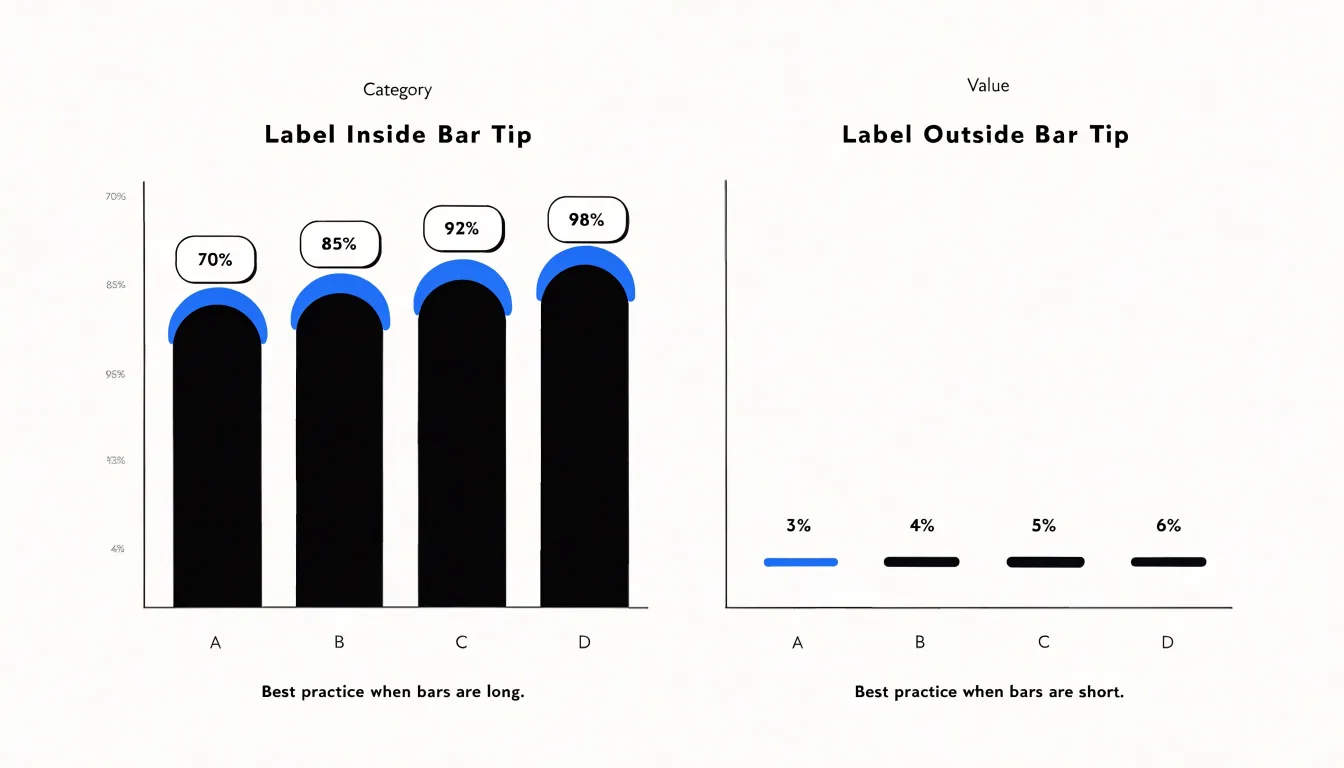
In bar charts, place labels directly at the end of each bar, either inside the bar near its tip or just outside it. Inside labels work well for long bars, while outside labels suit short bars where space is tight. Keep labels horizontal, even for vertical bars, to maintain readability. For grouped or stacked bars, align labels consistently—typically centered within each segment for stacked bars, and at the end of each bar for grouped bars. Avoid placing labels in the middle of bars, which interrupts the visual flow from the axis to the bar’s end.
In line charts, position labels near the end of each line, slightly offset above or below to avoid overlapping the line itself. When multiple lines converge, use callout lines or place labels at the last data point with enough spacing to prevent collision. For lines that cross frequently, consider labeling only at the start and end, or use interactive labels that appear on hover so the reader can follow each line’s trajectory unobstructed.
Pie charts require labels placed outside the slices with leader lines connecting label to slice, especially for small slices. For larger slices, labels can sit inside if the slice is wide enough to accommodate text without crowding. Keep labels horizontal and aligned radially, and avoid placing them directly on top of slice boundaries.
Across all chart types, consistent placement reduces cognitive load, guiding the eye from axis to data point to value. Test placements with real data to prevent overlaps, and adjust font size or position as needed.
Color Contrast
Color contrast determines whether a chart label can be read at a glance or disappears into the marks behind it. The Web Content Accessibility Guidelines (WCAG) recommend a contrast ratio of at least 4.5:1 between normal-sized text and its background; for large text—18 points or larger, or 14 points when bold—a ratio of 3:1 is acceptable. These numbers translate directly into chart design, where labels frequently sit on top of bars, slices, or filled regions whose shades vary from element to element.
Because a single text color rarely works everywhere, evaluate the shade behind each label and choose dark or light text accordingly. A common approach is to compute the relative luminance of the background fill and switch to white text when the fill is sufficiently dark and to near-black text when the fill is light. A mid-tone threshold around a luminance value of 0.5 provides a reasonable starting point, though you should verify the resulting pairs against the 4.5:1 ratio rather than trusting the threshold alone.
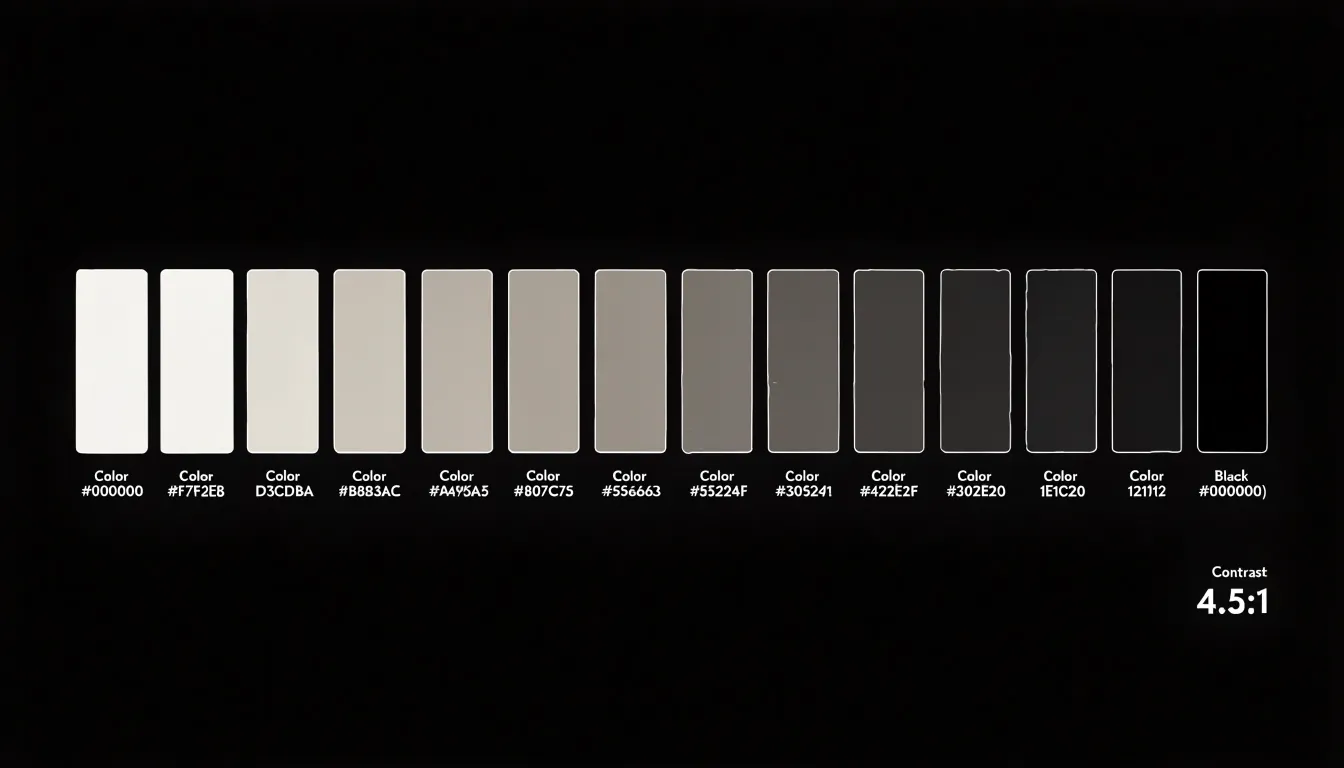
This technique keeps labels legible without adding outlines, shadows, or heavy backgrounds. It also scales across data-driven color scales: as the fill color shifts from pale to saturated, the label color flips where contrast would otherwise fail. Automated checks during rendering can flag any label falling below the guideline, catching edge cases such as intermediate shades or semi-transparent fills.
Decluttering Visuals
Heavy gridlines, border frames, and repeated unit symbols compete with data for attention. Pruning these redundant elements focuses attention on the data itself.
- Gridlines: Many default chart styles include thick, dark gridlines that dominate the background. Lighten them to a pale gray or remove them entirely if data points are clearly labeled or if the axes alone provide sufficient reference.
- Border frames: Frames around the chart area add visual weight without adding information. Remove the border, or reduce it to a thin, light line to open up the chart.
- Repeated unit symbols: Placing
%after every number or$on each tick creates visual repetition. Place the unit once in the axis title or in a single label to make the numbers more readable. - Other elements: Unnecessary tick marks, excessive data labels, and background shading should earn their place by aiding interpretation; otherwise, prune them.
Scale Alignment
Scale alignment ensures that every label sits in a position corresponding exactly to the value it represents, so the distance between a data point and its label reflects the same proportion as the distance between their underlying numbers. When a label drifts from its true position, the eye reads the offset as meaning: a value label hovering slightly above a bar’s true height suggests a larger quantity, while a label pushed below its point implies a smaller one. These small misalignments accumulate until the visual impression no longer matches the data.
A common source of distortion is inconsistent spacing between tick marks and gridlines. If gridlines are evenly spaced but the underlying scale is logarithmic, or if axis intervals are labeled at irregular values, labels anchored to the grid will misrepresent the data. Instead, anchor labels to the actual coordinate system: compute label positions from the same scale function used to plot the points, and let gridlines follow those computed positions rather than a fixed pixel rhythm.
Baseline handling matters as well. Bars should originate from a shared, clearly marked zero line, with end labels aligned to the bar’s terminating edge rather than a generic margin. For line charts, attach callouts to the plotted vertex with a short leader line, keeping the text legible without implying a higher or lower value. When several series share an axis, avoid label collisions while preserving each label’s vertical alignment with its point. A useful verification step is to overlay a few known values and confirm that their rendered positions match hand-calculated coordinates.
Direct Labeling
Direct labeling places each category name right beside the data it describes—typically at the end of a line or just above a bar—so the reader can identify a series in a single glance. When a chart relies on a separate legend, the reader must find the color or marker in the legend, hold it in memory, and travel back to the plotted data to match it. Eye-tracking research on chart reading shows that legends generate a substantial share of fixations simply moving back and forth between the key and the plot.
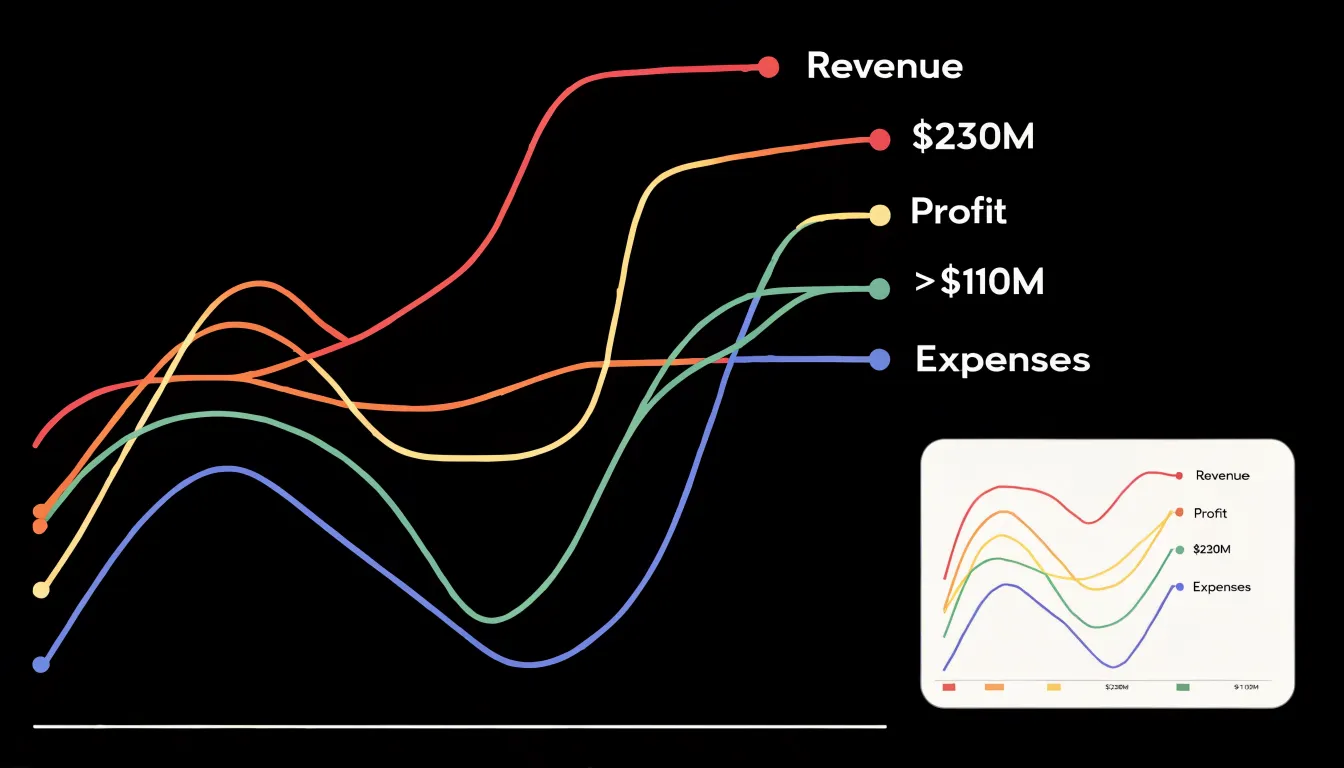
Direct labeling removes that travel because the category name sits where the reader is already looking. In line charts, a label at the end of each line lets readers scan the right edge to grasp what every line represents before tracing its path. The benefit compounds as series grow: a reader can learn two or three colors in a few seconds, but memorizing six or eight becomes a cognitive burden requiring repeated lookups.
The technique also reduces errors. Color matching is error-prone, particularly for readers with color vision deficiencies or on charts using similar hues. A text label adjacent to the data is unambiguous regardless of color perception. Place labels with enough space to avoid overlapping, align them along a common edge, and remove the legend once every series is labeled directly.
Number Formatting
Large numbers slow readers down. A label reading 1,284,763 forces the eye to count digits before the magnitude becomes clear, whereas 1.28M registers almost instantly.
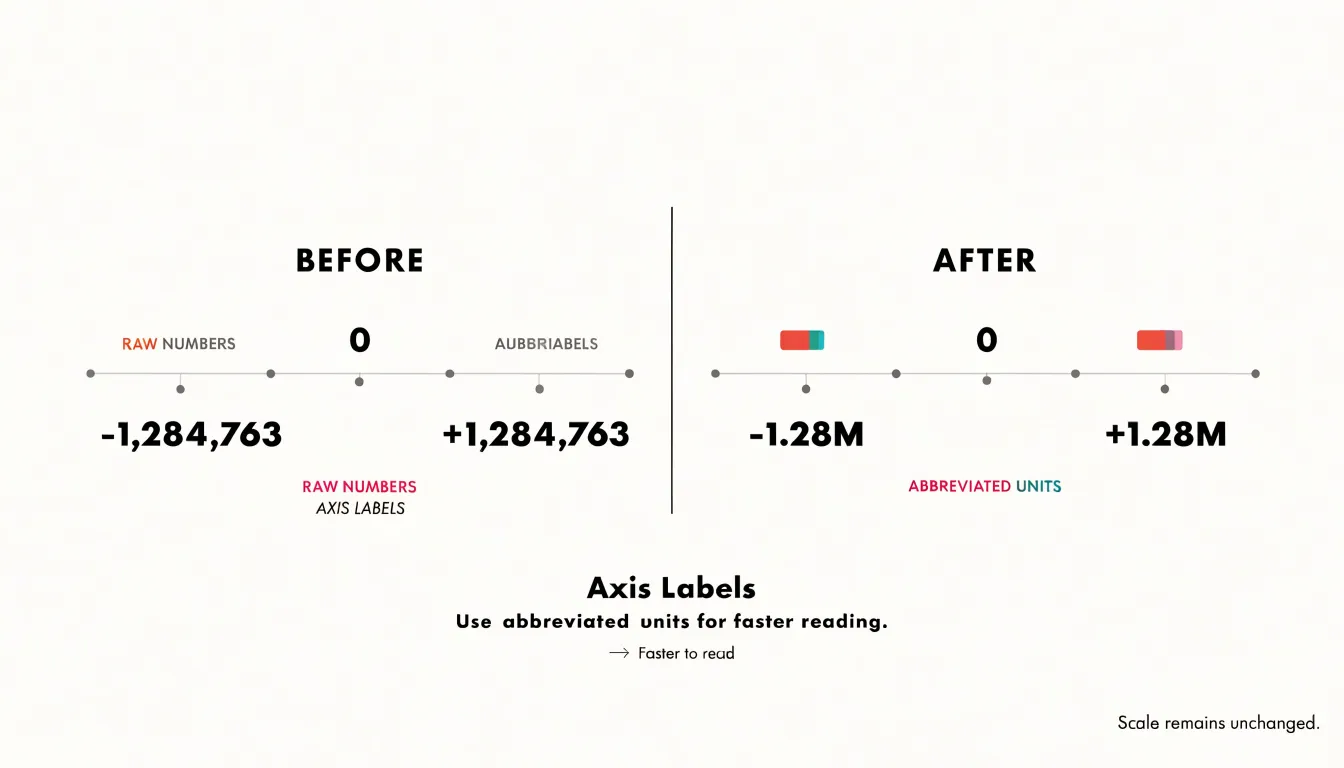
Establish a consistent threshold for each unit: convert thousands to K, millions to M, and so on. Apply the same rule to every label so the axis reads as a coherent scale. Two significant digits suit most charts, and three is generous; anything beyond that adds characters without meaning, as a label like 1.2847M implies a precision the underlying data rarely supports.
Whole numbers scan fastest, so prefer 2M over 2.0M and 450K over 450.0K. When a decimal genuinely helps, keep it to one place, such as 1.5M or 2.3K, and drop trailing zeros that communicate false precision. If one tick reads 1.5M, its neighbors should share the same unit and decimal treatment for easy comparison. Where space is tight, place the unit in the axis title—such as “Revenue ($M)“—and print bare numbers on the ticks.
Axis Titles
An axis header tells the reader what the numbers represent, in which unit, and over what range of conditions. Two or three words naming the quantity and its unit in parentheses are usually enough: “Revenue (USD)” or “Temperature (°C)” conveys more than “The total revenue generated by the company measured in US dollars” without crowding the plot area. Where a unit is long, use abbreviations that are widely recognized in the audience’s field. Directional phrases such as “per month” or “per capita” belong in the title when they clarify a rate rather than a total.
Some charts need no axis title at all. When a category axis shows months of the year or country names, a header reading “Month” or “Country” is redundant. If a first-time reader would hesitate without the label, include it; if the scale and context make the quantity unmistakable, leave it out. A useful review habit is to read each axis title aloud alongside the chart question it is meant to answer.
Angle Adjustments
Horizontal text keeps labels readable at a glance because readers process words along the same left-to-right line they use on the rest of the page. Tilted, diagonal, or vertical text forces readers to pause and reorient their gaze, making short labels harder to distinguish when letters stack or slant. Upright orientation also supports accessibility for low-vision readers and assistive technologies.
When category labels run long, a layout change is better than rotation. A horizontal bar chart places categories along the vertical axis where labels read naturally from left to right, giving long names room without crowding or truncation while preserving direct magnitude comparisons. Other options include abbreviating labels with a clear legend, wrapping text onto two lines, or increasing chart margins so full-length labels fit. Treat angle adjustments as a last resort, applied only when no layout alternative exists and kept to small tilts.
Responsive Design
On a handheld viewport, the plotting area shrinks and desktop-sized labels quickly become crowded. Express label sizes relative to the chart’s width or height using relative units, then clamp those values between sensible minimums and maximums so text never becomes microscopic or overwhelming. Many charting libraries expose viewport change events that recalculate these sizes on rotation or resize.
Progressively drop the least important information as the viewport narrows: show every tick on a wide screen, thin them to every other tick on a tablet, and display only the first, middle, and last values on a phone. Secondary annotations such as value labels on individual bars can hide behind a tap interaction, revealed only when the user selects a data point.
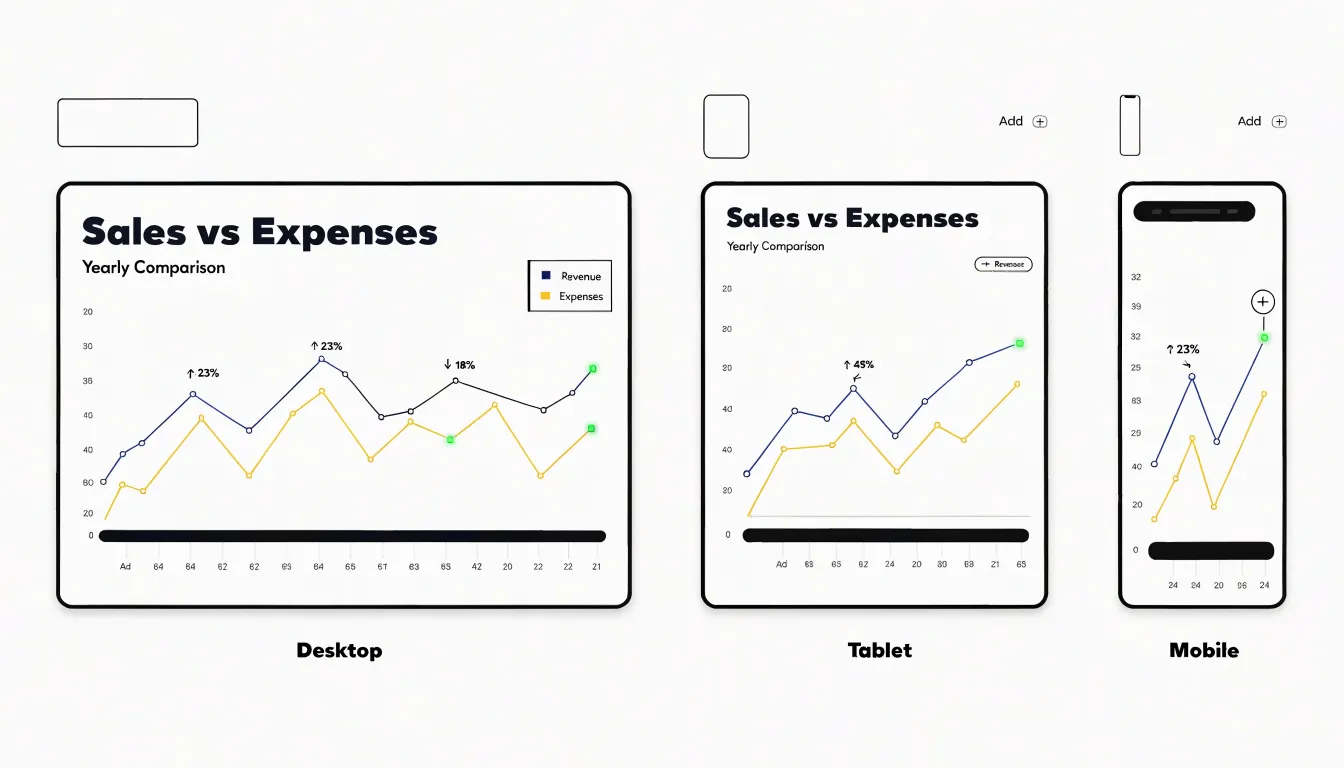
Adapt the overall layout as well. Legends that float beside a desktop chart can move below the plot or collapse into a toggle on small screens, and margins can be trimmed to reclaim horizontal space. Testing across a range of real device widths, rather than a single emulated viewport, surfaces the breakpoints where these adjustments should kick in.
Highlight Techniques
Selective bolding, callout badges, and high-contrast accent colors create visual hierarchy to guide the viewer’s eye to key insights:
- Selective bolding: Apply a heavier font weight only to the labels of peak values or critical anomalies, such as the highest-performing month in a sales line chart, so they contrast with surrounding lighter text.
- Callout badges: Place small circular or rectangular markers containing a number, icon, or short message like “Record high” or “Outlier” near a peak. Their distinct shape and contrasting fill help them stand out in dense charts.
- High-contrast accent colors: Use a bright color, such as orange on a muted blue background, sparingly—for instance, only on the top and bottom values—to create an instant visual anchor without diluting its impact.
Truncation Rules
To manage long category names, define a maximum character or pixel width for any single label and apply it consistently across the axis. When a category exceeds that width, truncate it with a single ellipsis at the end, preserving the beginning of the name where readers focus first. Avoid stacking multiple ellipses or clipping text mid-glyph.
For labels with natural word boundaries, hyphenated compounds, or multi-word names, wrap the phrase onto a second line at a sensible space rather than cutting it. Limit wrapping to two lines so axis height stays predictable, and align wrapped text consistently.
Whenever a label is shortened, surface the full category name in a hover tooltip or interactive detail view. Because hover may not exist on mobile devices or for screen readers, pair the tooltip with an accessible description or expandable label. Reserve truncation for the longest names, tuning the threshold with real data.
Tooltip Integration
Interactive tooltips move detailed metrics into hover states so the static chart remains focused on overall patterns and comparisons. When a reader moves a cursor over a data point, segment, or bar, a tooltip reveals the exact figure, category label, percentage changes, or complex sub-data—such as regional or time-series breakdowns—that would never fit on the chart surface. This layering works especially well for dense visualizations like scatter plots, heatmaps, and stacked charts, serving both quick scanning and careful inspection.
Accessibility Standards
Roughly one in twelve men and one in two hundred women experience some form of color vision deficiency, so charts cannot rely on color alone to distinguish categories. Combine three layers of protection:
- Secondary visual channels: Add textural patterns such as hatching, dots, diagonal stripes, or crosshatching so viewers can separate series even when hues look similar.
- Direct text indicators: Label lines and segments directly so readers do not need to match legend colors to chart marks.
- Colorblind-safe palettes: Choose palettes built around differences in lightness as well as hue, such as variations of blue and orange, which remain distinguishable under common red-green deficiencies. Convert the palette to grayscale or run it through a simulation tool to confirm adjacent categories stay visually separate.
Consistency Checks
When a dashboard presents dozens of charts, small discrepancies in formatting compound into an impression of carelessness. Audit every collection of charts against a simple checklist:
- Capitalization: Decide between title case (“Monthly Revenue”) and sentence case (“monthly revenue”) for titles, axis labels, legends, and annotations, and apply the rule uniformly.
- Metric abbreviations and units: Standardize conventions so charts do not alternate between “Revenue ($M)” and “Revenue (Millions)”, or “Avg.” and “Average.” Maintain a reference sheet of approved abbreviations to prevent unit errors where one chart reports thousands and another reports millions without clear indication.
- Alignment and positioning: Share a consistent axis label orientation, grid logic for tick marks, and predictable legend position (usually top or bottom) across all charts so the eye knows where to look without scanning.
Frequently Asked Questions
What font size should I use for chart labels?
Chart labels should generally sit between 10 and 12 points for body-level annotations, with axis labels at the lower end of that range and titles or callouts at 14 points or above. Adjust the size in relation to the overall chart dimensions and expected viewing distance, and test the finished chart at its smallest anticipated display size to confirm legibility.
Where should labels go on a bar chart?
In bar charts, place labels directly at the end of each bar, either inside the bar near its tip or just outside it; inside labels work well for long bars, while outside labels suit short bars. Keep labels horizontal and avoid placing them in the middle of bars. For grouped or stacked bars, align labels consistently—typically centered within each segment for stacked bars and at the end of each bar for grouped bars.
What contrast ratio do chart labels need to meet WCAG?
WCAG recommends a contrast ratio of at least 4.5:1 between normal-sized text and its background; for large text—18 points or larger, or 14 points when bold—a ratio of 3:1 is acceptable. Evaluate the shade behind each label and choose dark or light text accordingly, then verify the pairs against the 4.5:1 ratio rather than trusting a luminance threshold alone.
Why use direct labels instead of a legend?
Direct labeling places each category name right beside the data it describes—typically at the end of a line or just above a bar—so readers can identify a series in a single glance. It removes the back-and-forth travel between a legend and the plot and reduces error-prone color matching, especially for readers with color vision deficiencies or similar hues. Remove the legend once every series is labeled directly.
How should I format large numbers on chart labels?
Establish a consistent threshold for each unit—convert thousands to K, millions to M, and so on—and apply the same rule to every label. Two significant digits suit most charts, and whole numbers scan fastest, so prefer 2M over 2.0M and 450K over 450.0K. If one tick uses a decimal, its neighbors should share the same unit and decimal treatment for easy comparison.
How can I keep chart labels readable on mobile?
Express label sizes relative to the chart’s width or height using relative units, then clamp those values between sensible minimums and maximums so text never becomes microscopic or overwhelming. As the viewport narrows, progressively drop the least important information—for example, show every other tick on a tablet and only the first, middle, and last values on a phone—and hide secondary annotations behind a tap interaction. Legends that float beside a desktop chart can move below the plot or collapse into a toggle on small screens, and margins can be trimmed to reclaim horizontal space.
Tony Astor
Tony writes about data visualization and the tools people use to build charts and dashboards. More about Data Illustrator