Cartogram: Maps Resized by Data
 By Tony Astor ·

Cartogram
A cartogram is a map in which the size of each region is scaled proportionally to a data value—such as population, GDP, or electoral votes—rather than its geographic land area. Algorithms redistribute map space while preserving rough position and contiguity, so dense or high-value regions expand and sparse ones shrink, revealing patterns hidden by conventional maps.
Table of Contents
- Cartogram Basics
- Population Cartograms
- Wealth Cartograms
- Electoral Cartograms
- Continuous Cartograms
- Non-Continuous Cartograms
- Dorling Cartograms
- Demers Cartograms
- Health Cartograms
- Energy Cartograms
- Internet Cartograms
- Environmental Cartograms
- Data Sources and Tools
- Design Pitfalls
- Dashboard Overview
Cartogram Basics
Standard choropleth maps color each region according to a data value while leaving geographic boundaries fixed. The result is a visual argument that is only partly true. A large, sparsely populated rural district occupies a vast swath of the page while a densely packed urban constituency shrinks to a sliver, even when the urban area contains many times the population. Because human perception equates visual area with importance, the map quietly tells viewers that empty land matters more than the people living on it. Countries such as Russia or Canada dominate a population map through sheer territorial extent, while nations with hundreds of millions of residents can appear negligible. Choropleth maps therefore encode two variables at once—the data value and the land area—and the land area often wins the viewer’s attention.
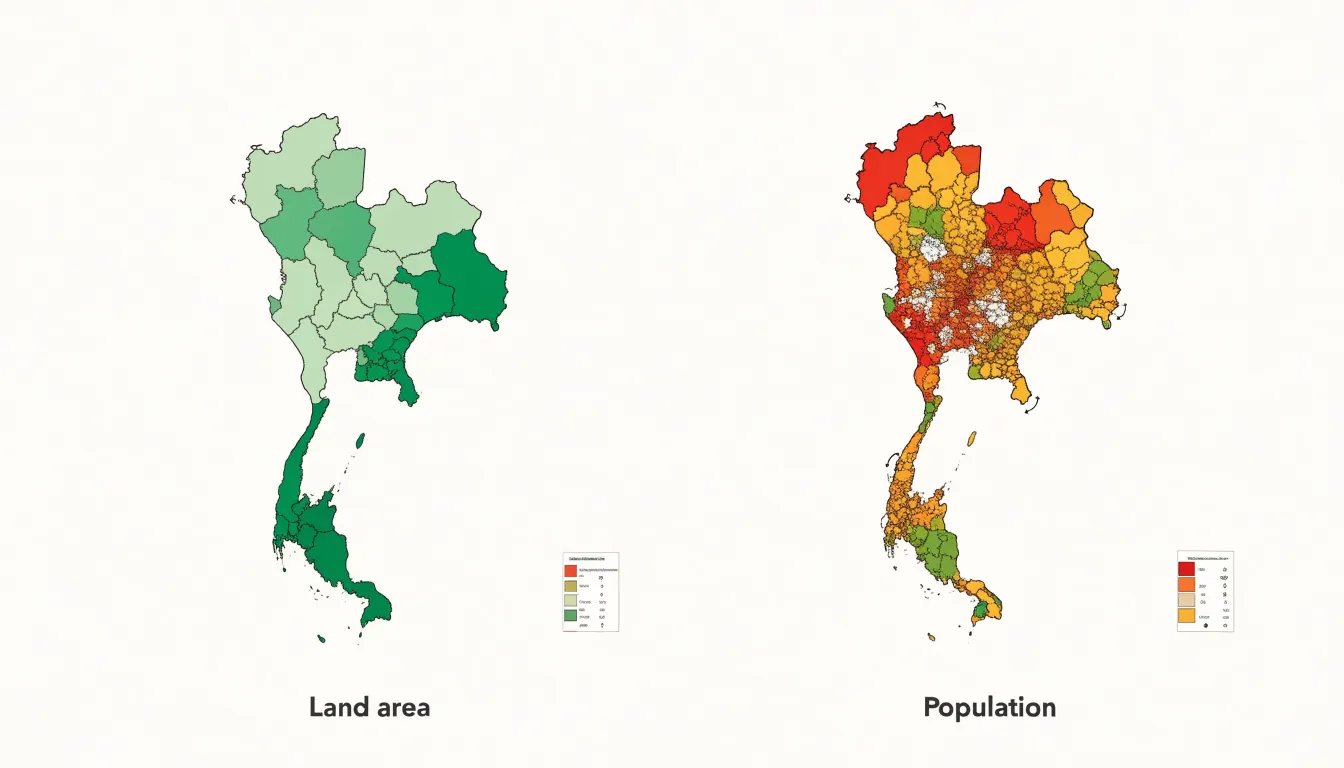
Cartograms resolve this bias by making the size of each region proportional to a chosen data variable rather than its geographic footprint. An algorithm redistributes the available map space among regions so that each receives an area proportional to its value, whether population, electoral votes, GDP, or another metric. Geographic contiguity and rough relative position are preserved, so the resulting graphic remains recognizable as a map rather than dissolving into an abstract chart.
The consequences for interpretation are substantial. Once area itself carries the data, viewers no longer need to mentally discount large, empty regions, and hidden patterns become immediately visible. Densities of population, concentrations of economic output, and disparities in representation appear at their true relative scale, aligning what viewers see with what the numbers say.
Population Cartograms
Population cartograms redraw the map so that each region’s area corresponds to its number of inhabitants. In a global population cartogram, China and India swell to occupy large shares of the canvas, while vast territories like Russia, Canada, and Australia contract into modest shapes. Readers accustomed to conventional maps discover that densely settled regions of South and East Asia, Europe, and parts of Africa dominate the visual field, while sparsely inhabited expanses fade into slivers.
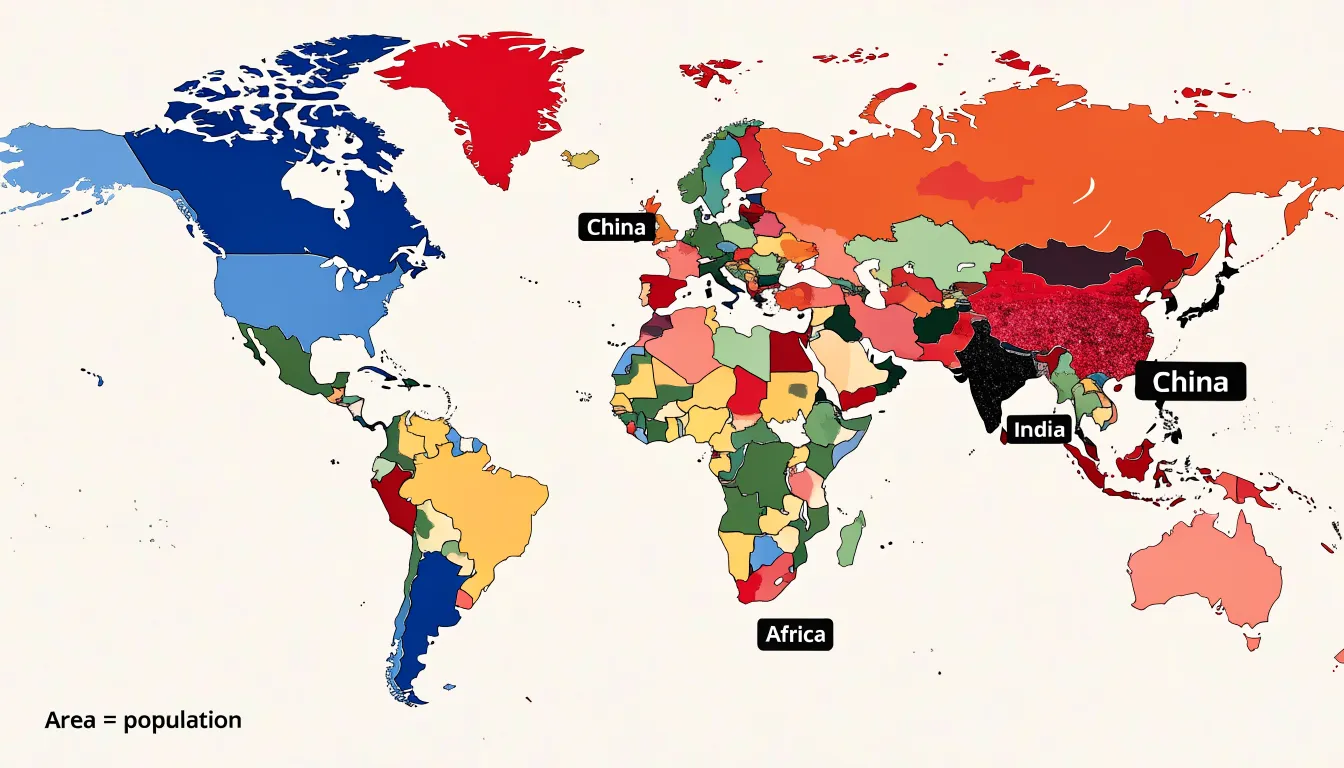
The technique works at national scales as well. A population cartogram of the United States stretches the densely populated Northeast corridor and coastal metropolitan areas into prominent blocks while compressing the interior West into narrow strips. In the United Kingdom, Greater London expands dramatically relative to the Scottish Highlands, while in Egypt or Indonesia, populations cluster tightly along rivers, deltas, and favored islands. Each example shows that people concentrate in a small fraction of the land surface.
Planners, demographers, and journalists use these maps to frame discussions of electoral weight, resource allocation, public health coverage, and infrastructure investment, since each of those domains follows population rather than acreage.
Wealth Cartograms
A wealth cartogram reconfigures the map according to economic output, resizing each country in proportion to its gross domestic product (GDP). Territory reflects financial weight, making economic inequality immediately visible.
When global GDP is the governing variable, high-income nations swell dramatically. The United States, Japan, and the major economies of Western Europe occupy far more space than their physical borders suggest, drawing attention to the concentration of wealth in the global North. Meanwhile, low-income regions across sub-Saharan Africa, parts of South Asia, and Central America shrink to fractions of their true territorial size, underscoring how little economic output they represent relative to their landmass and populations.
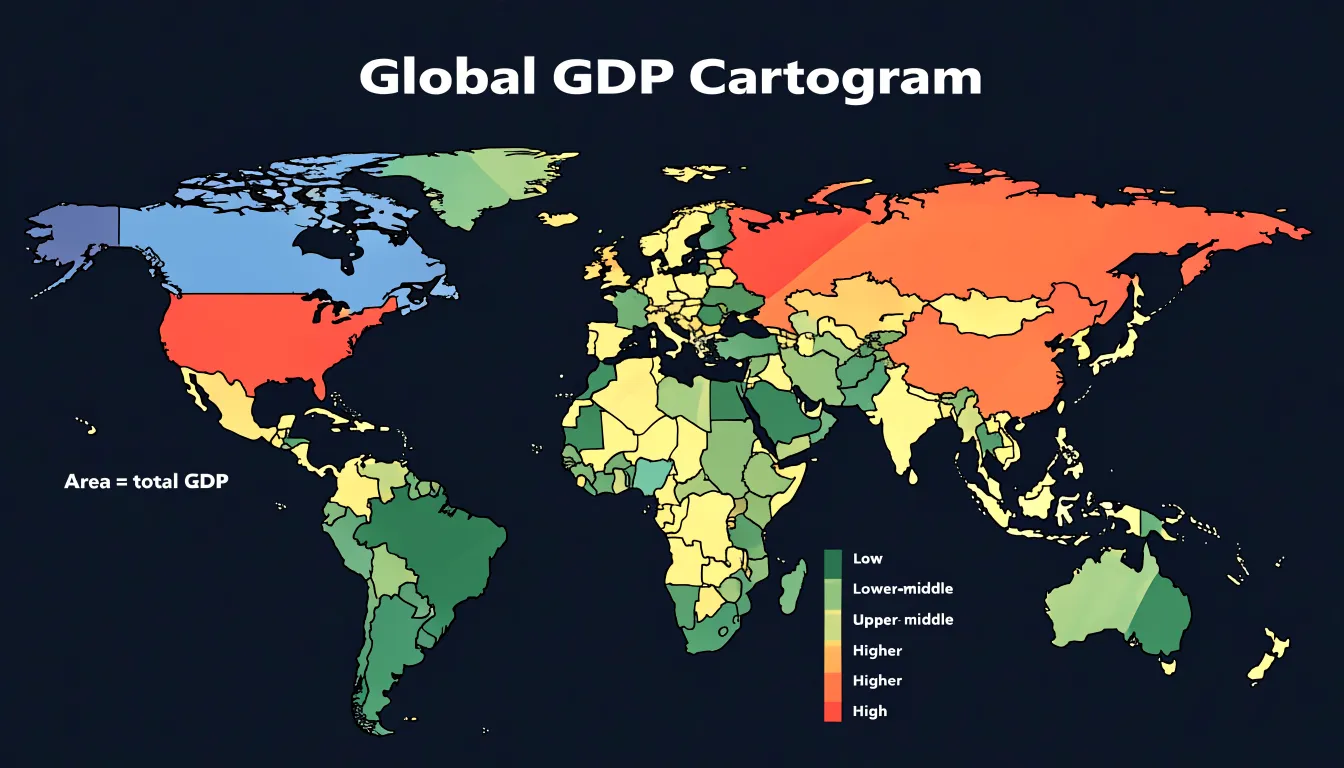
The transformation extends to regional comparisons. Within Europe, the contrast between prosperous economies and smaller or less wealthy neighbors becomes vivid. In Asia, the expanded footprint of export-driven economies stands beside the compressed outlines of poorer nations. By trading land for economic magnitude, the map exposes the uneven terrain of the global economy.
Electoral Cartograms
Standard election maps color districts or states according to the winning candidate, yet those shapes reflect land area rather than voters or seats at stake. Electoral cartograms correct this imbalance by resizing each geographic unit in proportion to its electoral weight—whether measured in Electoral College votes, parliamentary seats, or total votes cast. Analysts use these maps to compare the visual footprint of each party against its actual share of power.
In United States presidential elections, a cartogram can rescale each state according to its Electoral College votes. The result shows candidates’ coalitions in terms of the votes that decide the outcome, making the relative importance of large, lightly populated states versus dense urban states immediately apparent. In parliamentary systems, constituencies can be redrawn proportional to seat count or electorate, showing which parties command the chamber rather than which cover the most territory. At finer scales, analysts resize wards or precincts to reflect turnout and population density, identifying where marginal seats cluster and where campaigning resources might be most effectively deployed.
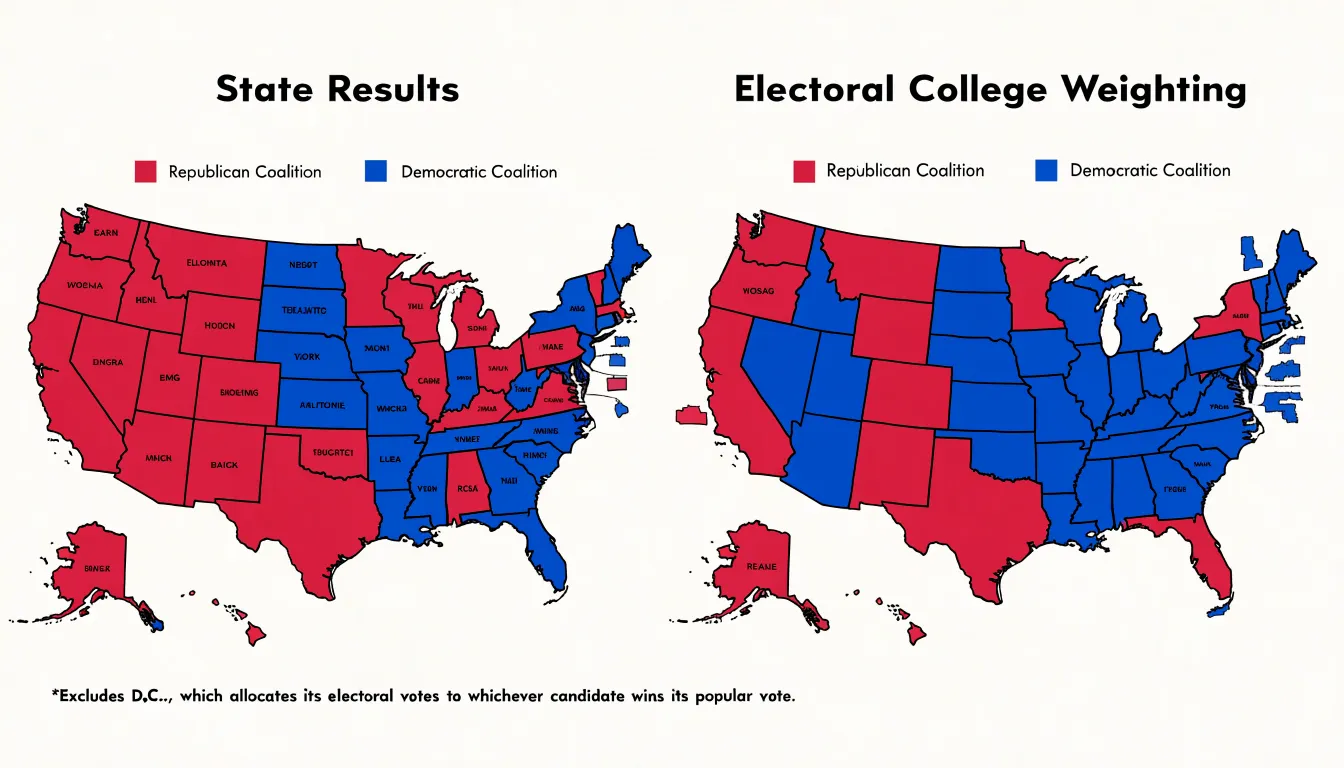
Because the transformed shapes remain recognizable, electoral cartograms are valuable for explaining results to general audiences and highlighting disparities between popular support and representational outcomes.
Continuous Cartograms
A continuous cartogram treats the map as a single elastic surface rather than a collection of independently resized shapes. Every point on the plane can move, so internal land boundaries stretch and bend along with the regions they separate. The essential constraint is topological: two regions that share a border before the transformation must still share a border afterward, and regions that touch at a point or along a line must continue to do so. Islands stay detached, enclaves remain enclosed, and no neighboring pair is torn apart or fused together. This separates the continuous approach from non-contiguous alternatives, which deform each polygon in isolation and can leave gaps or overlaps along shared edges.
The Gastner-Newman method realizes this idea through diffusion. Population or another target variable is treated as a density field laid over the original geography, and the algorithm lets that density diffuse outward until it becomes uniform. The movement of the density carries the underlying geometry with it, relocating the boundary points. Because the diffusion process is smooth and defined everywhere, adjacent regions receive matching displacements along their common borders and remain connected. The result is a dense grid of displacement vectors applied to boundary coordinates, producing curved edges where straight lines once ran.
Rubber-sheet algorithms take a more mechanical route. A set of control points, usually region centroids or other anchor locations, is assigned target positions reflecting the desired area changes. The surrounding space is then warped by an interpolation function—often based on distance-weighted influences or spline surfaces—which behaves like a sheet of rubber stretched and pinned at those anchors. Every boundary vertex is carried along by the same continuous mapping, so shared edges deform identically on both sides. Practitioners tune the interpolation and anchor placement to keep the warp legible while honoring the underlying data.
Non-Continuous Cartograms
Rather than resizing regions in place to keep a connected mosaic, non-continuous cartograms shrink or expand each geographic unit around its own centroid and reposition them so they no longer touch. This deliberate separation allows each region to retain its original shape outline—the familiar silhouette of a country, state, or county—even as its area is scaled to the data.
The cost is the loss of border continuity: neighboring regions no longer share edges, and the map becomes a collection of detached shapes. This trade-off is valuable when using small-scale administrative areas or when data variation is extreme, where continuous cartograms might make regions unrecognizable or create awkward slivers and holes. Non-continuous cartograms avoid these problems by allowing uniform or data-proportional gaps between units, providing visual breathing room to distinguish adjacent regions.
The method is particularly effective for comparing magnitudes across many small units, such as election results by county or population density by district. Because each unit is scaled around its centroid, relative positions are maintained approximately, preserving the overall geographic arrangement while sacrificing exact adjacency.
Dorling Cartograms
Named after creator Danny Dorling, Dorling cartograms replace geographic landmasses with circles whose areas are proportional to a chosen variable, such as population, income, or votes cast. Substituting a circle for each region directs attention to the magnitude of the data rather than territorial expanse, placing dense metropolitan areas and rural districts on equal visual footing.
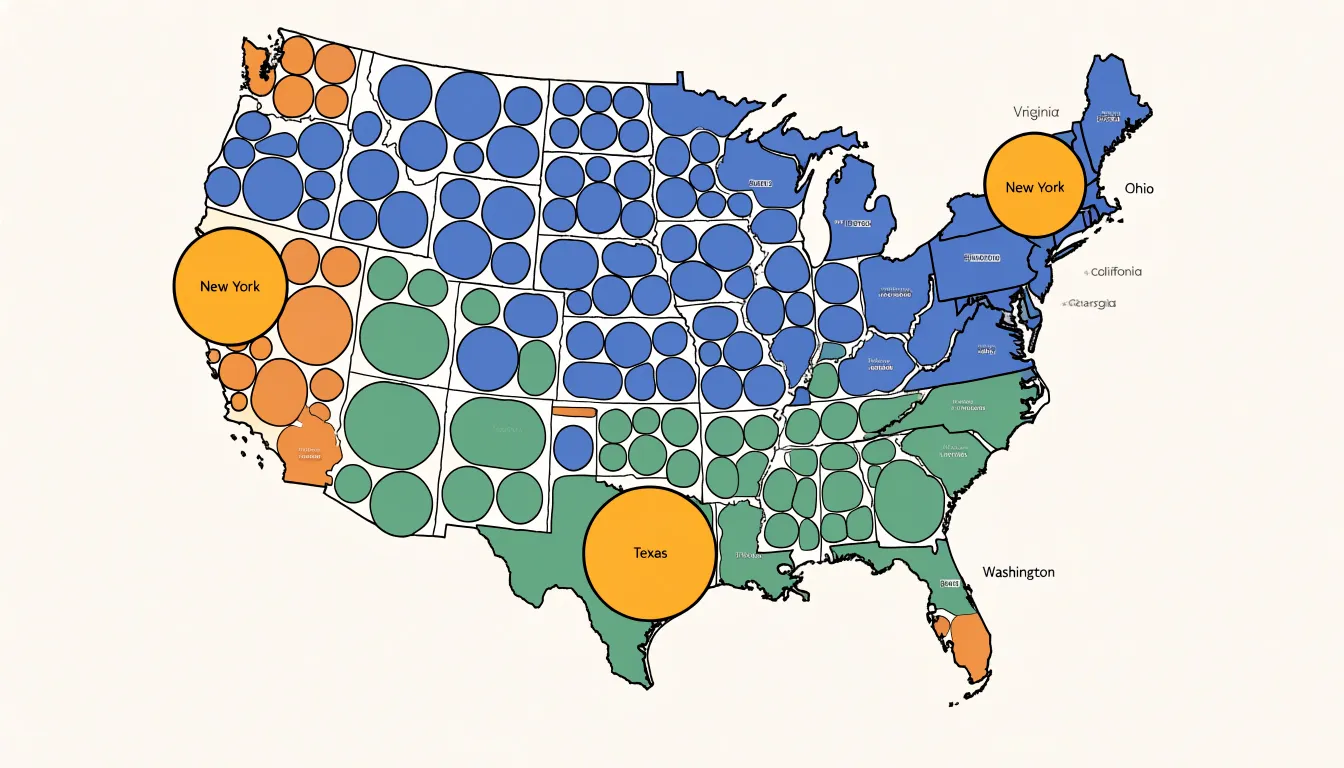
Construction begins by assigning each region a consistently scaled circle based on its data value. These circles are arranged so they do not overlap, with their centers placed as close as possible to the original geographic centroids of the regions they represent. Neighboring regions typically remain near one another, and the general orientation of the study area stays recognizable, even though exact boundaries and shapes are abandoned.
This combination of proportional sizing and approximate positioning makes Dorling cartograms effective for scanning layouts and identifying the largest values. The non-overlapping arrangement prevents the occlusion that occurs when proportional symbols are laid over a conventional map, and the simplified geometry reduces visual clutter, allowing clusters of large circles or regional gradients to emerge clearly.
Demers Cartograms
Demers cartograms use squares instead of circles as the building blocks for proportional symbol maps. Each region is depicted by a square whose area is scaled to a variable, positioned on a regular grid to approximate the region’s geographic location. This grid-based structure reduces visual clutter by eliminating irregular boundaries and varying administrative sizes, providing a consistent visual weight across all regions.
Unlike cartograms based on circles or irregular polygons, using squares can eliminate gaps between shapes. When packed together on a grid, adjacent squares share edges, creating a continuous mosaic that reinforces the sense of a unified territory and avoids a fragmented appearance. Preserving relative spatial order on the grid helps viewers recognize patterns and clusters while benefiting from simplified shapes.
Health Cartograms
Health cartograms let health data reshape the geometry of places, so regions swell or shrink according to the burden of disease, the availability of care, or the reach of a vaccination campaign. In infectious disease surveillance, a country with a small land area or population but a rapidly rising case count expands to dominate the visual field, alerting officials to hotspots that a standard map would render tiny. During outbreaks of measles, cholera, or influenza, this distortion helps epidemiologists and the public see the speed and direction of spread, supporting decisions on where to deploy testing teams, isolation capacity, or vector control.
By scaling each territory to the proportion of its population that has received routine immunizations, a cartogram also exposes gaps between well-covered urban centers and underserved rural districts. The resulting image can guide international donors and health ministries in allocating cold-chain equipment, mobile clinics, and outreach staff. Similarly, when districts are redrawn according to hospital beds per thousand residents, regions facing acute shortages become visually prominent, helping planners prioritize construction, staffing, or temporary field hospitals.
Because the distorted shapes invite curiosity about why a particular area has grown so large, health cartograms are also effective in public health advocacy to build support for resource allocation and policy change.
Energy Cartograms
Energy cartograms resize nations according to how much energy they produce, consume, or waste, letting viewers see at a glance which countries dominate global energy flows. Three common variants dominate the genre:
- Fossil fuel consumption cartograms rescale each country by barrels of oil, cubic metres of gas, or tonnes of coal burned, revealing the disproportionate weight of industrial economies and petro-states.
- Renewable adoption cartograms size nations by installed solar, wind, and hydro capacity, highlighting countries racing ahead in the transition and exposing those lagging behind their pledges.
- Electrical grid capacity cartograms stretch territories according to generation and transmission infrastructure, which often correlates with development levels and investment histories.
Each variant draws on national statistics from agencies such as the International Energy Agency, the U.S. Energy Information Administration, or the World Bank. The choice of metric—total or per capita—dramatically reshapes the picture. Total-usage cartograms emphasise the raw scale of consumption, while per-capita versions surface the intensity of demand in smaller, wealthier nations.
Designers typically pair the distorted geometry with a colour gradient encoding a secondary variable, such as carbon intensity or growth rate, so that size and shade tell a layered story. Energy cartograms work best when accompanied by clear legends, source citations, and a reminder that every projection involves editorial choices about what to measure and how to scale it.
Internet Cartograms
Internet cartograms resize each country in proportion to a digital metric, making patterns of global connectivity and the digital divide visible. A cartogram scaled by active internet users shows India and China swelling to dominate the frame, reflecting their enormous online populations, while many African nations shrink to slivers. Scaled instead by broadband penetration per capita, smaller European and East Asian states expand as wealthy, densely wired nations take up more visual space.
Undersea cable bandwidth capacity offers another lens. Because the global internet backbone runs through a relatively small number of submarine fiber-optic routes, a bandwidth cartogram inflates coastal hubs and major landing points while shrinking landlocked regions that depend on neighbors for transit. This exposes the physical infrastructure beneath the cloud, showing how data flows through chokepoints and corridors. A country that appears large in a bandwidth cartogram commands substantial international capacity, while a shrunken counterpart may rely on limited or expensive links.
Because each metric produces a distinct geography, internet cartograms are most useful when compared side by side. Viewing broadband access, user counts, and cable capacity together reveals where populations are large but connectivity is thin, and where infrastructure concentrates.
Environmental Cartograms
Environmental cartograms illustrate global inequality in resource use and pollution by scaling each country’s territory to variables such as total greenhouse gas emissions, municipal and industrial waste volume, or overall ecological footprint measured in global hectares. China or the United States expands dramatically when sized by annual carbon output, whereas many low-emitting nations in Africa and South Asia contract to thin slivers.
Designers typically use continuous area-scaling algorithms to adjust each polygon while keeping borders recognizable. Some versions combine two variables—for instance, area representing total emissions and color representing per-capita intensity—to reveal the difference between populous nations with high totals and smaller nations with outsized individual footprints.
Waste-focused cartograms highlight economies that generate disproportionate volumes of discarded material, while ecological footprint maps account for consumption of food, timber, land, and energy across the full supply chain. Because these portrayals can reflect consumption as well as production, they can assign responsibility to importing countries whose emissions occur abroad. In journalism, education, and climate advocacy, these maps prompt discussion about equity, historical responsibility, and the distribution of mitigation burdens in international negotiations.
Data Sources and Tools
Building a cartogram begins with sourcing datasets that pair geographic boundaries with a quantitative variable. Public repositories are valuable starting points:
- Worldmapper maintains a library of pre-built cartograms covering topics from energy consumption to public health, offering downloadable data and methodology notes that serve as models for custom projects.
- National statistics offices, open data portals, and international organizations (such as the World Bank) publish tabular data, typically as CSV or spreadsheet files that can be joined to boundary geometries.
On the software side, practitioners have several options depending on their technical background:
- QGIS: This open-source geographic information system supports cartogram creation through dedicated plugins implementing the Gastner-Newman diffusion method and rubber-sheet transformations, allowing users to work interactively with shapefile or GeoPackage layers.
- R: Offers packages including
cartogram, which provides several algorithms with a consistent interface, andsffor handling spatial data. - Python: Provides libraries such as
cartogramorgeopandas-based workflows capable of producing continuous and non-contiguous cartograms. - Standalone and commercial tools: ScapeToad and the ArcGIS Cartography toolbox serve users who want a dedicated application or an established commercial environment.
Design Pitfalls
The deliberate deformation that gives a cartogram its expressive power is also where many designs go wrong. The most common pitfall is excessive distortion: when a variable’s range is very wide, a handful of regions expand so dramatically that they swallow their neighbors, while small regions shrink into unrecognizable slivers. To prevent this, check whether familiar landmarks, coastlines, or borders remain legible after transformation. Designers can moderate the scale by applying a square-root or logarithmic transformation to the variable, or by blending the cartogram with the original map so that shapes shift only partway.
Another frequent error is omitting reference information. Because cartograms discard true area and distance, readers need anchors:
- Add a light outline of the original boundaries as a reference overlay, show graticule lines, or include a small conventional inset map alongside the cartogram.
- Provide a clear legend stating the mapped variable, its units, and that area encodes the variable rather than geographic extent.
- Label a few key regions directly on the map to reduce confusion.
- Choose appropriate colors: sequential palettes work well for magnitude, while categorical hues risk implying differences that the distortion already communicates.
Testing a draft with viewers unfamiliar with the data quickly reveals whether regions remain identifiable and whether the legend carries its explanatory weight.
Dashboard Overview
In executive dashboards, interactive cartograms sit alongside conventional charts and key performance indicators, sizing each region according to metrics like sales volume, population reach, or operational footprint. This draws immediate attention to where activity is concentrated or thin, allowing decision makers to grasp relative magnitude without comparing numbers across a table.
Interactivity turns the cartogram from a static illustration into an exploratory instrument:
- Hovering over a region reveals tooltips with precise underlying figures.
- Clicking through links to detailed reports.
- Switching variables or filtering by time period and business segment reorganizes the shapes around different measures in the moment.
When a distorted map echoes familiar geography, executives recognize their own territories and customers within it, focusing meeting discussions quickly on the regions that have grown or shrunk. Reusing the same visualization conventions across recurring reports—paired with thoughtful color, labeling, and transition animations—makes the cartogram a dependable component of the reporting toolkit.
Frequently Asked Questions
What is a cartogram used for?
A cartogram makes each region’s size proportional to a chosen data variable, such as population, electoral votes, GDP, or another metric, rather than its geographic footprint. This helps reveal patterns like population density, economic output, and representation at their true relative scale.
Why do population cartograms make some countries look bigger?
Population cartograms resize each region according to its number of inhabitants, so densely settled countries and regions expand while sparsely inhabited areas shrink. In a global population cartogram, China and India swell to occupy large shares of the canvas, while Russia, Canada, and Australia contract into modest shapes.
How does a wealth cartogram show global inequality?
A wealth cartogram resizes each country in proportion to its gross domestic product (GDP). High-income nations such as the United States, Japan, and major Western European economies occupy far more space than their physical borders suggest, while low-income regions shrink to fractions of their true territorial size.
What is the difference between a continuous and non-continuous cartogram?
A continuous cartogram treats the map as a single elastic surface, so regions that share a border before the transformation must still share a border afterward. A non-continuous cartogram instead shrinks or expands each unit around its own centroid and repositions units so they no longer touch, sacrificing border continuity.
What is the difference between a Dorling cartogram and a Demers cartogram?
A Dorling cartogram replaces landmasses with circles whose areas are proportional to a chosen variable, arranged so they do not overlap and their centers stay as close as possible to original geographic centroids. A Demers cartogram instead uses proportional squares positioned on a regular grid to approximate each region’s geographic location.
What are common mistakes in cartogram design?
Excessive distortion is a common pitfall, because very wide data ranges can make some regions swallow their neighbors while others shrink into unrecognizable slivers. Designers should check whether landmarks, coastlines, and borders remain legible and can apply square-root or logarithmic transformations, blend with the original map, and include reference information such as legends, labels, and original boundaries.
Tony Astor
Tony writes about data visualization and the tools people use to build charts and dashboards. More about Data Illustrator