Canva vs Visme for Charts and Infographics
 By Tony Astor ·

Canva vs Visme for Charts and Infographics
Canva is better for fast, simple bar, pie, and line charts and template-based infographics, with a generous free tier and drag-and-drop ease. Visme is better for complex, multi-variable and interactive charts, live spreadsheet-linked data, long-form infographic reports, and interactive HTML5 or vector PDF exports.
Table of Contents
Chart Type
Bar, pie, and line charts form the backbone of quick visual reporting, and both Canva and Visme offer straightforward ways to generate them. In Canva, you can start from the Charts element, choose a chart type, and either manually enter data or paste it from a spreadsheet. The interface provides sliders for adjusting elements like bar spacing and corner rounding, giving you control over the chart’s appearance without requiring design expertise. For a simple bar chart comparing quarterly sales, for instance, you can input the numbers, pick a color scheme from Canva’s palette, and drop the chart into a presentation or social media graphic. Pie charts in Canva allow you to toggle labels and percentages, while line charts include options for smoothing lines and adding data points. The process is intuitive and fast, making Canva a solid choice for basic data displays.
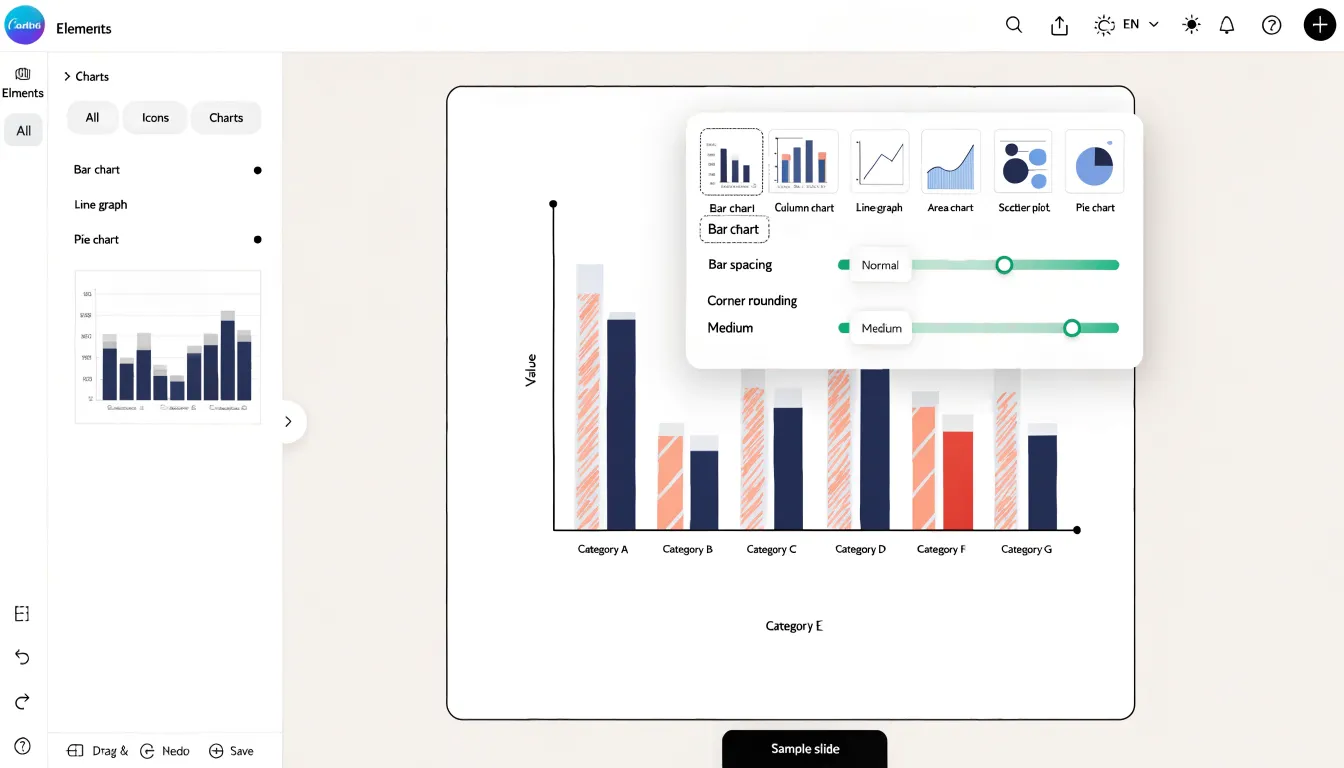
Visme takes a similar approach but adds a layer of data integration. Its chart tool lets you import data directly from Excel or Google Sheets, so your chart updates automatically if the source changes. For standard bar, pie, and line charts, Visme provides templates and customization options such as adjusting axis labels, legends, and data formatting. You can also animate charts to reveal data sequentially, which can be useful for presentations. When creating a pie chart, Visme offers options for donut style and label positioning, while line charts support multiple data series with distinct colors and styles. Both tools handle the essentials well, with Visme offering more advanced data handling and Canva emphasizing speed and design flexibility.
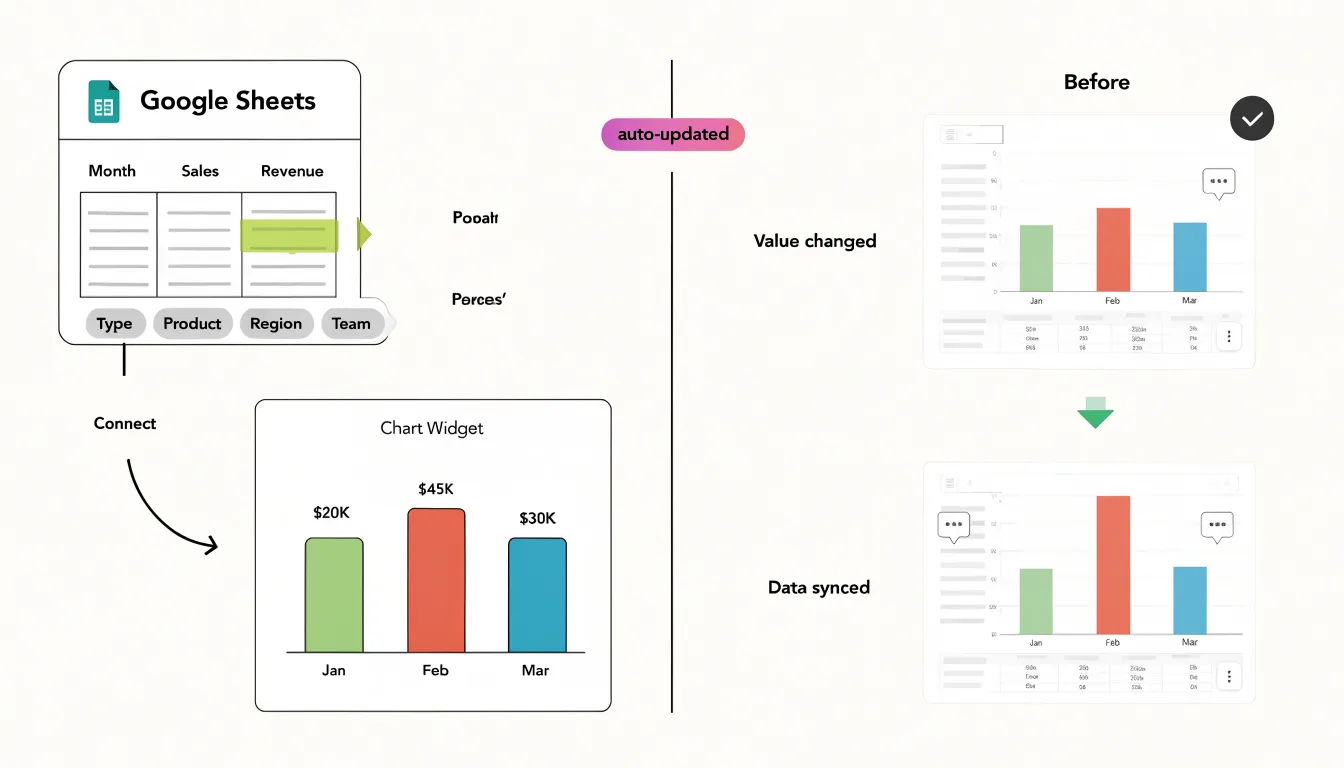
Chart Type
When your data tells a more nuanced story, the range of available chart types becomes a deciding factor. Visme offers a notably deep library of advanced visualizations built for complex, multi-dimensional datasets. Multi-layered funnel charts let you track conversion stages across several concurrent segments, showing where audiences drop off within each pathway. Radar charts plot multiple variables along shared axes, making them ideal for comparing performance profiles, skill sets, or product attributes side by side. Scatter plots allow you to examine correlations and outliers across two variables, and Visme’s interactive layer lets viewers hover over individual points to reveal exact values, filter categories, or animate transitions between data states. These interactive elements carry over into exported and embedded projects, so the charts remain explorable once shared.
Canva approaches charts from a design-first perspective. Its chart library covers the essential formats—including bar, line, pie, and donut charts—which integrate cleanly with Canva’s broader design ecosystem. For many presentations, social posts, and simple reports, these options are entirely sufficient, and the streamlined workflow keeps the focus on aesthetics and speed.
The distinction shows up when the underlying data has layers. Analysts working with survey results, marketing funnels, or scientific measurements often need charts that show relationships between variables rather than a single measure over time. In those cases, Visme’s specialized formats and interactive controls provide a more direct fit, while Canva’s simpler options may require workarounds or supplementary tools. Teams should weigh how often their charts need to handle complex, multi-variable data against how much they value Canva’s design flexibility and ease of use.
Chart Type
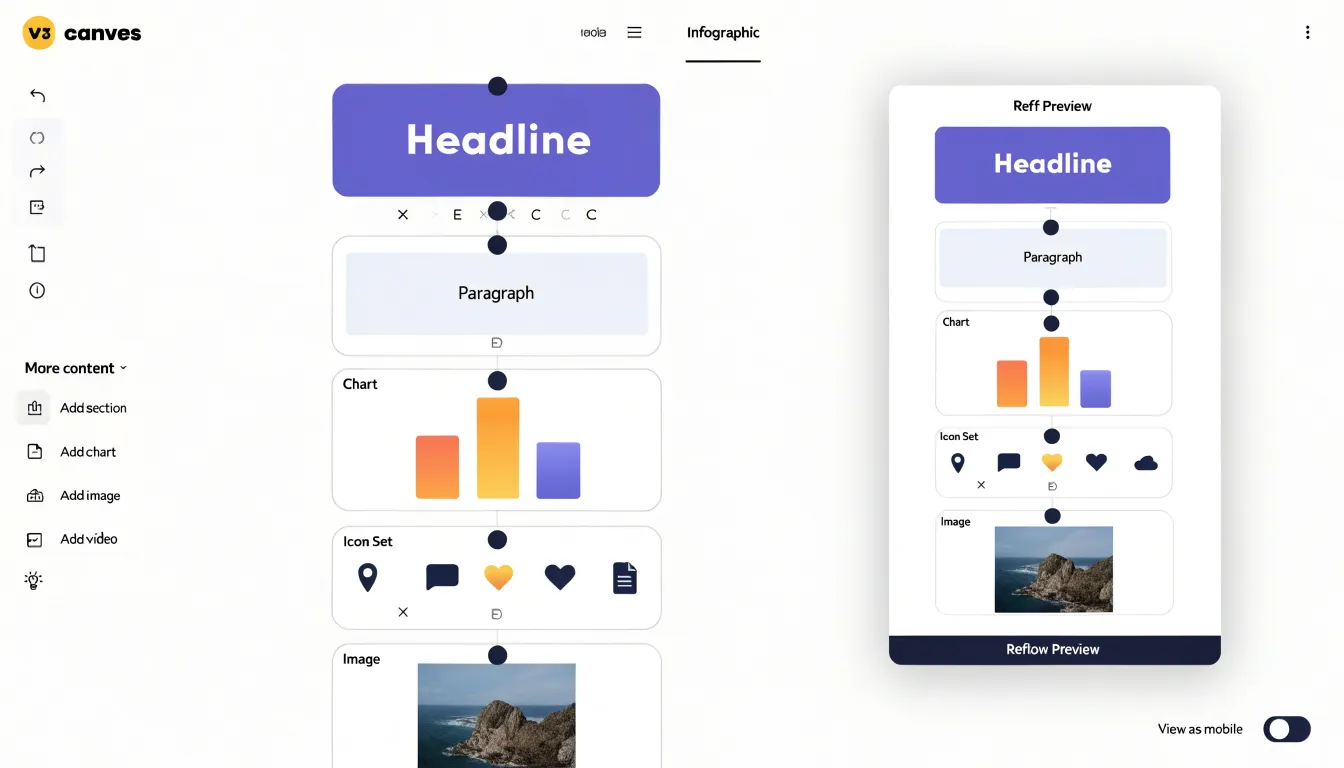
Visme’s infographic builder is built around a modular, block-based system that treats an infographic as a sequence of content blocks rather than a single flat canvas. Each block can hold a headline, a paragraph of text, a data visualization, an icon set, or an image, and these blocks stack and reorder as the narrative develops. This structure makes Visme particularly suited to deep narrative reporting, where a long-form story moves through an introduction, several sections of supporting evidence, and a conclusion. Writers can add, duplicate, or rearrange blocks as the reporting evolves, and the layout reflows around the content rather than forcing the content to fit a predetermined frame. Data widgets connect to spreadsheets to support reports that get refreshed periodically. The block architecture also keeps visual consistency across a lengthy document, since spacing, alignment, and typography follow the block rules throughout.
Canva approaches infographics through its visual template collection. Its library offers a vast range of pre-designed layouts covering timelines, process flows, statistical summaries, and comparison graphics. Users select a template and replace the placeholder elements with their own content. This workflow excels at producing polished single-page visuals quickly, and the breadth of the collection means most common infographic formats have a ready-made starting point.
The distinction shows up most clearly in long-form reporting. A sprawling narrative with multiple data sections benefits from Visme’s block scaffolding, where the structure itself organizes the story. For a self-contained visual summary, Canva’s template library offers a fast route to a finished design. Both serve legitimate infographic needs, and the choice depends on whether the project demands extended narrative organization or rapid visual assembly.
Chart Type
When you build charts for a presentation or report, the way data gets into the tool determines how much maintenance the final graphic requires. Visme supports live connections to dynamic sources, meaning you can link a chart directly to a Google Sheet or a hosted Excel file and have the visual pull its values from that source on an ongoing basis. Once the connection is established, updates made to the underlying spreadsheet flow through to the chart without a manual rebuild. This is especially useful for dashboards, recurring reports, and any graphic that tracks numbers that change week to week, such as sales totals, survey responses, or campaign performance. Live data feeds extend the same logic to external sources, allowing teams to keep a visualization synchronized with systems that update continuously.
Canva’s chart workflow centers on importing data as a static file, most commonly a CSV. You prepare the data outside the tool, upload or paste it into the chart editor, and the chart renders from that snapshot. The result is a polished visual that reflects the state of the data at the moment of import. If the numbers change later, the process involves exporting a fresh CSV and repeating the import, which works well for one-off graphics and finished decks where the data is settled.
The practical difference shows up in how much ongoing effort each approach demands. Anyone producing a chart once for a fixed deliverable can work comfortably with static imports. Anyone maintaining a chart across multiple editions, sharing it with collaborators who update the source, or publishing it where the numbers need to stay current will find that a live connection removes a layer of repetitive manual work and reduces the chance that an outdated figure slips into a final visual.
Chart Type
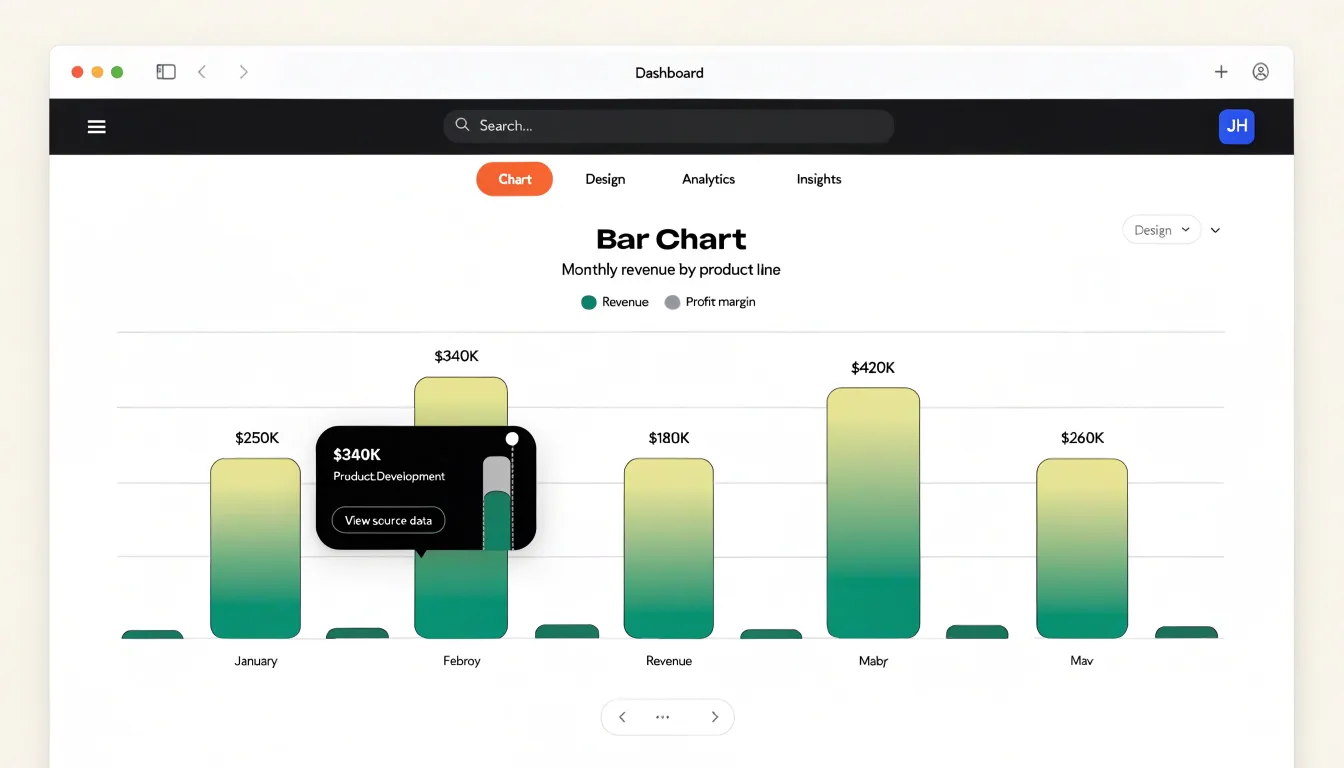
Interactivity shapes how viewers engage with data once a project moves beyond a static image. When you build a chart in Visme, each data point, bar, or slice can carry its own hover popup, revealing exact figures, context, or short explanations without cluttering the base graphic. Those same elements can support clickable links, letting a chart act as a navigational layer that routes viewers to source data, related reports, or deeper product pages. Visme also provides object-level animation controls, so you can set bars to grow, lines to draw themselves, and labels to fade in on a chosen trigger. These effects can be sequenced so a chart reveals its story in stages, which works well for presentations, embedded web content, and asynchronous reports where nobody is narrating.
Canva approaches movement more simply. Its animation options center on page transition effects such as rise, fade, and pan, applied to slide decks and video exports. These transitions give a polished sense of flow between pages, yet they operate at the level of the whole canvas rather than individual chart elements. A bar cannot be scripted to grow on hover, and a tooltip populated with custom detail is not part of the standard chart workflow. Links are available on certain elements in web-oriented output, though the chart itself remains a static graphic once rendered.
The practical difference comes down to how much of the data story you want the viewer to control. Visme turns charts into small interactive interfaces, with hover states, clickable paths, and staged motion. Canva keeps the chart as a finished visual and concentrates movement on the pacing of the surrounding pages, which suits quick social graphics and print-first collateral. For tools meant to teach, persuade, or guide exploration, the interactive layer in Visme offers meaningfully more range.
Chart Type
Canva’s template library stands out for its sheer volume and everyday accessibility. Users searching for a chart template can browse thousands of options organized by format, occasion, and visual style, from simple pie charts for classroom slides to lively bar graphs for Instagram stories. The platform leans heavily toward quick, social-ready designs, so someone who needs a polished graphic in minutes can find a colorful, attention-grabbing layout and drop in data with minimal effort. Many of these templates prioritize visual appeal and trend-driven aesthetics, which suits marketers, educators, and casual creators who want results without a steep learning curve. The breadth of choices means there is almost always a design that fits a given campaign.
Visme takes a more curated approach, offering a smaller but deliberately organized collection of chart layouts aimed at professional and business contexts. Its templates tend to emphasize clarity, data accuracy, and presentational polish, with layouts suited to reports, pitch decks, dashboards, and corporate infographics. Users encounter chart types grouped by analytical purpose, such as comparison, distribution, or trend visualization, which helps them select an appropriate format rather than simply an attractive one. The library feels designed for users who need to communicate findings to stakeholders and value consistency, readability, and a formal visual tone.
The practical difference comes down to the design task at hand. A social media manager assembling a fast promotional graphic will likely appreciate Canva’s sprawling, trend-conscious catalog. A consultant or analyst preparing a quarterly business review may find Visme’s focused, business-oriented chart layouts better aligned with professional expectations. Each platform’s template strategy reflects its broader design philosophy, giving users meaningfully different starting points depending on whether speed and variety or structure and business polish matter most.
Chart Type
A brand kit centralizes the visual identity of an organization so that every document produced by a team carries the same colors, typefaces, and logos. In Canva Pro, this feature lives in the Brand Hub, where administrators upload logos as transparent PNG or SVG files, define a palette of custom colors with hex codes, and select primary and secondary fonts for headings and body text. Once saved, these elements appear in a dedicated tab inside the editor, letting any team member apply approved brand colors to shapes, charts, and backgrounds with a single click. Fonts chosen in the brand kit surface at the top of the text toolbar, which reduces the chance that a colleague will default to an off-brand typeface while rushing to finish a chart. Administrators on a Canva Pro team can also lock brand elements so that non-designers can use them without altering the underlying assets.
Visme takes a comparable approach through its brand settings, where teams define color palettes, upload logos, and set default fonts. Visme’s brand kit applies across slide decks, infographics, and reports, and it extends into chart styling, since color palettes defined in the brand kit become the default palette offered when a new chart is inserted. This connection between brand colors and data visualization is useful when a team produces recurring reports, because each new chart inherits the approved palette rather than requiring manual recoloring. Visme also supports multiple brand kits for agencies or organizations managing several clients, letting designers switch between identities from a single account.
Both platforms store uploaded logos in a shared asset library, so team members avoid hunting through local folders for the correct version of a mark. Managing typography is similarly straightforward in each tool, with custom font uploads available on paid plans. The practical difference comes down to workflow preferences and how tightly the brand kit ties into chart creation.
Chart Type
When you build a chart or infographic, the visual assets surrounding your data carry much of the communicative weight. Icons clarify categories, photos set context, and vector elements give structure. Canva’s library centers on sheer breadth. It offers millions of stock photographs, illustrations, shapes, and icons, drawn from its own collections and integrations with providers like Pexels and Pixabay. A user searching for a photo of a manufacturing floor, a smiling customer, or a city skyline will find abundant, high-quality results, often with several stylistic variants available. This makes Canva well suited to marketing infographics where photography and lifestyle imagery drive engagement.
Visme takes a more technical direction with its asset library. Its icon sets lean toward diagrammatic and information-design use cases: arrows, flow markers, process symbols, equipment icons, and abstract geometric shapes. The library is smaller in photographic terms, but its vector icons are designed to sit cleanly beside charts and data labels without visual clutter. Visme also includes a collection of 3D graphic elements, such as spheres, cubes, and layered shapes, that can add depth to a flat design. These assets are especially useful in technical or corporate reports where the goal is to explain a system, workflow, or hierarchy.
The practical distinction comes down to asset volume versus asset fit. Canva’s library rewards users who need photographic richness and fast access to a huge range of imagery. Visme’s library rewards users who need precise, diagram-friendly vectors and the occasional dimensional flourish. For chart-heavy projects, the deciding factor is often whether the surrounding visuals need to feel editorial and photographic or schematic and technical. Both libraries support SVG and PNG exports, so the assets can be reused elsewhere if a project migrates between tools. Reviewing the icon and photo collections at the start of a project helps match the asset style to the data story before layout work begins.
Chart Type
Real-time teamwork sits at the center of how modern design platforms are evaluated, and both Canva and Visme have built substantial infrastructure around collaborative workflows. On the co-editing front, Canva allows multiple team members to open the same design simultaneously, with changes appearing live on the shared canvas. Each collaborator receives a distinct colored cursor and selection outline, which makes it easy to see who is working on which element at any moment. Visme offers comparable simultaneous editing, letting teammates add charts, adjust data labels, or reposition infographic blocks while others watch the updates appear in real time. This live editing model shortens review cycles considerably, since colleagues can refine a chart together during a single working session rather than trading exported files back and forth.
Commenting adds a second layer to that collaboration. Canva supports threaded comments attached to specific elements or to the page as a whole, along with mentions that notify teammates and resolution controls that mark feedback as addressed. Visme provides similar annotation tools, allowing reviewers to leave notes directly on charts and infographics and to hold focused discussions around particular visuals. These commenting systems keep feedback anchored to the exact asset in question, which reduces ambiguity when several people weigh in on a data visualization.
Workspace management rounds out the collaboration story. Canva organizes teamwork through folders, brand kits, shared team spaces, and role-based permissions that govern who can view, comment on, or edit content. Visme structures collaboration through project folders, team workspaces, and member roles with adjustable access levels. Both platforms also maintain version history, giving teams a way to track changes over time and restore earlier iterations when needed. Together, these features support distributed teams that need to build and refine charts and infographics together without stepping on each other’s work.
Chart Type
When it comes to export and publishing, Visme and Canva take noticeably different approaches that affect how your charts reach an audience. Visme supports exporting interactive HTML5 embeds, which means viewers can hover over data points, reveal tooltips, and explore values directly within a web page. This capability is valuable for dashboards, client presentations, and any context where the chart needs to stay live and responsive after publication. Visme also provides vector PDF exports, keeping chart elements, text, and lines sharp at any scale, which matters for print materials, reports, and documents that may be resized. On the download side, Visme offers a range of formats for images and documents suited to both screen and print use.
Canva’s standard download options center on PNG images and MP4 video files. PNG exports work well for social media posts, slide decks, and quick sharing, though raster output can soften when enlarged. MP4 video exports let you animate chart reveals or walkthroughs for platforms that favor video content. Publishing through Canva’s sharing links gives you a live view of the design in a browser, and embedded charts can be placed on websites through available embed options.
The practical difference shows up in the final delivery stage. If your project calls for an interactive chart embedded on a website or a vector PDF that holds up in print, Visme’s export menu offers those choices directly. If your workflow leans toward static images and short video clips for social channels and presentations, Canva’s PNG and MP4 downloads cover those needs in a straightforward way. Matching export formats to the destination helps ensure charts remain legible and useful once they leave the editor.
Chart Type
When comparing Canva and Visme for charts and infographics, price is central to the decision because both platforms structure their plans around what you can build and how you share it. Canva’s free tier offers a generous foundation: thousands of templates, a solid chart tool with bar, line, pie, and donut options, and the ability to export designs in standard formats. The free plan comes with limits, though, including restricted access to premium templates and elements, capped cloud storage, and fewer brand controls. Canva Pro sits at a modest monthly rate, with a lower annual price, and unlocks the full element library, brand kits, background removal, and premium chart styling options. For larger organizations, Canva for Teams adds shared folders, approval workflows, and per-seat pricing that scales with headcount.
Visme’s free account provides a smaller feature surface, with a cap on projects and limited access to its data visualization widgets and animated charts. Its paid tiers, including a personal plan and a business plan, cost more per month than Canva’s equivalent offerings at base level, though annual billing brings the personal tier closer to Canva Pro. Visme’s business tier bundles collaboration tools, brand management, and a broader library of chart and infographic components, making it attractive to teams producing data-heavy visuals regularly.
For individual creators on a tight budget, Canva’s free plan delivers more usable chart-building capacity, and its Pro upgrade covers most advanced needs at a lower price point. Business teams should weigh Visme’s stronger data visualization features against its higher per-seat cost, particularly if charts and infographics are the core output. Canva for Teams often wins on total cost for mixed-use design work, while Visme’s pricing reflects a more specialized toolset. Buyers should compare annual versus monthly billing and seat counts, since those variables shift the value calculation between the two platforms.
Chart Type
Canva’s strengths come through most clearly in fast-moving marketing environments where a polished visual needs to exist by the end of the day. A social media manager who needs a bar chart for an Instagram carousel, a small business owner assembling a one-page flyer with a simple pie chart, or a team lead building a lightweight deck for a weekly meeting can all move from a blank canvas to a finished graphic in minutes. Users don’t need to start from scratch; they can drop their data into a pre-styled chart and adjust colors, fonts, and labels to match a brand palette without touching code or design software.
This makes Canva especially well suited to marketing collateral that prioritizes speed and visual consistency over analytical depth. Promotional posts, event announcements, email headers, and presentation slides that include a chart or two as supporting visuals are all natural fits. The integrated stock imagery and icon libraries let users blend standard charts with other visual elements in a single composition.
For simple presentations, Canva’s chart tools integrate directly with its slide templates, so a presenter can build a coherent deck where charts share the same styling as surrounding text and graphics. The shallow learning curve matters for teams without dedicated designers, and the shared workspace stays approachable when multiple people contribute to visuals. In short, Canva fits scenarios where the chart serves communication and aesthetics rather than deep data exploration, and where turnaround time and ease of use carry real weight.
Chart Type
Visme shines in scenarios where charts need to do more than display numbers. For dynamic corporate reports, Visme provides a structured environment where quarterly results, KPIs, and financial summaries come together as a cohesive document. Teams can build branded report templates, populate them with live spreadsheet-connected charts, and update figures as new data arrives, which keeps recurring reporting cycles efficient.
Interactive infographics represent another strong use case. Because Visme supports embedded links, hover effects, and navigable elements directly within chart-based designs, an infographic can function as an explorable experience. A viewer can click through regions of a map, reveal detail on a bar chart, or follow a flow from summary metrics to granular breakdowns. This interactivity suits digital publishing, internal communications, and educational content where audience engagement matters. When these infographics are shared online, the embedded interactions travel with them, and analytics can show how viewers engage with specific sections.
Data-heavy presentations also benefit from Visme’s chart capabilities. A deck packed with sales figures, survey results, or operational metrics needs consistent styling across dozens of slides, and Visme’s chart tools apply formatting uniformly while accommodating large datasets. Multiple chart types, from stacked bars to radar plots, can coexist in one deck with shared color schemes. Presenters can integrate progressive animations to help audiences absorb complex information step by step. For analysts and communications teams preparing dense quarterly reviews or investor updates, these features reduce the manual effort of formatting each visual individually while preserving clarity across the full presentation.
Chart Type
The chart type conversation reaches its practical conclusion when you map your own situation onto a simple decision matrix. Start with budget, since it frames everything else. Users working with no budget at all can lean on Canva’s free tier, which covers the common chart types and handles most infographic layouts without payment. Visme’s free plan is more restrictive on chart variety and export options, so budget-conscious users who need heavier data visualization should expect to upgrade. If you can pay for a single subscription, both tools offer premium tiers, and the question becomes which paid feature set matches your daily work.
Next, weigh technical skill level. Canva rewards users who want drag-and-drop simplicity and minimal setup, suiting marketers and non-specialists. Visme offers more granular control over axes, labels, and interactive elements, so users comfortable with data formatting and design settings will extract more value from it. Beginners rarely feel blocked in Canva, while intermediate and advanced users often hit its ceiling when customizing complex visuals.
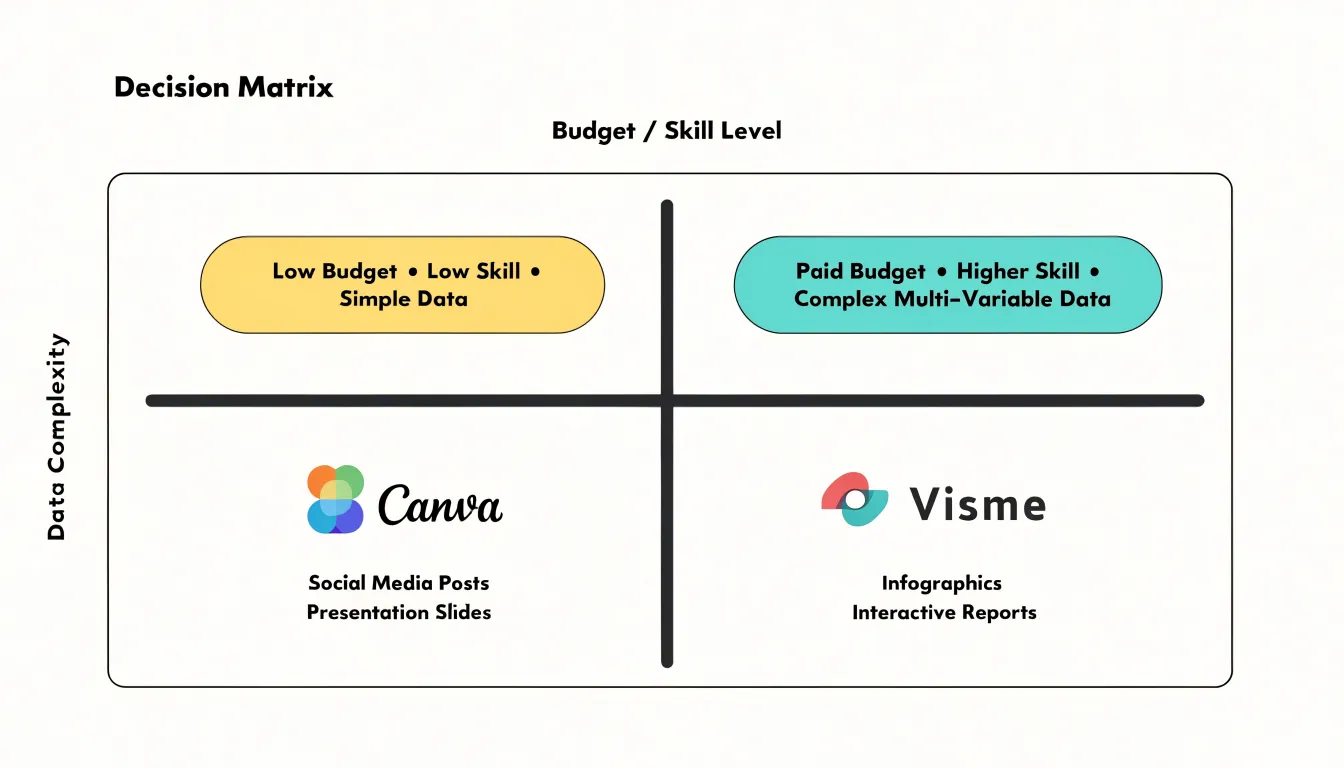
Finally, factor in data complexity. Small datasets with a handful of categories fit either tool comfortably. Larger datasets, multi-series comparisons, or charts requiring precise scale adjustments favor Visme, which tolerates more elaborate inputs and interactive presentations. Canva handles moderate complexity well but becomes fiddly when rows and columns multiply.
Read the matrix together: zero budget plus low skill plus simple data points to Canva; paid budget plus higher skill plus complex data points to Visme; mixed profiles usually land on Canva for speed and Visme for depth. Use the matrix as a starting filter, then test your actual dataset in each free tier before committing.
Chart Type
When a complete beginner opens Canva for the first time, the interface presents a familiar layout: a left-hand sidebar with searchable tabs for templates, elements, uploads, and charts, and a central canvas that updates live as items are added. Charts live inside the Elements panel, and clicking one drops a sample graphic onto the canvas, where a floating toolbar invites the user to swap chart types from a thumbnail row. The drag-and-drop mechanics are forgiving, with snapping guides and generous drop zones, so moving a bar chart beside a text block rarely results in misalignment. Canva also surfaces a dedicated dashboard-style template library, letting beginners start from a prearranged infographic grid rather than building a layout from scratch, which shortens the learning curve considerably.
Visme takes a somewhat more structured approach. Its editor splits the workspace into a left asset panel, a central canvas, and a right-hand properties pane that exposes data and styling controls whenever a chart is selected. This three-column arrangement feels closer to a traditional design tool, and the chart widget opens a data table directly inside the editor, so beginners can paste spreadsheet values and watch the visual update in place. Drag-and-drop works reliably, though the interface offers more controls at once, which can feel dense during a first session. Dashboard layouts are supported through template sets and grid-based frames, giving newcomers a scaffolded starting point for multi-chart pages.
Learning curves differ mainly in pacing. Canva’s stripped-back toolbar lets absolute beginners produce a presentable chart within minutes, while Visme rewards a short period of exploration with finer control over data entry and alignment. For pure first-session ease, Canva’s layout is the gentler introduction; Visme’s dashboard structure becomes intuitive quickly once the properties pane is understood.
Frequently Asked Questions
Can I connect a chart to Google Sheets or Excel in Canva or Visme?
Visme supports live connections to dynamic sources, including Google Sheets and hosted Excel files, so chart values update from the source without a manual rebuild. Canva’s chart workflow centers on importing data as a static file, most commonly a CSV, and if the numbers change later you export a fresh CSV and repeat the import.
Which tool is better for complex, multi-variable charts?
Visme offers advanced visualizations such as multi-layered funnel charts, radar charts, scatter plots, and interactive controls for hovering, filtering, and animating data. Canva’s simpler chart options may require workarounds or supplementary tools for complex multi-variable data.
How does Visme handle long-form infographics compared with Canva?
Visme uses a modular, block-based infographic builder suited to deep narrative reporting, with blocks that can hold headlines, text, data visualizations, icon sets, or images and can be reordered as the narrative develops. Canva approaches infographics through a large template collection that excels at producing polished single-page visuals quickly.
Can multiple team members edit and comment on the same chart or infographic?
Yes, both platforms support simultaneous editing, letting team members add charts, adjust data labels, or reposition infographic blocks while others watch updates appear in real time. Canva and Visme also provide commenting or annotation tools, and both maintain version history.
Does Visme or Canva offer interactive or embeddable charts?
Visme supports interactive HTML5 embeds, allowing viewers to hover over data points, reveal tooltips, and explore values within a web page. Canva’s standard downloads center on PNG images and MP4 video files, with sharing links for a live browser view and embed options for websites.
How do Canva and Visme compare on price and free-plan limits?
Canva’s free tier includes thousands of templates, a chart tool with bar, line, pie, and donut options, and standard-format exports, though it limits premium templates and elements, cloud storage, and brand controls. Visme’s free account has a smaller feature surface with a cap on projects and limited access to data visualization widgets and animated charts, and its paid tiers cost more per month than Canva’s equivalent offerings at base level. Annual billing brings Visme’s personal tier closer to Canva Pro, while Visme’s business tier bundles collaboration tools, brand management, and a broader library of chart and infographic components.
Tony Astor
Tony writes about data visualization and the tools people use to build charts and dashboards. More about Data Illustrator