Canva vs Piktochart for Charts and Infographics
 By Tony Astor ·

Canva vs Piktochart for Charts and Infographics
Canva excels at design flexibility and chart variety, offering bar, line, pie, donut, progress, and pictogram charts with deep styling control, broad templates, and strong brand kits. Piktochart emphasizes data clarity and interactivity, with precision axis controls, Google Sheets live updates, and hover-responsive charts in HTML exports. Choose Canva for visual cohesion and design freedom; Piktochart for precise, interactive data storytelling.
Table of Contents
Chart Type
Canva offers a broad library of chart formats, including bar graphs, line charts, pie charts, donut charts, progress rings, progress bars, and pictograms, all of which can be inserted directly onto a design canvas. Each chart connects to an editable data table, so changing a value updates the visual instantly. Formatting options are generous: you can adjust color palettes, fonts, labels, and legends, and apply rounded corners or drop shadows to keep charts consistent with the rest of the design. Interactive elements are limited, since Canva exports mostly to static formats, though links can be added to direct readers to further resources.
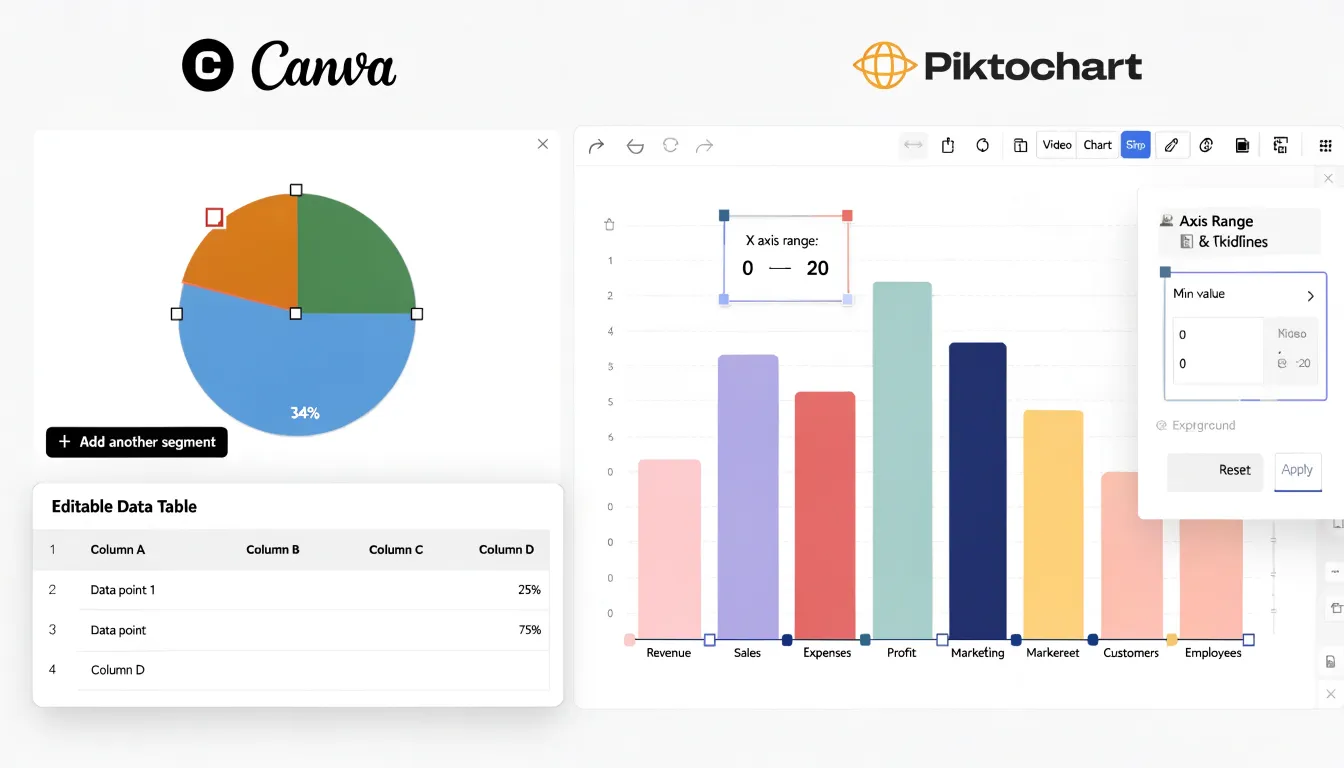
Piktochart approaches chart customization with a similar set of graph types—including bar, line, pie, and area charts—but places a stronger emphasis on data-specific editing. Its chart editor lets you fine-tune axis ranges, gridlines, and data labels with precision, which helps when presenting figures that need to read clearly at a glance. Color themes can be applied across a whole project so every chart stays visually unified, and annotations let you call out the key metric that matters most. Piktochart also supports interactive charts in exported HTML and presentation formats, meaning readers can hover over data points to reveal exact values, a feature that keeps attention fixed on the numbers you want to emphasize.
For engagement, the practical difference lies in how each tool guides the reader’s eye. Canva’s strength is aesthetic cohesion, letting charts blend into a polished layout. Piktochart’s strength is data clarity, with formatting controls and interactivity that highlight specific metrics. Choosing between them depends on whether your priority is visual harmony or precise, interactive data storytelling.
Chart Type
Both Canva and Piktochart support importing spreadsheet data, though the depth of integration differs. Canva allows users to upload CSV and Excel files directly into the editor. Once uploaded, the data appears as a table that can be inserted into a design and converted into a chart. The process is straightforward: upload, select, and insert. However, Canva does not maintain a live link to the original file. If the source data changes, you need to re-upload the file and rebuild the chart, which can be time-consuming for frequently updated information.
Piktochart offers a more integrated approach. It allows direct import of CSV and Excel files, and the imported data is stored within the platform. Piktochart’s chart editor includes a data table where you can paste spreadsheet content or upload a file. The key advantage is that Piktochart supports live data updates for charts connected to Google Sheets. When the underlying Google Sheet changes, the chart in Piktochart can be refreshed to reflect the new data, streamlining workflows for reports and dashboards. For Excel and CSV files, Piktochart also allows you to update the data within the chart editor, though this requires manual re-import or editing.
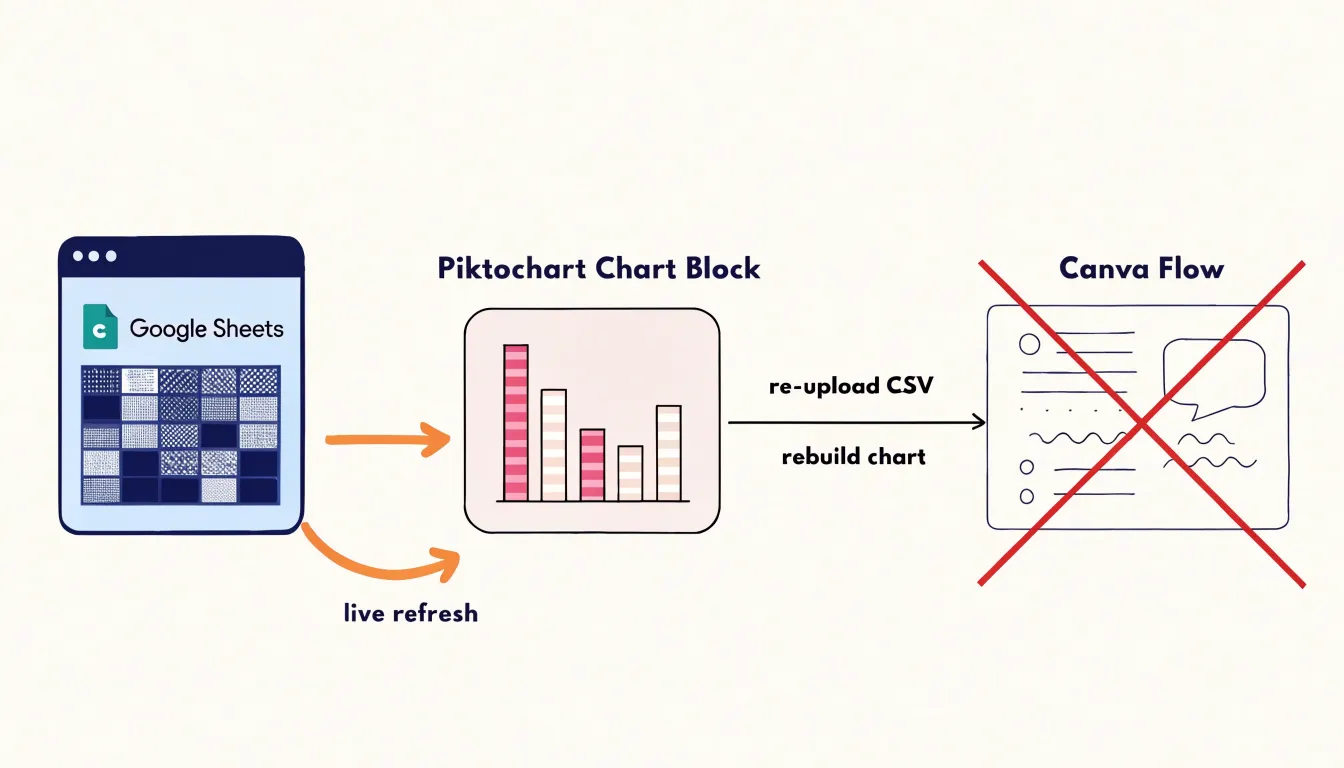
In terms of file integration, both platforms accept common spreadsheet formats, but Piktochart’s ability to link with Google Sheets provides a more seamless experience for ongoing data visualization needs. For users who need to frequently update charts with new data, Piktochart’s live data capability is a significant advantage. For those who prioritize design versatility and are working with static data, Canva’s import process is efficient and user-friendly.
Chart Type
Structuring a detailed report into a clear storyline begins with establishing visual hierarchy before any content is placed on the canvas. In Canva, designers can build hierarchy through its layering system and position controls, assigning headline-level text to the largest size, supporting statistics to a mid-tier weight, and annotations to a lighter, smaller treatment. Canva’s grid and alignment guides help keep these tiers consistent across a multi-page report, while its grouping tools allow whole sections to be repositioned without breaking the underlying order. For flowcharts that walk a reader through a process, Canva’s connector lines and shape library make it straightforward to map each decision point to the next step, so the sequence of a report reads naturally from top to bottom or left to right.
Piktochart approaches the same storytelling problem through its block-based editor, where each section of a report occupies a defined container that can be duplicated and rearranged as the narrative evolves. This block structure suits infographic formats that move through a fixed series of stages, such as a timeline that progresses chronologically or a funnel that narrows from broad findings to a single recommendation. Piktochart’s flowchart and diagram tools sit alongside its chart blocks, letting a written explanation appear directly next to the visual that supports it.
In both tools, the practical strategy is to sketch the storyline first, deciding which finding leads, which evidence supports it, and which conclusion closes the section. Designers can then use flow arrows, numbered steps, and consistent color coding to signal the order of information. Canva rewards a more freeform, layered composition, while Piktochart favors modular sections that keep long reports organized into digestible, logically sequenced pieces.
Chart Type
Interactive features such as clickable links and animation effects have become a meaningful differentiator when choosing between Canva and Piktochart for online charts and infographics. On the Canva side, hyperlinking is straightforward: users can select any element, from a text box to an icon or shape, and attach a URL through a simple link option in the editor toolbar. This makes it practical to build infographics that guide viewers to landing pages, source documents, or related resources. Canva also offers a range of animation styles that can be applied to individual elements or the entire page, which is useful when exporting a design as a video or presenting it directly from the platform. These animations range from subtle entrance effects to more dynamic motion, letting creators draw attention to specific data points during a live presentation or in a web-embedded graphic.
Piktochart takes a comparable approach but with its own emphasis. Hyperlinking is supported across text and visual elements, and the tool allows links to be added within charts and maps, which matters for infographics where data points themselves need to serve as navigation. Animation in Piktochart tends to focus on chart-specific transitions, such as animated bars, lines, and pie segments that build as the viewer scrolls or as the presentation advances. This can create a polished sense of progression when walking an audience through a data story. For web-embedded infographics, Piktochart also provides options for interactive charts that respond to hover and click actions.
In practical terms, both platforms cover the essentials of hyperlinking and animation. Canva’s advantage lies in the breadth of animation styles and the flexibility of linking any design element. Piktochart’s strength is in chart-focused interactivity, where the data visualizations themselves carry the interactive behavior. The right choice depends on whether interactivity needs to be spread across a whole design or concentrated within the charts and data displays at its core.
Chart Type
When a chart is finished, the export stage determines how well it survives its journey into print or digital use, and Canva and Piktochart take different approaches to file formats and quality. Canva offers a broad export menu that includes PNG, JPG, PDF, and SVG. PNG exports can be scaled up to high pixel dimensions, which suits infographics destined for print or for crisp display on high-density screens. The JPG option compresses aggressively, producing smaller files that load quickly online, though fine chart lines and small labels can soften at lower quality settings. PDF export comes in standard and print variants, and the print PDF preserves vector text and sharp edges, making it the safer choice for professional printing. SVG export keeps charts fully scalable and editable in design software, which matters when a chart needs to be resized to a billboard or a business card without losing fidelity.
Piktochart’s export options cover the same core formats, and it places particular emphasis on PDF quality for print-ready infographics. Its PNG and JPG exports handle everyday web publishing well, with compression that keeps file sizes reasonable for blog posts and social media. SVG export is available on paid plans and preserves vector detail for charts built from shapes and text. In side-by-side tests, Canva’s PNG exports tend to hold up better when scaled to large print dimensions, while Piktochart’s PDF output often produces cleaner results for multi-page reports and posters where text remains selectable and sharp.
The practical takeaway depends on the final destination: digital screens favor PNG for clarity, web pages benefit from compressed JPG, print work demands the print PDF or SVG, and any chart that will be resized repeatedly should leave the platform as a vector file.
Chart Type
When your infographic is destined for a physical handout or a large poster, chart resolution becomes critical, requiring attention to DPI and file format. For print, aim for at least 300 DPI at the final physical dimensions. In Canva, use the ‘Download’ menu and select ‘PDF Print’ to generate a print-ready file; this automatically embeds vector elements where possible and rasterizes others at high resolution. For Piktochart, choose ‘PDF’ under download options and ensure the ‘High quality’ setting is selected. Avoid exporting as JPG for print, as compression can introduce artifacts and blur fine lines.
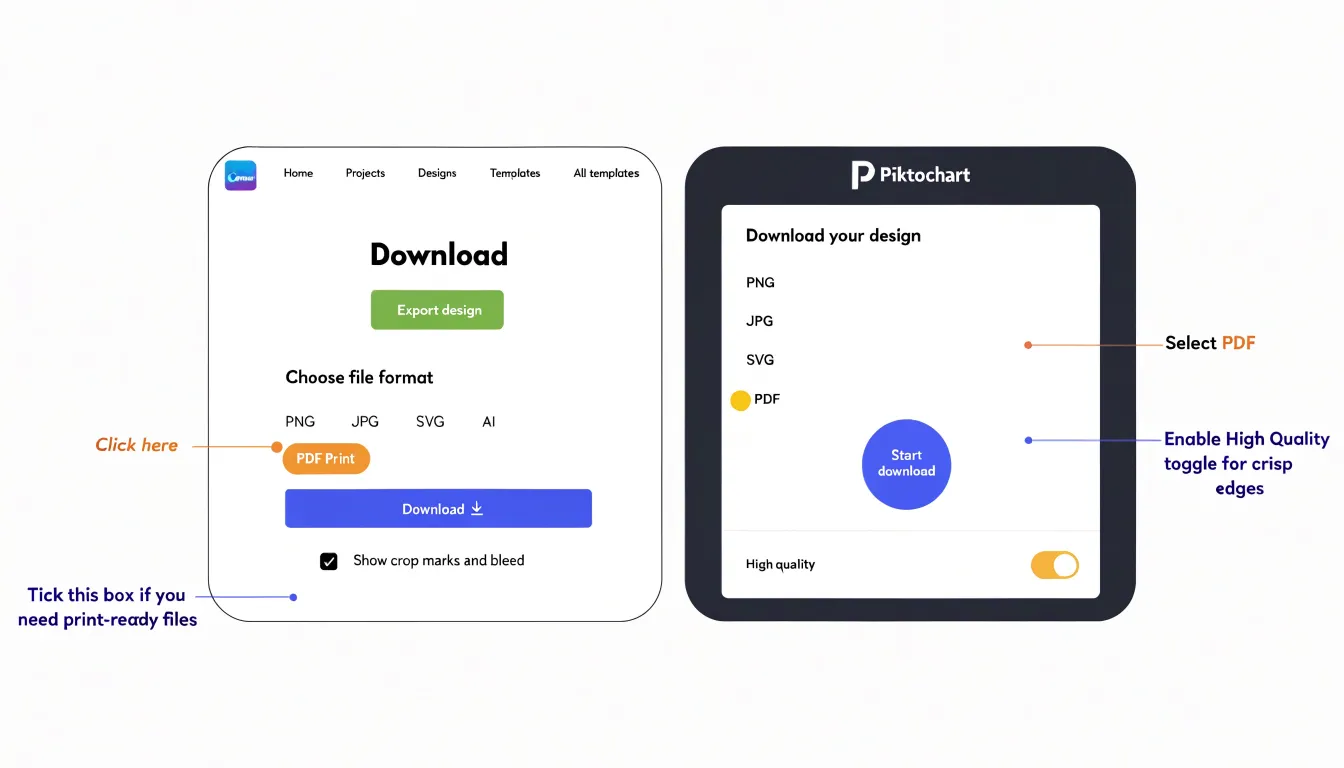
If your chart includes raster images (like photos), verify their original resolution is sufficient; scaling up a low-res image will result in pixelation. Vector charts (those built with shapes and text) scale infinitely, so prefer building charts within the tool rather than importing images. For large-format posters, consider exporting as PDF with crop marks and bleed if your printer requires them. Canva’s PDF Print option includes crop marks and bleed settings when you enable ‘Show crop marks and bleed’ in the download dialog. Piktochart does not natively add crop marks, so you may need to add them manually or use a separate tool. Always proof your export by zooming in to 100% or printing a small test section to check for blurriness. Finally, communicate with your printer about their preferred file format and resolution to avoid last-minute issues.
Chart Type
Managing brand assets is central to maintaining visual consistency across team-generated charts and infographics. Canva approaches this through Brand Kits, a feature available on paid plans that stores official logos, a palette of brand colors, and a defined set of typefaces in one reusable location. Once configured, team members can apply these elements to any design with a single click, which reduces the risk of stray hex codes or unapproved fonts creeping into charts. Canva’s Brand Kit also supports multiple kits for organizations managing several sub-brands, and brand controls can restrict template editing so that non-designers work within approved boundaries. Uploaded logos live in a shared folder structure, and fonts can be uploaded directly if the organization uses licensed typefaces not available in Canva’s default library.
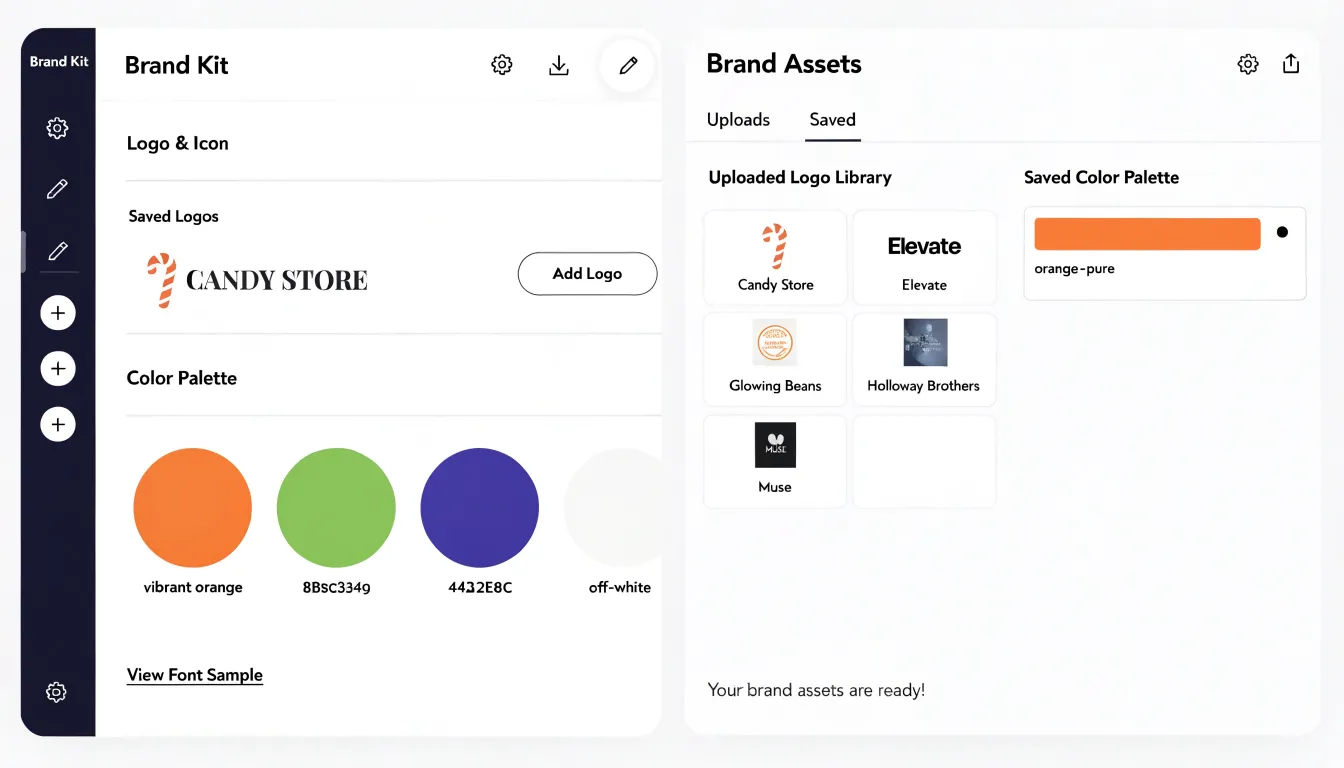
Piktochart offers comparable functionality through its brand asset tools, which let teams save logos, color schemes, and font combinations for quick application. Users can upload logos to a shared library and define color palettes that appear alongside default swatches in the editor, keeping chart fills and infographic accents aligned with company standards. Piktochart’s font management allows teams to select from available fonts and save preferred pairings, which helps maintain typographic consistency when different team members build charts. These assets are accessible to users within a shared workspace, streamlining collaboration while preserving design rules.
Both platforms recognize that charts and infographics are frequently produced by staff without design training, and each builds guardrails into its brand tools accordingly. Canva leans toward deeper customization and enterprise-level controls, while Piktochart emphasizes straightforward access to saved assets within its editor. For teams weighing the two, the deciding factor often comes down to how complex the brand system is and how many people need governed access to it.
Chart Type
Canva and Piktochart both let you adjust fonts, colors, and shapes in your charts, but their depth of control varies. Canva provides extensive styling flexibility: you can choose from a vast library of fonts, upload custom fonts (with a Pro subscription), and adjust text size, spacing, and alignment directly within chart elements. Color customization is equally robust, with a color palette picker that lets you select from preset palettes or input hex codes, and you can apply gradients or adjust transparency. Shape manipulation is where Canva shines—you can resize, rotate, and reposition individual chart elements like bars, lines, and data points, and even change their corner radius or add borders. For more advanced needs, Canva allows you to upload custom SVG shapes or use the built-in shape library to replace default chart markers.
Piktochart also offers solid customization: you can pick from a selection of fonts, adjust colors using a palette or hex input, and modify chart element shapes to some extent. However, Piktochart’s font options are more limited, and custom font uploads are not available. Shape manipulation is less granular—you can change the overall chart style but have fewer options for tweaking individual elements. Color customization is straightforward with palette pickers and hex codes, but advanced features like gradients are limited.
Overall, Canva provides deeper styling customization, making it easier to match charts precisely to your brand or creative vision, while Piktochart offers sufficient flexibility for most standard needs but with less fine-grained control. This difference becomes apparent when you need to align every detail with a specific design language.
Chart Type
Template libraries are where both Canva and Piktochart deliver immediate value for anyone who needs polished visuals without starting from a blank canvas. Canva’s collection is vast, covering everything from single-chart layouts and social media graphics to full multi-page infographic reports. Its pre-made infographics span industries such as education, healthcare, finance, marketing, and nonprofit work, so a user can search by theme and find a layout that already fits the context. Each template is editable, letting you swap sample data for your own figures and adjust colors to match a brand palette. The sheer volume means finding a starting point is fast, and the built-in chart elements integrate smoothly into those layouts.
Piktochart takes a more curated approach, with a template library organized around common business and editorial needs, including reports, timelines, comparisons, and process explainers. The quantity is smaller than Canva’s, yet the selection is tightly focused on infographic-specific formats, which often results in faster decisions for users who know they want a data-driven visual rather than a general design. Industry variety is present across categories like technology, sustainability, and corporate communications, and many templates pair charts with narrative blocks in ways that suit annual reports or pitch decks.
For speed of production, Canva’s breadth favors users who want maximum choice and are comfortable filtering through many options, while Piktochart’s narrower catalog suits those who prefer fewer, more targeted starting points. In practice, both libraries reduce the time between having raw numbers and presenting them visually, since the structural work of arranging charts, icons, and text hierarchy has already been done. The practical difference comes down to how much browsing each user is willing to do before committing to a design direction.
Chart Type
A beginner’s first encounter with any design platform is shaped by the interface itself, so the layout and navigation mechanics deserve close attention. When opening Canva, users are greeted with a prominently placed search bar and a sidebar of categorized templates, which lets newcomers jump straight into a relevant project without hunting through menus. The editor arranges tools along the left edge while the canvas occupies the center, a spatial logic that most people recognize from other software. Dragging an element is straightforward: click, hold, and move, with alignment guides appearing automatically to suggest spacing and positioning. These visual cues reduce the guesswork involved in building a balanced infographic, particularly for users who have never worked with layered design files.
Piktochart follows a similar philosophy, presenting a template gallery on entry and a toolbar that groups chart, text, and graphic options into clearly labeled tabs. Its drag-and-drop behavior feels equally responsive, and resizing chart blocks is handled through corner handles that most beginners discover quickly.
Both platforms include undo histories and duplicate controls, which encourage the kind of trial-and-error exploration that helps new users learn without fear of breaking a layout. Learning curves remain gentle because neither tool requires knowledge of grids, layers, or vector paths to produce a polished result. Small differences emerge in how each platform surfaces chart settings once a block is placed, with one offering a contextual panel and the other relying on a floating menu. Overall, the navigation experience on both sides is designed to keep technical friction low, letting beginners focus on content and message rather than on the mechanics of the interface itself.
Chart Type
Design grids give non-designers a reliable starting structure. In both Canva and Piktochart, choosing a chart template places your graph inside a layout that already balances margins, spacing, and proportion. The grid keeps every element anchored, so a bar chart sits at a sensible size relative to its title and legend without the user calculating anything by hand. Smart alignment guides then take over the moment you drag an element, flashing pink lines when an object lines up with another edge or with the centre of the canvas, so labels snap into tidy rows and shapes distribute evenly. These guides remove the guesswork of eyeballing whether two boxes are the same height, which is often where amateur-looking visuals go wrong.
Pre-formatted content blocks carry the process further. Rather than building a chart from a blank spreadsheet, users pick from a library of styled chart blocks that arrive with fonts, colour palettes, and label placement already resolved. Need a donut chart with three segments and a legend beneath it? The block is pre-configured, so the user swaps in their numbers and the styling holds. This matters for charts specifically, because data visualisation carries many small typographic decisions: tick marks, axis labels, unit formatting, and the hierarchy between the headline figure and supporting detail. Templates handle that hierarchy for you.
The combination means someone with no training can produce a graphic that reads cleanly at a glance. Alignment guides prevent the ragged edges that signal inexperience, while content blocks enforce consistent spacing between chart elements. Charts built this way tend to look deliberate and organised, which is what most audiences read as professional polish.
Chart Type
Team collaboration features turn a single chart or infographic into a shared workspace where multiple contributors move a project forward together. Real-time co-editing sits at the center of this experience. Several people can open the same document at once and see changes appear as they happen, with each collaborator marked by a distinct cursor and name label. When one person adjusts a chart’s data labels or swaps a color palette, everyone else sees the update immediately, which removes the confusion of passing files back and forth and guessing which version is current. This live editing model keeps momentum on tight deadlines, since a designer can refine the visual styling of a chart while an analyst corrects the underlying numbers in the same session.
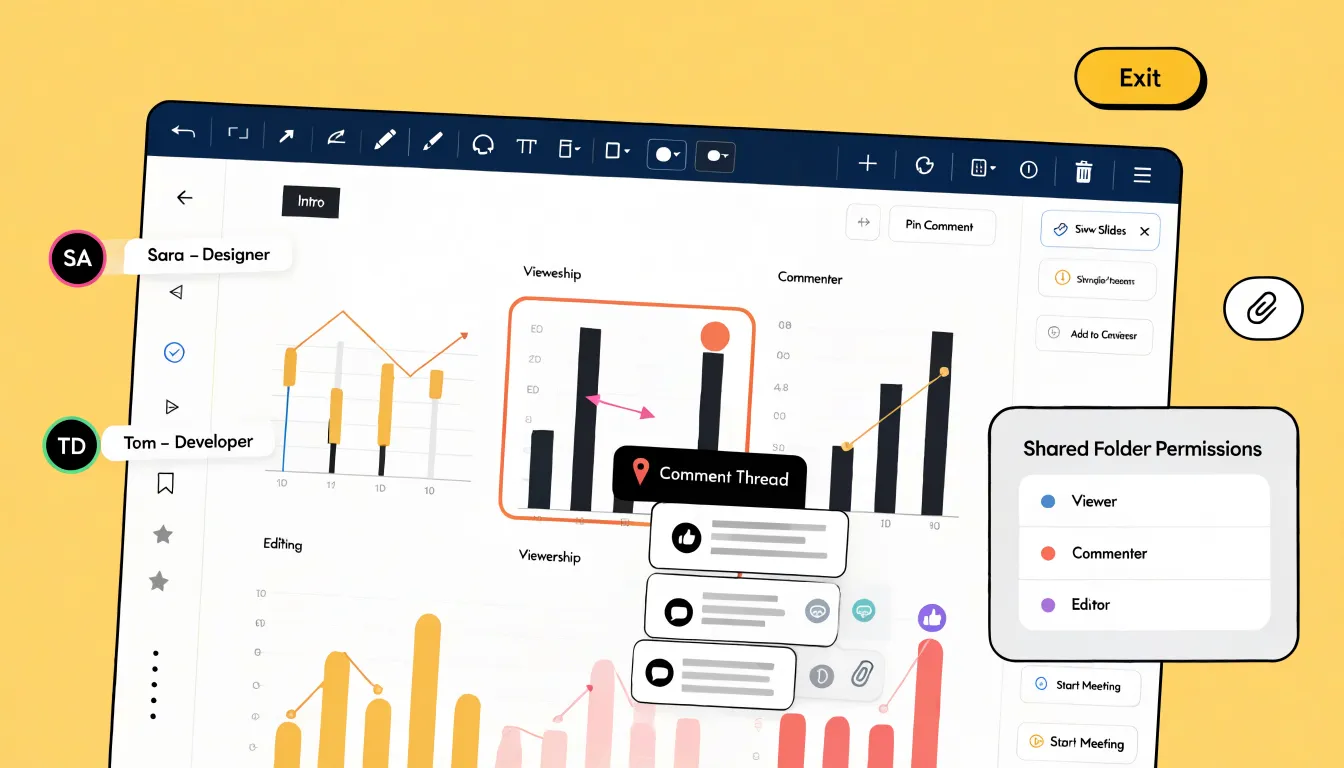
Commenting adds a structured layer of feedback on top of the shared canvas. Reviewers can pin comments to specific elements, such as a single bar in a chart or a headline in an infographic, so the discussion stays anchored to the exact place it concerns. Teammates can reply in threads, resolve items once addressed, and tag colleagues to pull them in. This threaded approach keeps feedback organized and easy to trace, which matters when a document passes through several rounds of review before publication.
Folder permissions give teams control over who can view, comment on, or edit shared projects. A project owner might grant full editing rights to the core design team while limiting stakeholders to comment-only access, and viewers outside the organization can be restricted to read-only links. Organizing projects into shared folders keeps related charts and infographics together, so permissions apply at the folder level and stay consistent as new files are added. Combined with real-time co-editing and anchored comments, these controls let teams collaborate openly while keeping sensitive or unfinished work protected.
Chart Type
Designing graphics on a smartphone or tablet has become a practical part of many people’s workflows, covering everything from creating a simple bar chart during a commute to editing an infographic draft while away from a desk. Canva offers dedicated mobile apps for both iOS and Android, and these apps include a substantial portion of the chart and infographic tools found on the desktop version. Users can select from chart types such as bar, line, pie, and progress charts, adjust colors and data values, and arrange infographic elements through a touch-friendly drag-and-drop interface. The mobile canvas scales to different screen sizes, and layouts adapt so that text boxes, icons, and chart blocks remain usable on smaller displays. Templates are also available in the mobile app for quick customization.
Responsive design capabilities also matter when designs are shared across devices; a chart built on a phone should look coherent when opened later on a laptop. Canva’s mobile apps generally support this continuity, since projects sync to the cloud and can be reopened on other devices without losing formatting. That said, some advanced editing features feel more comfortable on a larger screen, and certain elements may require zooming or more precise touch control on a phone.
Piktochart’s mobile offering is comparatively limited, with the core design and chart-editing experience remaining centered on the desktop browser, so mobile use tends to involve lighter tasks such as previewing or making minor adjustments. For users who expect to design charts and infographics on the go, mobile app functionality and feature parity between desktop and mobile versions become meaningful deciding factors.
Chart Type
When weighing Canva against Piktochart, the cost of accessing specific chart features deserves careful scrutiny. Canva’s free tier gives users access to most basic chart styles, which makes the free account genuinely useful for straightforward data visualization. Piktochart’s free tier also covers core chart types, though its overall template library and export options are more limited on the free plan.
Paid subscription tiers change the picture in meaningful ways. Canva Pro unlocks premium chart elements, brand kits, and higher-resolution exports, with pricing typically structured as a monthly or annual per-user fee. Piktochart’s paid plans similarly open up more chart styles, additional export formats, and remove branding from finished graphics. For individuals producing occasional infographics, both free tiers can cover basic needs, and the decision often comes down to which tool’s chart aesthetics and export limits suit the specific project.
Team pricing introduces per-seat costs that scale with organizational size. Canva offers team plans with shared folders, approval workflows, and centralized brand controls, priced per member. Piktochart provides team and enterprise options with user management and collaboration features, though its seat-based pricing can climb quickly for larger departments. Enterprise licensing for both tools adds security, administration, and support provisions that matter to large organizations. Conducting a cost-benefit analysis means mapping chart requirements and user counts against these tiers, since the cheapest entry point rarely matches the best value once teams and premium chart types enter the equation.
Chart Type
To help readers make a quick decision, a summary comparison highlights the best use cases for each tool across key criteria such as chart variety, ease of customization, template integration, and collaboration features.
Canva is ideal for users who need a wide variety of chart types—including specialized options like pictograms—and extensive design flexibility, making it suitable for marketing materials, social media graphics, and presentations that require a unique look. Its robust collaborative features also allow larger teams to work together in real time.
Piktochart shines for infographics and reports where data must be presented clearly and consistently, with less need for extensive design tweaking. It offers a more streamlined experience for solo users or small teams focused on data-driven infographic creation. Whether the priority is chart variety and design freedom or streamlined infographic creation, weighing these core strengths provides a clear reference point for choosing between Canva and Piktochart.
Frequently Asked Questions
Does Canva or Piktochart support live updates from Google Sheets?
Piktochart supports live data updates for charts connected to Google Sheets, so when the underlying Google Sheet changes, the chart can be refreshed. Canva does not maintain a live link to the original file; if the source data changes, you need to re-upload the file and rebuild the chart.
Which tool is better for interactive charts and infographics?
Piktochart supports interactive charts in exported HTML and presentation formats, letting readers hover over data points to reveal exact values. Canva’s interactive elements are limited because it mostly exports static formats, though links can be added to direct readers to further resources.
How can I export a print-ready chart from Canva or Piktochart?
For print, aim for at least 300 DPI at the final physical dimensions. In Canva, use the Download menu and select PDF Print; in Piktochart, choose PDF and ensure the High quality setting is selected. Avoid exporting as JPG for print because compression can introduce artifacts and blur fine lines.
Do Canva and Piktochart have mobile apps for making charts?
Canva offers dedicated mobile apps for iOS and Android that include a substantial portion of the chart and infographic tools found on the desktop version. Piktochart’s mobile offering is comparatively limited, with the core design and chart-editing experience centered on the desktop browser.
How do Canva and Piktochart handle brand assets for team charts?
Canva’s Brand Kits are available on paid plans and store official logos, brand colors, and typefaces in one reusable location, with support for multiple kits and brand controls. Piktochart’s brand asset tools let teams save logos, color schemes, and font combinations for quick application in a shared workspace.
Which platform offers more chart customization, Canva or Piktochart?
Canva provides deeper styling customization, including a vast font library, custom font uploads with a Pro subscription, gradients, transparency, and granular shape manipulation. Piktochart offers solid customization but has more limited font options, no custom font uploads, and less granular shape manipulation with limited gradients.
Tony Astor
Tony writes about data visualization and the tools people use to build charts and dashboards. More about Data Illustrator