Candlestick vs Line Chart: Which Is Better for Prices?
 By Tony Astor ·

Candlestick vs Line Chart
A candlestick chart shows four price points per period—open, high, low, and close—using a body and wicks, while a line chart plots only closing prices connected by a single line. Candlesticks reveal intraday volatility, sentiment, and reversal patterns; line charts filter noise to highlight long-term trends and support levels.
Table of Contents
Line Chart
A line chart reduces the full history of price activity into one continuous stroke by plotting only the closing price of each trading period and joining those closing values with a single line. Every session contributes one data point, taken at the end of the period, and the line runs from one close to the next across the horizontal axis of time. The result is a clean, unbroken curve that traces the general direction of price movement from the first observation to the last, with the vertical axis showing price level and the horizontal axis showing the sequence of days, weeks, or months depending on the chosen interval.
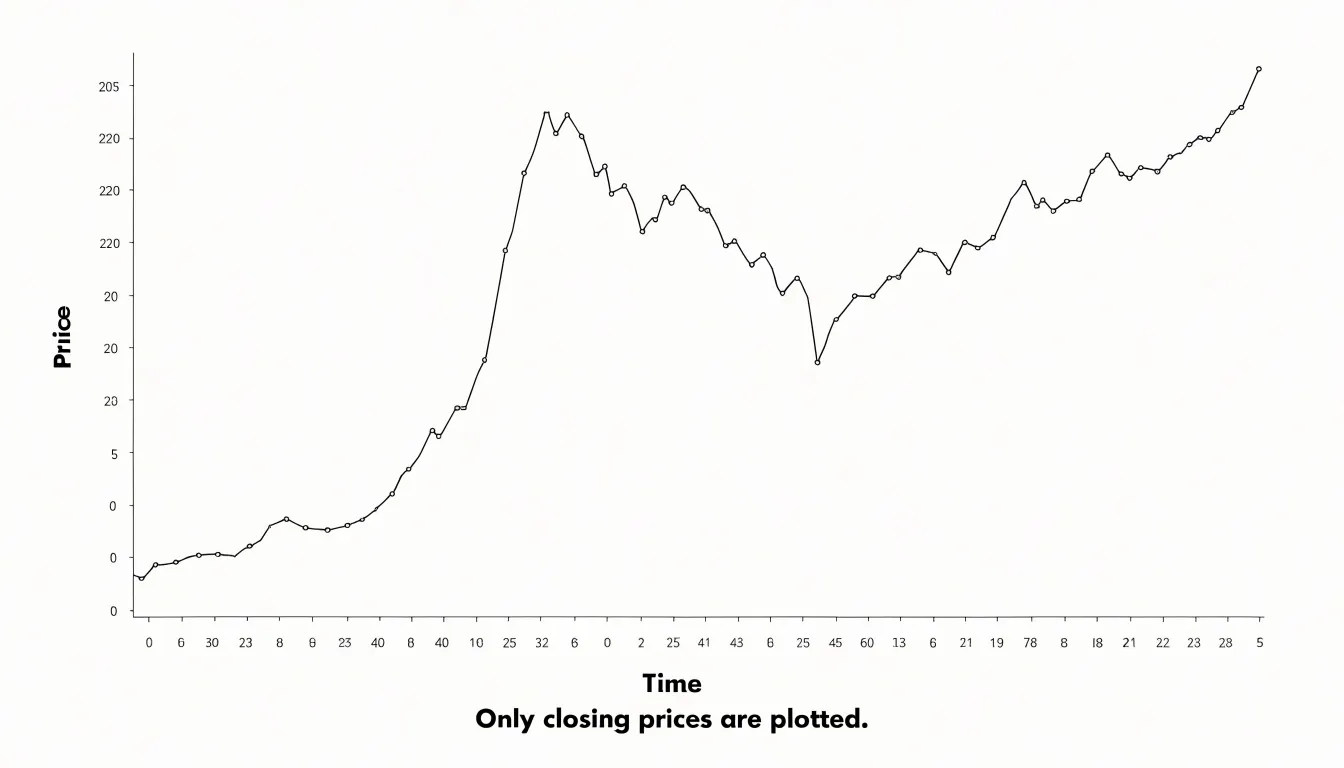
Because the chart draws only the close, all of the intraday range disappears from view: the opening price, the session high, the session low, and the path price took between them are left out entirely. That omission is the source of the chart’s clarity, since each period is represented by a single point rather than a cluster of marks, and the reader’s eye follows one line instead of scanning many separate shapes. Visual noise falls away, and longer-term patterns such as sustained uptrends, downtrends, and broad sideways ranges stand out plainly.
A line chart works well for readers who want a quick read on where price has been and where it is heading, for comparing the closing trajectory of several instruments on the same axes, and for presenting price history to audiences who do not need session-level detail. The trade-off is that the chart hides everything that happened within each period, so volatility, gaps, and reversal signals remain invisible; the line shows the destination of each session, not the journey. For long-horizon views and straightforward trend identification, that simplicity is often exactly what is needed.
Candlestick Chart
A candlestick chart displays four key price points for each period: the open, high, low, and close. Each candlestick represents a specific timeframe, such as a day, hour, or minute, and its shape conveys the full range of price movement within that period.
The rectangular body of the candlestick shows the distance between the opening and closing prices. When the close is higher than the open, the body is typically colored green or white, indicating bullish sentiment. When the close is lower than the open, the body is often red or black, signaling bearish sentiment. The height of the body reflects the magnitude of the price change between open and close.
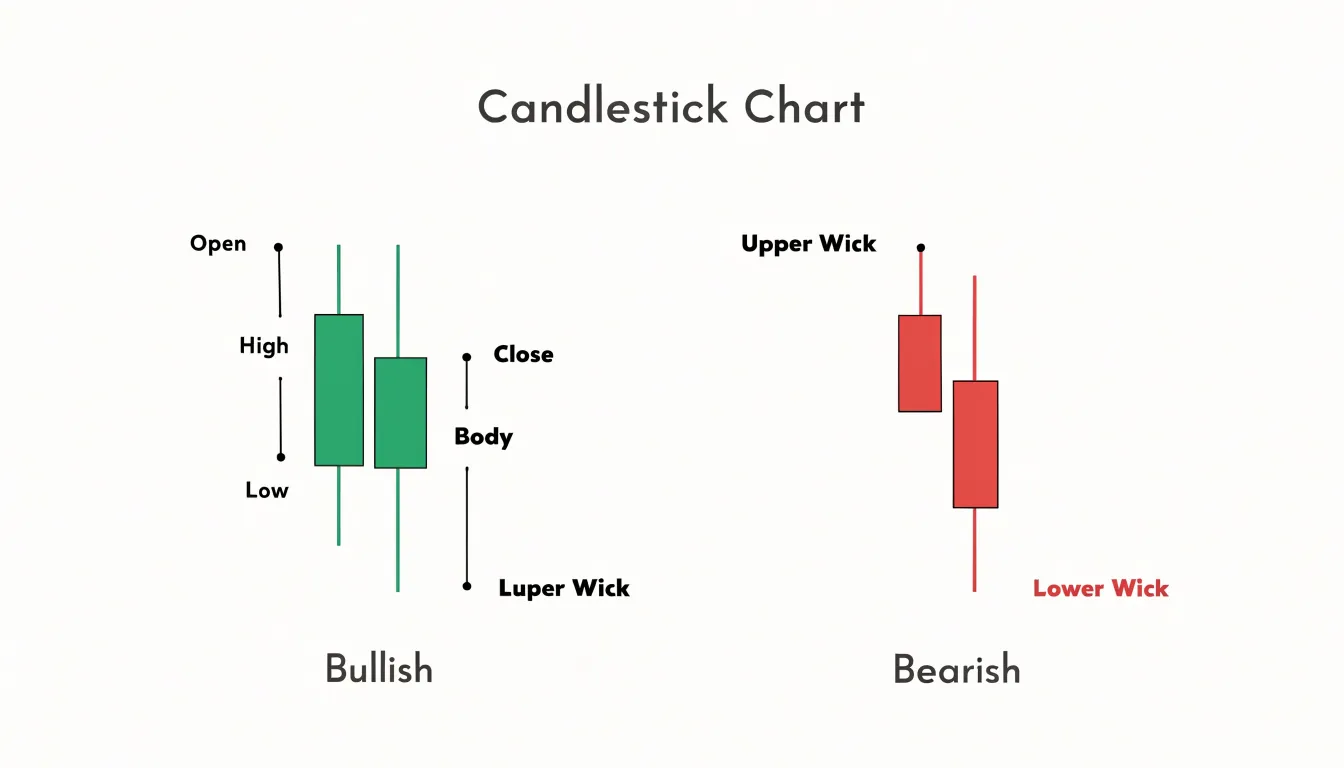
Extending from the top and bottom of the body are thin lines called wicks or shadows. The upper wick reaches from the top of the body to the highest price traded during the period, while the lower wick extends from the bottom of the body to the lowest price. These wicks illustrate the intraperiod volatility and the rejection of higher or lower prices. A long upper wick suggests that buyers pushed prices up but sellers drove them back down before the close. A long lower wick indicates that sellers pushed prices down but buyers stepped in to lift them.
The combination of body and wicks provides a complete visual summary of the battle between buyers and sellers within each timeframe. By examining a series of candlesticks, traders can quickly assess market sentiment, identify potential reversals, and gauge the strength of price movements. The candlestick format thus packs detailed price information into a compact, easy-to-read visual form.
Line Chart Pros
Removing the noise created by intraday highs, lows, and opening prices is the line chart’s central advantage for long-term investors. Daily candlesticks can swing violently within a single week, producing long wicks and gap patterns that draw attention toward short-lived volatility. When those same prices are reduced to one closing value per day, week, or month, the resulting line settles into a smoother path that reflects the broader direction of the market rather than the trading skirmishes inside it.
That smoothness makes macro trends easier to recognize. A line chart spanning several years lets an investor see the sequence of higher highs and higher lows that defines an uptrend, or the sequence of lower highs that signals a downtrend, without the visual interference of dozens of conflicting candles. The eye can follow the curve and register shifts in momentum that would be hard to spot amid a crowded candlestick display. This clarity supports disciplined decision-making, because long-term investors typically act on shifts in the primary trend rather than on individual sessions.
Line charts also make core support and resistance levels more visible. By connecting closing prices, the line tends to bounce repeatedly off the same horizontal zones, which highlights price areas where buyers and sellers have consistently agreed on value. These zones often correspond to major moving averages or prior consolidation ranges that matter to investors holding positions for months or years. A candlestick chart can obscure these levels because wicks pierce them briefly and create false impressions of a break. The line’s cleaner interaction with support gives long-term investors a more reliable reference for judging whether a trend remains intact.
Line Chart Cons
Discarding everything that happened between one close and the next comes at a cost: traders who rely on the line alone see where the market ended each session, while the full record of intraperiod price movement remains invisible.
This omission matters most when prices swing sharply within a single session. A stock might open near its prior close, surge several percent on a news release, and then fall back to finish almost unchanged. On a line chart, that session looks flat, a small horizontal step with no hint of the spike and reversal that occurred. Anyone reading the chart later would have no way to know a violent move had taken place, or that buyers who chased the high are now sitting on losses.
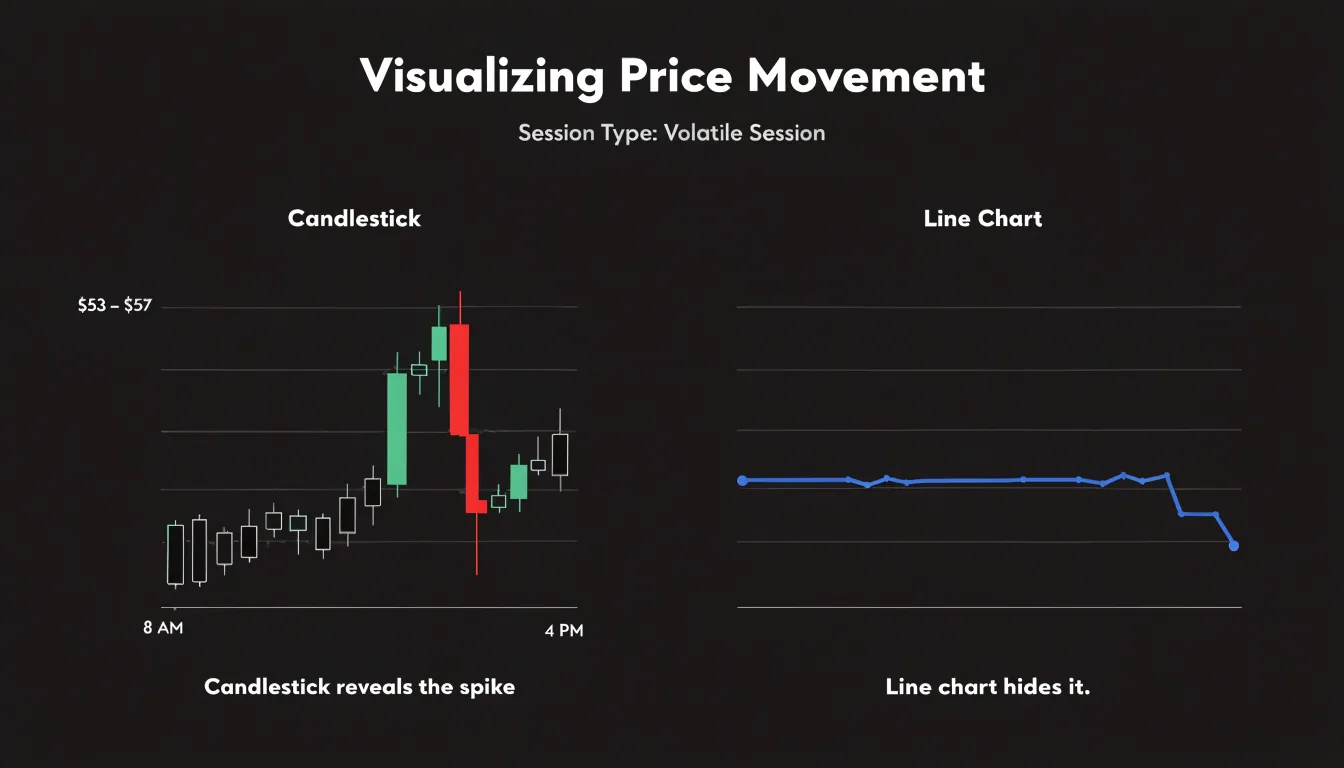
High volatility is similarly concealed. A period of erratic trading, with wide daily ranges and frequent reversals, can compress into a relatively gentle line if the closes happen to fall near one another. The chart suggests calm and stability while the underlying market was turbulent. Position sizing, stop placement, and risk assessment all depend on knowing how much a market actually moves, and the line chart understates that movement when closes mask wide intraday ranges.
The extremes of the trading range vanish as well. Intraday highs and lows mark the levels where supply and demand actually collided, where stop losses were triggered, and where rejection or acceptance occurred. Without those markers, support and resistance drawn on a line chart can be misleading, since they reflect closing prices rather than the true boundaries of trading. A breakout that pierced the prior high intrabar but closed below it leaves no trace, and the trader may misjudge the strength of the level. Reading a line chart alone therefore means accepting a smoothed summary in place of the full price record, with the intraperiod detail that informs timing and risk left out of the picture.
Candlestick Pros
Candlestick charts encode market sentiment directly into their visual structure, making them a powerful tool for reading the mood of a market at a glance. The relationship among the open, high, low, and close values tells a story about who controlled the price during that period. A long body signals decisive movement, while a short body suggests indecision or a balance of power between buyers and sellers. The color of the candle provides an immediate visual cue about which side held the upper hand, while the wicks let traders gauge the intensity of buying and selling pressure—such as fading upward momentum on a long upper wick—without digging into raw numbers or secondary indicators.
Candlestick patterns build on this foundation by capturing recognizable sequences of price action. Formations such as engulfing patterns, doji, and hammer shapes often mark moments when sentiment is shifting. Because these patterns appear in real time on the chart, they allow traders to spot momentum changes as they happen and respond to fast-moving conditions. This immediacy makes candlesticks especially useful in volatile markets, where the speed of a sentiment shift can matter as much as its direction. The result is a chart that communicates the psychological state of the market alongside the raw price data.
Candlestick Cons
Because each candle displays four price points, direction, and body-to-wick relationships, a chart spanning hundreds of candles puts thousands of individual data points in competition for the viewer’s attention at once. For an experienced trader, this density is a feature that supports fast pattern recognition. For someone still learning to read charts, the same density quickly becomes a source of confusion, since the eye is drawn in many directions simultaneously without a clear hierarchy of what matters most.
The problem intensifies on lower timeframes. A one-minute or five-minute chart can generate dozens of candles within a single trading session, and many of those candles will be small, overlapping, or dominated by wicks that reflect brief bursts of volatility. Distinguishing a meaningful reversal signal from routine noise in that environment requires practice and a working knowledge of context, such as trend direction and support and resistance levels. New traders often lack that context, so every doji, hammer, or engulfing pattern appears equally significant, and the chart begins to feel like a wall of cryptic symbols rather than a readable price record.
This overload has a practical consequence: analysis paralysis. Faced with too many competing signals, a trader may hesitate, second-guess obvious setups, or freeze entirely when a decision is needed. The sheer volume of visual stimuli can also encourage overinterpretation, where traders convince themselves they see patterns that carry no real predictive weight. Line charts sidestep much of this by offering a cleaner view that helps beginners focus on the broader direction of price before graduating to the finer detail candlesticks provide.
Volatility
Volatility is where the two chart types diverge most visibly, and understanding how each one handles wild swings helps traders choose the right tool for the conditions at hand. During explosive price moves, the candlestick’s four-point structure becomes especially valuable. A sudden spike produces a long body that immediately communicates the force of the move, while the upper and lower shadows serve as a visual record of rejected extremes, showing where the market tested a level and pulled back. In fast, volatile conditions, a single tall candle with a long shadow can tell a trader more about sentiment than a full day of quieter price action, and clusters of oversized candles make periods of panic or euphoria easy to spot at a glance.
A line chart, by contrast, inherently smooths out intrabar noise. When volatility is extreme, hiding intraday spikes, sudden reversals, and brief wicks can be an advantage for traders focused on direction rather than moment-to-moment drama. The line filters out the sharpest reactions and prevents a single chaotic session from dominating the visual story of the chart.
The tradeoff is clear in practice. Candlesticks capture the full texture of volatile markets, exposing the wicks and wide ranges that signal uncertainty or exhaustion. Line charts compress that same turbulence into a simpler trajectory. Traders who need to gauge the intensity of a move and the precise levels where price was rejected will favor candlesticks, while those tracking longer-term direction through choppy periods may find the line chart’s cleaner signal easier to act on.
Time Frames
The time frame you trade on shapes which chart type serves you best. Higher time frames, such as daily and weekly charts, compress a great deal of price movement into each individual bar. Because a daily candlestick already summarizes a full session of values, stacking hundreds of these detailed candles across a multi-year view can produce visual clutter that obscures the broader trend. Swing traders and position traders reviewing months or years of data often find that a line chart makes it easier to identify major support and resistance zones, spot trend direction, and track the rhythm of higher highs and lower lows without the distraction of intraday wicks and bodies. The closing price carries the most weight on these longer horizons, which is precisely what the line chart emphasizes.
Intraday time frames tell a different story. On one-minute, five-minute, or hourly charts, each candle captures a meaningful slice of trading activity, and its shape communicates real information about momentum and sentiment. A long lower wick on a five-minute bar can signal buyers stepping in at a support level; a series of small-bodied candles near a resistance zone can hint at indecision before a breakout. Traders operating within a single session rely on these granular signals to time entries and exits, set tight stops, and read short-term supply and demand imbalances. A line chart on these compressed time frames would smooth away the wicks, gaps, and body formations that intraday strategies depend on for tactical decisions. Matching chart type to time frame keeps the information density aligned with the decisions you actually need to make.
Beginners
For someone new to trading, the first challenge is learning how to read price movement without being buried in detail. A line chart offers a clean starting point because the overall direction of a market stands out immediately. A beginner can look at that line and see whether prices are generally rising, falling, or moving sideways, which is the foundation of every trend-following approach. This simplicity reduces the mental load of early learning, letting the novice focus on core ideas such as support, resistance, and the rhythm of higher highs and lower lows. Once those baseline concepts feel comfortable, the trader has a framework for interpreting every chart type that follows.
The gradual path also helps new traders build confidence without feeling overwhelmed. Because each candle’s body and wicks invite interpretation, beginners can easily get lost in pattern names and conflicting signals before they understand the bigger picture. Starting with a line chart keeps attention on the trend itself, so the learner develops a habit of asking where the market is heading before asking why a single candle looks unusual. When complex candlestick indicators are introduced later, they arrive as refinements to an existing understanding rather than as a confusing first language.
This step-by-step approach builds a durable skill base. A trader who has spent time reading line charts knows how to identify the prevailing direction, spot turning points, and gauge momentum, all of which remain useful when candle patterns enter the picture. The line chart acts as a simple map of the market’s journey, and the candlestick chart later adds the texture of each step along that route. Beginning simple keeps early mistakes small and learning steady.
Patterns
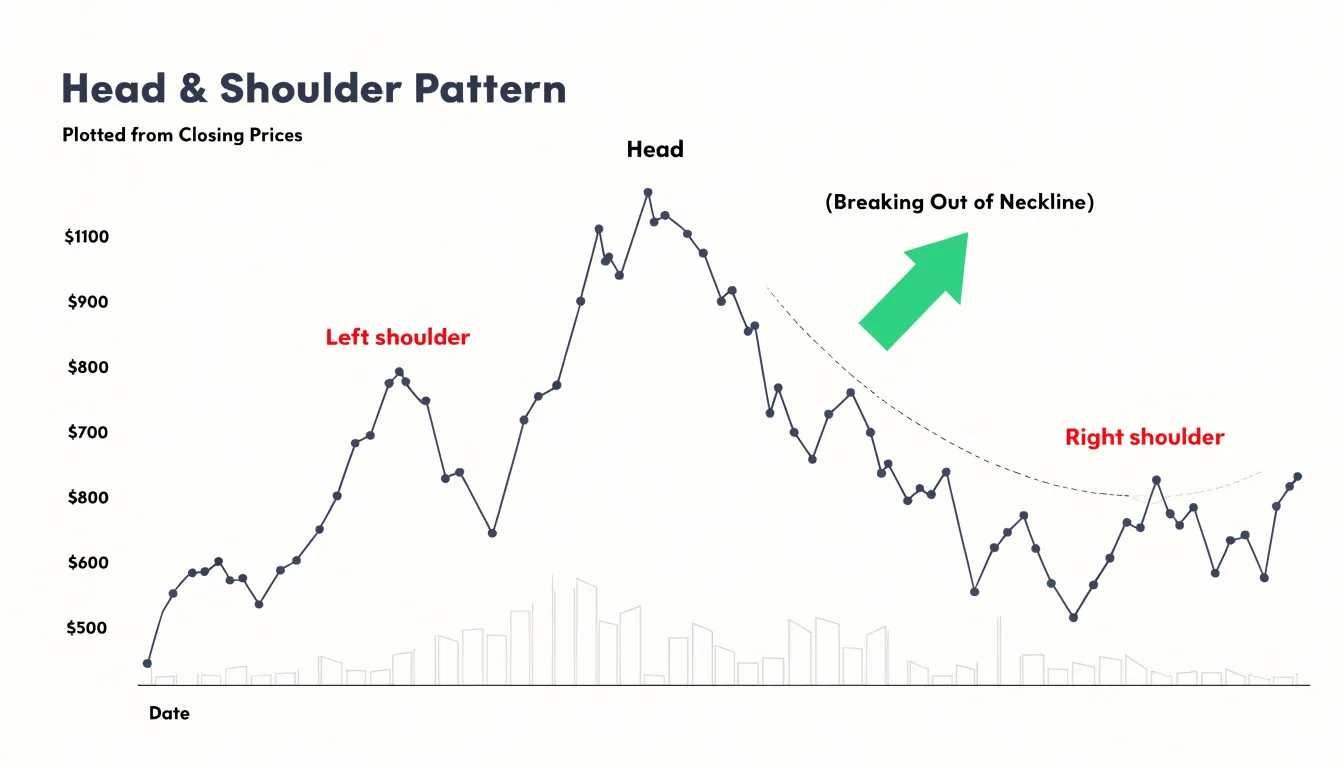
Because a line chart records only closing prices, it filters out intrabar noise and makes broader structural formations easy to recognize. A head and shoulders pattern, for example, appears on a line chart as three distinct peaks with a central summit rising above two lower shoulders, followed by a break through the neckline. Double tops and double bottoms follow a similar logic, where the closing line traces a clear W or M shape. Traders who favor this view argue that the shape of the closing line carries the essential information about momentum and exhaustion, and that patterns read more cleanly when every price on the chart represents a settled end-of-period value.
Candlestick charts approach the same task of spotting trends and reversals through a different unit of analysis. Reversal signals built from one or more candles, such as the engulfing pattern, the hammer, or the morning star, capture shifts in buying and selling pressure that a closing line can smooth away. A bullish engulfing pattern, where a large up candle completely covers the prior down candle, can mark the moment sellers lose control and buyers step in, often at a support level where the prior trend has run its course.
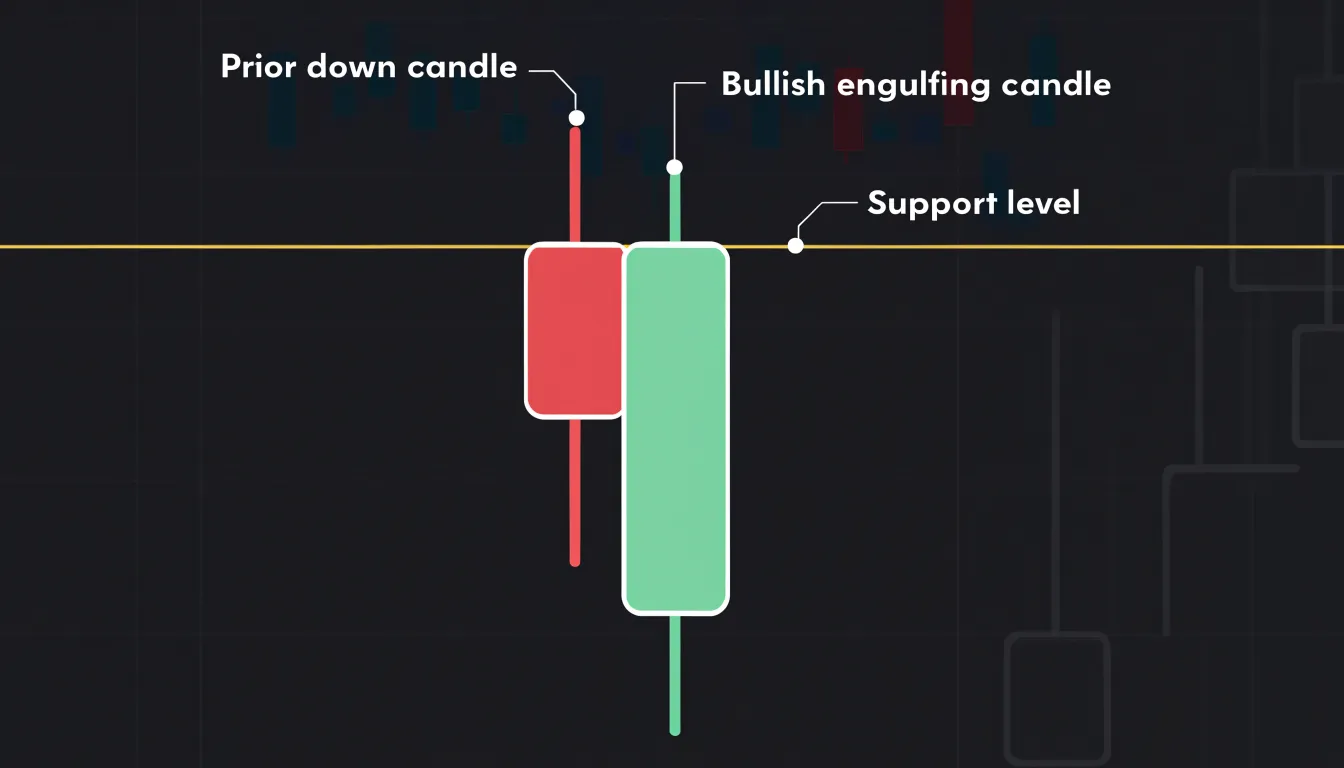
In practice the two approaches complement each other. A line chart helps confirm that a market is actually trending and where the structural boundaries lie, while candlestick patterns can offer earlier warnings of a turn within that structure. Many traders map support and resistance on the line chart and then watch the candles near those levels for reversal signals, blending structural context with intrabar detail.
Day Trading
Day traders operate in a compressed timeframe where decisions must be made in seconds or minutes, and the candlestick chart provides the granular detail needed to act with precision. Day traders use wicks to identify entry points: a failed breakout above a key level, marked by a prominent upper wick indicating potential resistance, can prompt a short position with a tight stop just beyond the wick’s high. Similarly, a long lower wick suggests support and can trigger a long entry.
The open-close gap, the difference between one candle’s close and the next candle’s open, is equally vital. Gaps often occur overnight or after news events, and intraday traders watch for gap fills or gap-and-go patterns to gauge momentum. A gap up with strong volume may indicate a continuation, prompting a quick long entry, while a gap that fails to hold can signal a reversal.
Because day traders risk small amounts per trade, the ability to set precise stop-loss orders based on wick extremes or gap levels directly improves risk management. Line charts obscure the very details—wick lengths, gap sizes, and candle body proportions—that day traders rely on to time entries and exits. In fast-moving markets, the candlestick’s rich visual data enables traders to react to subtle shifts in supply and demand, making it the preferred tool for intraday execution.
Long-Term Investing
Long-term investors operate on a different rhythm from traders who watch every intraday swing, and the chart they choose should reflect that rhythm. A buy-and-hold portfolio might be reviewed monthly, quarterly, or even just once a year, and at that cadence the daily fluctuations baked into a candlestick chart become visual noise rather than useful information. For someone holding an index fund for a decade, four data points per day collapse into a dense forest of red and green that obscures the broader trajectory.
A clean line chart smooths that forest into a single continuous path. The investor sees the arc of their portfolio across years: the gradual climb, the occasional drawdown, the recovery. That perspective supports the core discipline of long-term investing, which is staying invested through volatility. When the eye is drawn to a wide, sweeping line, a bad week registers as a small dip within a much larger ascent. When the eye is drawn to a cluster of tall red candles, the same week can feel like a crisis demanding action.
This is where emotional overreaction enters the picture. Behavioral finance research consistently shows that frequent portfolio checking correlates with worse decisions, because losses loom larger than equivalent gains and prompt panicked selling at exactly the wrong moment. Broad line charts reduce the temptation to over-interpret. They present the market as a long story rather than a series of urgent alerts, and they encourage the investor to judge performance against goals measured in years, not days.
Simplicity, in this context, is a deliberate tool. A sparse chart delivers the direction and shape of the journey without the seductive detail that invites tinkering. Fewer distractions mean fewer impulsive trades and a greater likelihood of letting compounding do its work.
Common Mistakes
Traders who are new to candlestick analysis often run into a set of recurring mistakes that undermine the value of the technique.
One of the most frequent errors involves ignoring the timeframe on which a pattern appears. A bullish engulfing candle on a one-minute chart carries far less significance than the same formation on a daily chart, because short intervals are dominated by noise and random price fluctuations. Readers should always confirm which timeframe a candle belongs to before drawing conclusions, and they should check whether higher timeframes support the signal they are seeing on lower ones.
A second common pitfall is misinterpreting false breakouts. Candles that pierce a support or resistance level and then close back inside the range often tempt traders into acting prematurely. A long wick beyond a key level, followed by a close near the middle of the prior candle, frequently signals rejection rather than confirmation. Waiting for the candle to close, and ideally for a follow-through candle, helps filter out these deceptive moves.
A third mistake is over-analyzing a single candle in isolation. One doji or hammer tells a limited story without context from surrounding price action, trend direction, volume, or nearby support and resistance zones. Candlestick patterns gain meaning when read as part of a sequence and confirmed by the broader market structure. Traders who fixate on one formation risk seeing significance where none exists, leading to impulsive entries and poorly placed stops.
Avoiding these errors requires patience and a disciplined checklist: confirm the timeframe, wait for candle closes, and evaluate each pattern within the larger context of trend and key levels. Keeping these habits in mind allows candlestick signals to serve as reliable tools rather than sources of confusion.
Final Verdict
The final verdict on choosing between candlestick and line charts comes down to matching the visualization to your goals, and a summary matrix helps traders make that match concrete. Such a matrix typically organizes charting styles along a few practical dimensions: risk tolerance, experience level, and trading strategy.
- Risk tolerance: A trader with low risk tolerance and a long-term buy-and-hold approach may find the clean simplicity of a line chart sufficient, while a higher-risk trader executing short-term momentum trades benefits from the granular candlestick data that reveals reversal patterns and sentiment shifts.
- Experience level: Newer traders often appreciate how a line chart reduces visual clutter and helps them focus on trend direction, graduating to candlesticks to read patterns such as doji, engulfing formations, and hammers as they gain confidence in studying price action.
- Trading strategy: Swing traders, day traders, and technical analysts who rely on pattern recognition gravitate toward candlesticks, while position investors and those tracking broad index performance frequently default to line charts for their uncluttered view of long-term movement.
The matrix works best as a reference rather than a rigid rule. Many traders use both styles in tandem, switching between a line chart for big-picture orientation and candlesticks for timing entries and exits. The practical takeaway is to align your chart choice with the decisions you actually make each day, and to revisit that choice as your strategy and skill evolve. Used this way, the matrix turns a simple formatting question into a deliberate part of a sound trading process.
Frequently Asked Questions
What is the difference between a candlestick chart and a line chart?
A line chart plots only the closing price of each trading period and connects those closing values with a single line. A candlestick chart displays four price points for each period—the open, high, low, and close—using a body and wicks.
What are the advantages of a line chart for long-term investors?
A line chart removes intraday noise and creates a smoother path that reflects the broader direction of the market, making macro trends easier to recognize. It also makes core support and resistance levels more visible by connecting closing prices.
What does a long upper wick on a candlestick indicate?
A long upper wick suggests that buyers pushed prices up but sellers drove them back down before the close. It illustrates intraperiod volatility and the rejection of higher prices.
Why might candlestick charts be overwhelming for new traders?
Each candle displays four price points, direction, and body-to-wick relationships, so a chart with hundreds of candles puts many competing data points in view at once. On lower timeframes, dozens of candles can appear in a single session, which can lead to analysis paralysis.
Which chart type is better for day trading?
Candlestick charts are described as the preferred tool for intraday execution because wicks, gaps, and candle body proportions help day traders time entries and exits and set precise stop-loss orders. Line charts obscure those details.
Should I use a line chart or candlestick chart on higher time frames?
Higher time frames such as daily and weekly charts often favor line charts because stacking hundreds of detailed daily candles across a multi-year view can create visual clutter. A line chart makes it easier to identify major support and resistance zones and spot trend direction.
Tony Astor
Tony writes about data visualization and the tools people use to build charts and dashboards. More about Data Illustrator