Candlestick Chart: How to Read One
 By Tony Astor ·
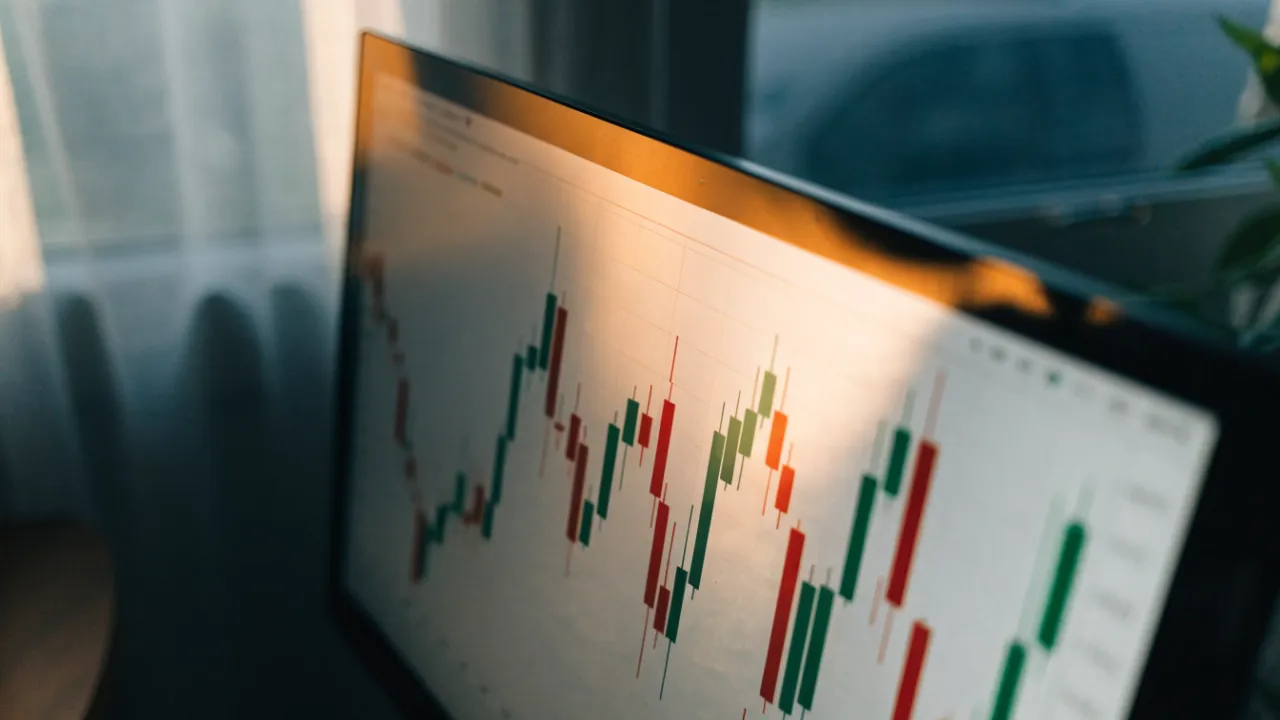
Candlestick Chart
A candlestick is a chart symbol showing the open, high, low, and close price for a set time frame. The rectangular body spans open to close, while thin wicks mark the session’s high and low. Green or white candles signal bullish closes above the open; red or black candles signal bearish closes below it.
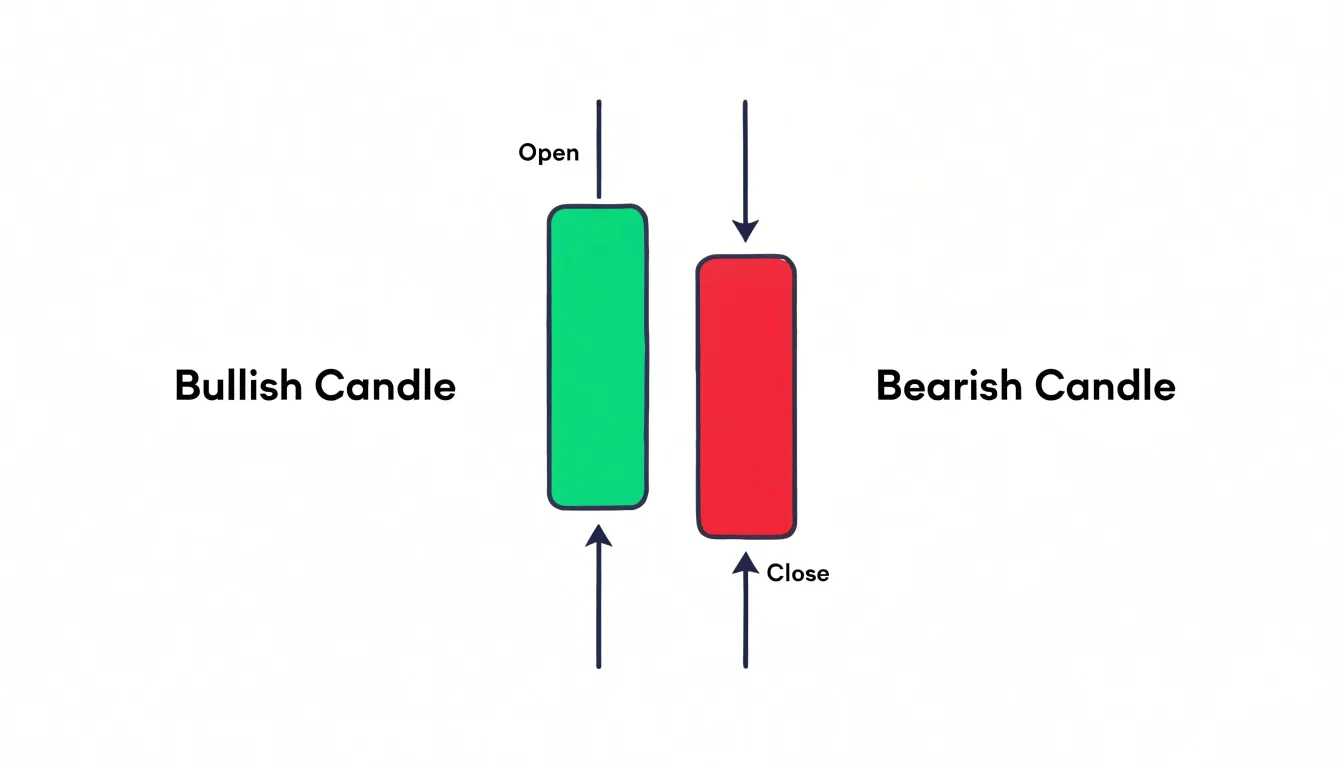
Table of Contents
- Candlestick Basics
- Open High Low Close
- Candle Anatomy
- Bullish vs Bearish Candles
- Timeframes
- Single Candle Patterns
- Hammer and Shooting Star
- Doji Candle
- Two Candle Patterns
- Engulfing and Harami
- Three Candle Patterns
- Morning and Evening Stars
- Three White Soldiers
- Wicks and Key Levels
- Common Mistakes and Practice
Candlestick Basics
A candlestick is a compact visual record of price action within a defined time frame, showing how buyers and sellers interacted during that period. Each candle is built from four data points: the opening price, the closing price, the highest price reached, and the lowest price reached. These four figures are arranged into a rectangular body and two thin lines called wicks, or shadows, to form a complete snapshot of market behaviour between the start and end of the interval. The time frame itself might be one minute, one hour, one day, or one week, depending on the chart settings and the trader’s horizon.
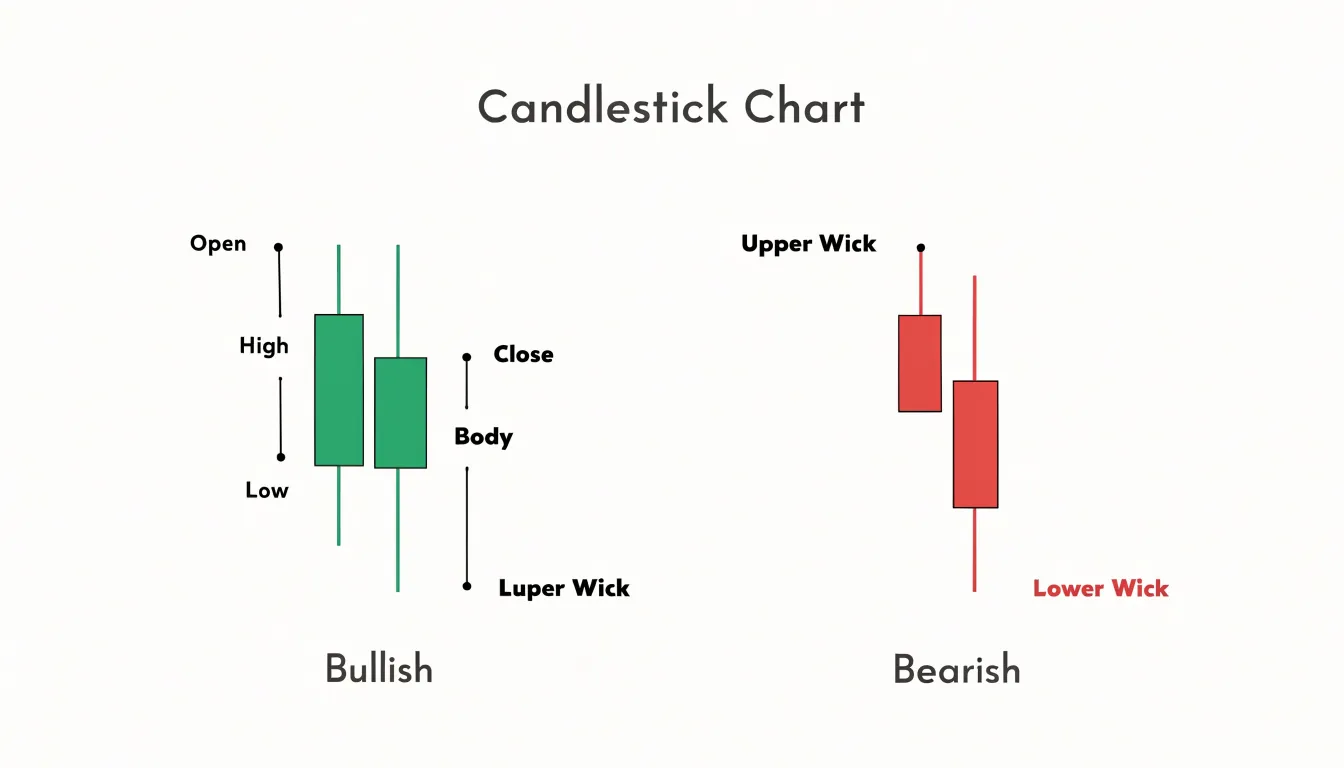
Reading the body and wicks together lets a trader gauge sentiment at a glance, seeing where pressure built, where it faded, and which side held the advantage as the period closed.
Open High Low Close
The four core price points—open, high, low, and close—form the raw data from which the visual shape of the candle is drawn.
The open marks the first price traded during the session, and the close marks the final price before the session ends. These two values are plotted as the top and bottom edges of the thick rectangular body. The distance between open and close, represented by the height of the body, shows the net result of the session’s trading activity.
The high and the low capture the extremes reached during the session. The high is the highest price traded, and the low is the lowest. These values are plotted as thin lines extending above and below the body. The upper wick reaching up to the high shows how far price pushed before pulling back, while the lower wick reaching down to the low shows the deepest decline before recovery.
By comparing the position of the open and close against the high and low, traders gauge the total range of the session and the strength behind the move.
Candle Anatomy
The thick part of the candle is called the real body. Its extent reveals the strength of the session’s directional move. A wide real body means the bulls or bears dominated from start to finish, pushing price decisively in one direction with little hesitation and strong conviction. A narrow or short real body, by contrast, shows that opening and closing prices were nearly equal, reflecting indecision or a balanced struggle between buyers and sellers.
The shadows, or wicks, extending above and below the real body reveal rejection and volatility at the extremes. A long upper shadow indicates that buyers initially drove prices higher, but sellers overwhelmed them before the close, leaving a trail of rejected higher prices. This often signals selling pressure near the top and potential weakness. A long lower shadow tells the opposite story: sellers pushed prices down, but buyers stepped in aggressively to defend lower levels and lift prices back up, suggesting demand and possible support. When both shadows are long, it points to heightened volatility and a tug-of-war, with neither side able to maintain control.
Together, the real body and shadows provide a visual snapshot of market balance. Wide bodies with short shadows suggest conviction and momentum, while narrow bodies and prominent wicks highlight hesitation, rejection, or a shift in sentiment. Traders use these anatomical features to gauge whether a move is backed by genuine force or is merely a temporary probe that failed.
Bullish vs Bearish Candles
The color of the candle is the quickest way to read the net direction of a trading session. A green or white candle indicates a bullish session: the closing price finished above the opening price, meaning buyers held the upper hand by the end of the period. A red or black candle signals the opposite, a bearish session in which sellers pushed the price below where it opened. This color coding lets traders scan a chart and instantly gauge momentum across dozens or hundreds of sessions.
The placement of the open and close flips depending on the session’s direction. On a bullish candle, the open forms the lower edge of the rectangular body and the close forms the upper edge; on a bearish candle, the open is at the top and the close is at the bottom. A long green body shows decisive buying pressure, while a long red body shows aggressive selling.
Combining color with wick length adds further detail. A lengthy upper wick on a green candle shows buyers pushed prices higher, but sellers forced a retreat before the close. A long lower wick on a red candle shows sellers drove the price down only to meet buyers who lifted it back. By comparing the bodies and shadows of green and red candles side by side, traders build a running picture of which group controlled each session and whether that control is strengthening or fading over time.
Timeframes
Every candlestick summarizes price action over a fixed interval, and the choice of that interval reshapes what the chart reveals. On a one-minute chart, each candle condenses sixty seconds of trading into a single open, high, low, and close, capturing fleeting bursts of volatility and small battles between buyers and sellers. A five-minute candle groups five of those one-minute candles together: its open is the open of the first minute, while its close matches the close of the last. The highest high and lowest low across those five minutes define its wicks, so intrabar swings that looked dramatic on the lower chart often disappear into a slender shadow. This layering continues as traders move to fifteen-minute, hourly, daily, weekly, and monthly views. Each higher timeframe candle is a composite of the candles beneath it, aggregating their range and direction into a more compact record.
The practical consequence is that trend visibility changes with the timeframe. Short-interval charts contain a great deal of noise, with frequent reversals and minor pullbacks that can obscure the broader market direction. As intervals lengthen, that noise is absorbed into fewer, larger candles, and the underlying macro trend becomes easier to recognize. A series of rising daily candles may hide several sharp intraday declines, yet the daily close captures whether buyers ultimately held control.
Traders often zoom out to identify the dominant trend on a higher timeframe, then descend to shorter intervals to time entries and manage risk within that larger context. This aggregation also explains why support and resistance levels drawn on a weekly chart carry more weight than those on a one-minute chart, since each weekly candle represents the consensus of an entire trading week.
Single Candle Patterns
Certain isolated candle formations carry enough information to suggest a possible shift in momentum or a fading trend.
- Hammer: Appears when selling pressure drives price sharply lower during a session, only for buyers to step in and push price back near the open. This long lower wick with a small body near the top signals that sellers lost control after a decline and bullish interest is building.
- Inverted Hammer: Presents the mirror image of the hammer, with a long upper wick and small lower body reflecting an initial rally that pulled back, which may precede an upside reversal when it appears after a decline.
- Shooting Star: Shows buyers pushing price higher early in the session before sellers overwhelm them, leaving a long upper shadow and a small body near the low—a warning of exhaustion in an uptrend.
- Hanging Man: Carries the same shape as a hammer—a long lower wick and a small body near the top—but appears at the top of an advance, hinting that selling pressure is beginning to emerge.
- Doji: Forms where the open and close are nearly identical, reflecting indecision and a balance of power that often precedes a directional move.
Context matters greatly when interpreting any isolated candle. The same formation carries different weight depending on its position relative to recent price action, support and resistance zones, and prevailing volume. A hammer at a well-tested support level deserves more attention than one floating in the middle of a range. Traders typically treat single candle signals as early warnings rather than standalone instructions, using them to flag where momentum may be shifting and to inform subsequent analysis.
Hammer and Shooting Star
In both the hammer and the shooting star, the long shadow is typically at least twice the height of the real body.
Because the hammer forms at the end of a downtrend and represents a sharp rejection of lower prices, traders look for it after an extended decline and wait for the following candle to confirm the reversal—ideally by closing above the hammer’s body. Volume can add conviction when it expands on the hammer or the confirmation candle.
Conversely, because the shooting star signals that higher prices were rejected at market tops, it carries more weight when it appears after a sustained advance and is followed by a bearish confirmation candle that closes below its body.
These candles work best at genuine extremes, near support and resistance zones or after prolonged directional moves. Traders typically set stops beyond the wick—just below a hammer’s low or above a shooting star’s high—which keeps risk defined and small relative to the potential reversal move. Combining these patterns with trendlines, moving averages, or momentum readings helps filter false signals and improves the odds of catching a high-probability turn.
Doji Candle
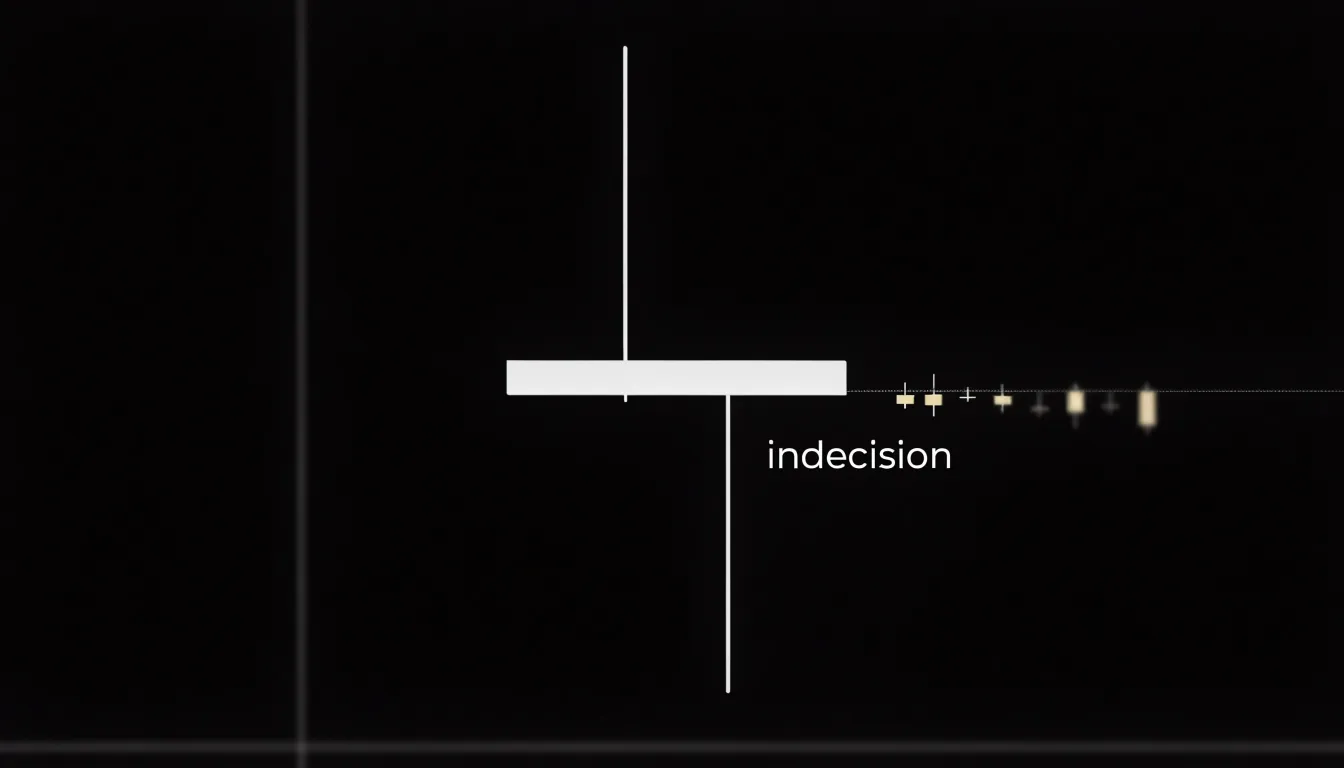
Because a doji candle forms when the opening and closing prices of a trading period are nearly identical, the real body shrinks to a thin horizontal line while the upper and lower wicks show the range the price traveled before returning close to where it began.
Buyers pushed the price higher, and sellers pushed it lower, yet neither side managed to hold the ground it gained. The session ended in a draw, signaling that momentum has stalled and conviction has thinned. The longer the wicks relative to the body, the more intense the intraday struggle, and the more meaningful the standoff becomes.
Because indecision tends to resolve, a doji often appears just before a volatility expansion, when price breaks out of a compressing range. A doji forming after an extended trend can hint that the prevailing move is losing energy, while one appearing at a support or resistance level suggests the market is testing that level and may soon commit to one side. Reliability grows when the doji sits at a key technical level, follows a strong directional run, or appears alongside confirmation such as rising volume or a breakout. Traders typically wait for the next candle to close before acting, using the doji to prepare for a decisive move rather than as a standalone entry trigger.
Two Candle Patterns
Pairing two consecutive candles gives traders a more reliable picture of how supply and demand are shifting than reading a lone candle, which can reflect noise, a news spike, or a brief liquidity gap. When the second candle confirms the first, the probability that the move reflects genuine order flow rises.
The relationship between one candle and the next reveals whether pressure is building, fading, or reversing:
- Sustained control: A candle that closes strongly near its high, followed by another that opens within the first candle’s body and closes even higher, suggests buyers are sustaining control across sessions.
- Overwhelmed effort: A long upper shadow on one candle followed by a gap down or a weak close signals that sellers stepped in and overwhelmed the earlier buying effort.
- Level defense: A candle that probes a support zone and closes off its low, followed by a candle that holds above that low, gives evidence that buyers are defending the area.
Traders also watch for specific two-candle structures like engulfing formations, where the second candle’s real body completely covers the first, and harami formations, where a small candle sits inside the prior candle’s range. Comparing the open, close, and wick structure of consecutive candles supports more confident decisions about entries, exits, and risk placement.
Engulfing and Harami
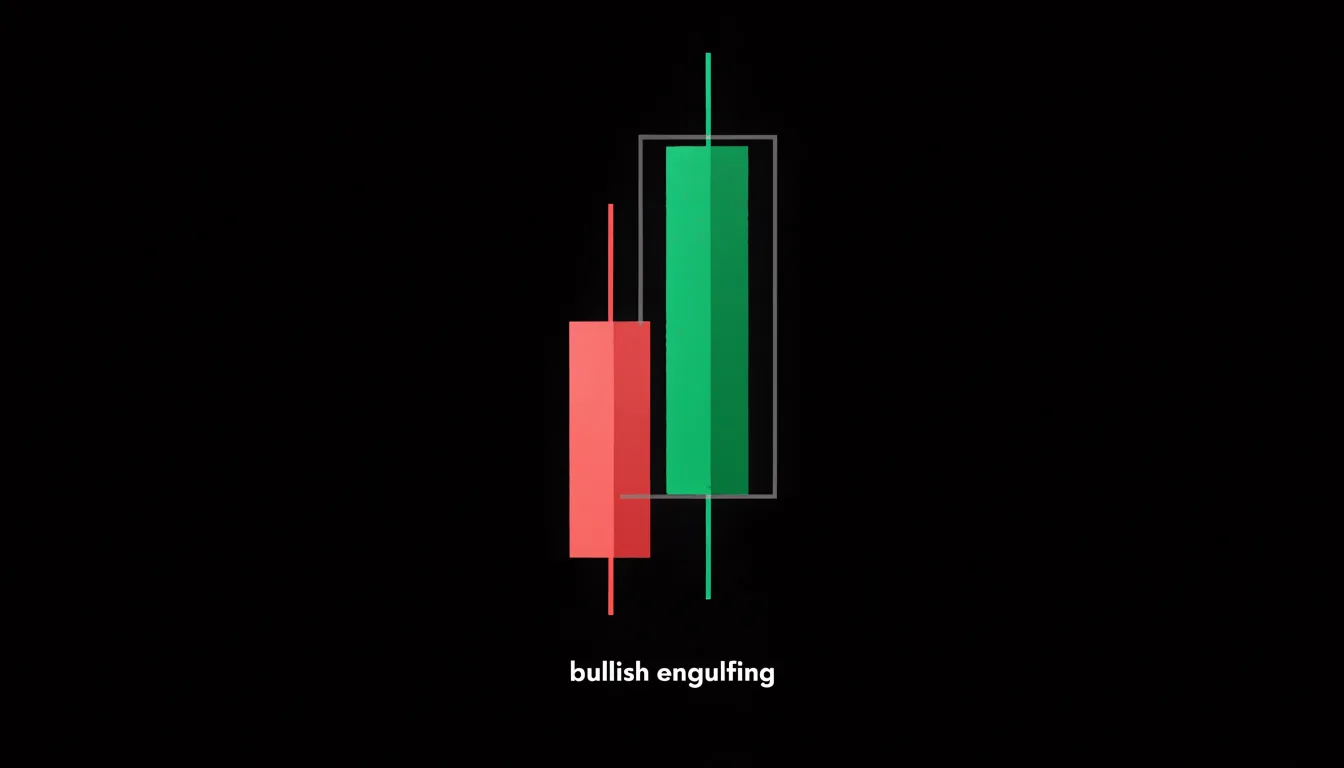
Engulfing patterns capture a session in which one side of the market overwhelms the other. A bullish engulfing pattern forms when a down candle is followed by an up candle whose real body completely spans the prior real body; a bearish engulfing pattern is the mirror image. Because the second candle opens near the close of the first and drives well past where the first candle began, the visual result is a decisive takeover of territory. Traders read it as an aggressive shift in momentum, particularly after an extended run in the opposite direction. Volume often rises on the engulfing candle, reinforcing that conviction has changed hands.
Harami patterns present the inverse geometry. The word comes from the Japanese term for pregnant, and the pattern shows a small candle contained entirely within the real body of the preceding, larger candle. Rather than a takeover, a harami records a session of hesitation, where price moves within the established range and neither side presses its advantage. That containment reflects a contraction in volatility as the market pauses to digest the prior move. Traders treat the harami as a compression signal: energy is building inside a narrowing range, and its resolution often precedes a sharp move. The color of the small candle offers a hint about which side is gaining, with an inside candle of opposite color to the trend suggesting waning pressure from the prevailing direction.
Read together, the two patterns describe opposite phases of a market cycle: engulfing candles mark forceful single-session momentum shifts, while harami candles mark quiet contractions that set the stage for the next break.
Three Candle Patterns
Three-candle patterns show how price behaves across three consecutive sessions, filtering out much of the noise that makes shorter signals unreliable. Each candle in the formation contributes a distinct phase:
- Trend establishment: The first candle establishes the prevailing trend, showing whether buyers or sellers have been in control.
- Reversal or pause: The second candle tests the opposite side and reveals whether counterpressure or hesitation is emerging.
- Confirmation: The third candle demonstrates that the shift in momentum has follow-through and is not merely a brief pause within the existing trend.
Formations like the morning star, evening star, three white soldiers, and three black crows rely on this three-part structure to show either a complete transition of control or sustained directional commitment across consecutive sessions. Traders look for completed three-candle formations at support, resistance, or the end of an extended move, combining them with volume to validate setups.
Morning and Evening Stars
Morning and evening star patterns are three-candle formations that signal potential major reversals at market bottoms and tops.
The morning star appears at the end of a downtrend and consists of:
- A long bearish candle reflecting strong selling pressure.
- A small-bodied candle (the star) that gaps below the first candle’s close, indicating indecision or slowing momentum.
- A long bullish candle that closes well into the body of the first candle—ideally above its midpoint—confirming a shift to buying pressure.
The evening star is the mirror image at the end of an uptrend:
- A long bullish candle.
- A small-bodied star that gaps above the first candle’s close.
- A long bearish candle that closes well into the first candle’s body, ideally below its midpoint.
The gap between the first and second candles is common in equity markets but not mandatory in all markets, especially in forex where gaps are rare. Traders often look for increased volume on the third candle and alignment with significant support or resistance levels to validate the reversal signal.
Three White Soldiers
The Three White Soldiers pattern consists of three consecutive long-bodied bullish candles, each opening within the prior candle’s real body and closing near its own high, with each close higher than the last. (Its bearish counterpart, Three Black Crows, follows the same structure in reverse.) This sequence captures a sustained, deliberate push upward rather than a single spike. In each session, buyers took control early, held it through the close, and left sellers unable to force a meaningful retreat.
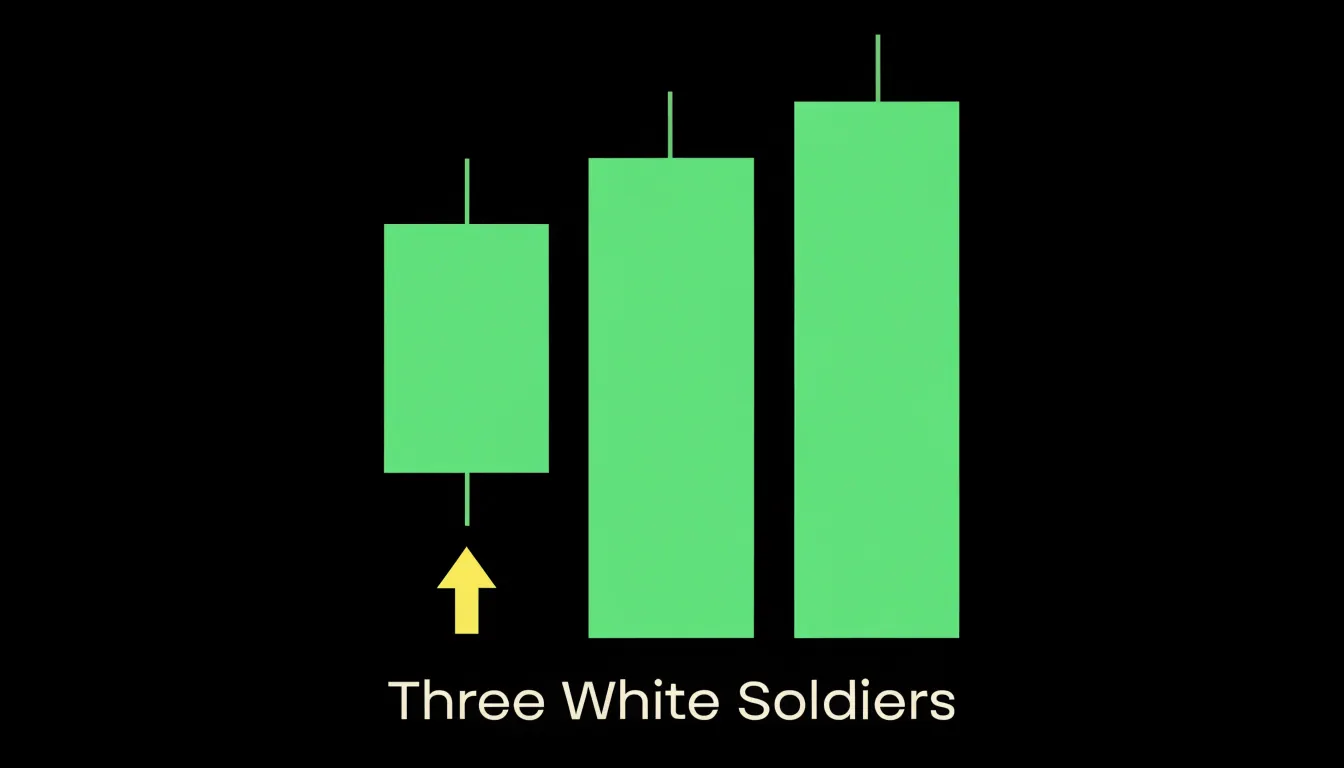
Institutional participation is often inferred from the shape and consistency of these candles. Long real bodies with small, shrinking upper shadows indicate that buying pressure persisted right into the close—a behavior typical of large orders being worked patiently across sessions rather than retail enthusiasm chasing a headline. Successive opens inside the previous body suggest methodical accumulation at rising levels, with buyers absorbing available supply without waiting for pullbacks.
Because the pattern develops over three sessions, it carries more trend-continuation weight than a single engulfing bar. Volume expanding across the three sessions strengthens the signal considerably, pointing to conviction rather than drift. The pattern is most effective when it emerges after a consolidation, a shallow pullback, or a breakout from resistance, confirming that the prior trend is resuming with force. Practitioners typically watch the low of the first candle as an invalidation reference point; a close back below that level suggests the buying campaign has stalled.
Wicks and Key Levels
When a long wick forms at a price level that has previously acted as support or resistance, it indicates that the market tested that level and rejected it. Traders combine wick rejections with key levels to identify high-probability entry and exit points:
- Short entries at resistance: If price approaches a well-established resistance zone and forms a long upper wick, buying pressure was overwhelmed by sellers at that barrier. Traders may enter a short position with a stop-loss placed above the wick’s high.
- Long entries at support: If price drops into a support zone and forms a long lower wick, buyers stepped in to defend the level. Traders may enter a long position with a stop-loss placed below the wick’s low.
- Profit targets: If a trader enters a long position at support, a nearby resistance level—especially one that has previously produced long upper wicks—serves as a logical exit point to take profits before a potential reversal.
Waiting for a wick to form at a level tested multiple times filters out false signals and integrates immediate price action with broader market structure.
Common Mistakes and Practice
Two common pitfalls in candlestick analysis are trading patterns in isolation without market context and over-relying on a single pattern or timeframe. Acting immediately on a doji or engulfing bar without checking whether the broader market is trending or ranging, or ignoring volume and moving averages, leads to false signals and losses.
Building consistent chart-reading skills requires structured practice and backtesting:
- Keep a trading journal: Record each pattern, the surrounding context, and the trade outcome. Review trades weekly to identify recurring errors, such as ignoring volume or forcing trades in choppy, unclear markets.
- Backtest on historical data: Use platform bar-replay features to simulate real-time decision-making across different assets and timeframes. Define clear entry and exit rules, and track win rate, risk-reward ratio, and drawdown.
- Study failures alongside wins: Avoid cherry-picking successful examples; analyze broken patterns to understand why they failed.
- Practice on a demo account: Build pattern recognition without financial risk by focusing on a few high-probability patterns first and mastering their nuances across timeframes.
- Follow a pre-trade checklist: Verify trend direction, key support and resistance levels, volume, and next-candle confirmation before acting. Treating patterns as tools of probability rather than certainty reduces impulsive decisions.
Frequently Asked Questions
What do the open, high, low, and close mean on a candlestick?
The open is the first price traded during the session, and the close is the final price before the session ends. The high is the highest price traded and the low is the lowest; open and close form the body, while high and low are plotted as thin wicks above and below it.
What does a long upper wick tell you?
A long upper shadow indicates that buyers initially drove prices higher, but sellers overwhelmed them before the close, leaving rejected higher prices. It often signals selling pressure near the top and potential weakness.
How does choosing a longer timeframe change a candlestick chart?
Longer timeframes aggregate smaller candles into fewer, larger candles, absorbing noise and making the underlying macro trend easier to recognize. Traders often zoom out to identify the dominant trend on a higher timeframe, then use shorter intervals to time entries and manage risk.
What is a hammer candle and when does it carry more weight?
A hammer has a long lower wick and a small body near the top, appearing when selling pressure drives price lower but buyers push it back near the open. Traders look for it after an extended decline and wait for the following candle to confirm the reversal, ideally by closing above the hammer’s body.
What does a doji candle indicate?
A doji forms when the opening and closing prices are nearly identical, creating a thin body and signaling indecision and a balance of power. It often appears just before a volatility expansion, and traders typically wait for the next candle to close before acting.
Are candlestick patterns guaranteed to work, or can they produce false signals?
The article warns that trading patterns in isolation without market context or over-relying on a single pattern or timeframe can lead to false signals and losses. It says to treat patterns as tools of probability rather than certainty, and practicing on a demo account can build pattern recognition without financial risk.
Tony Astor
Tony writes about data visualization and the tools people use to build charts and dashboards. More about Data Illustrator