Calendar Heatmap: Showing Daily Patterns Over a Year
 By Tony Astor ·
Calendar Heatmap
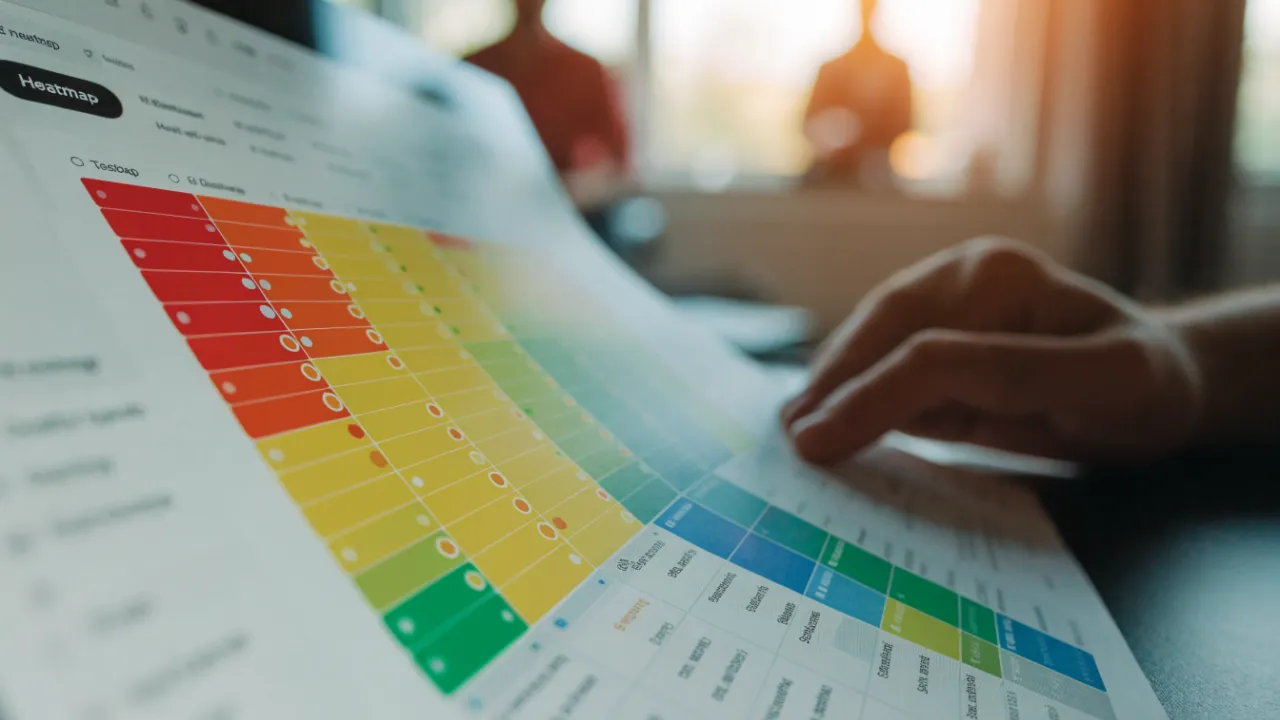
A calendar heatmap is a grid where each cell represents one day of the year and color intensity shows how much activity occurred or whether a daily target was met. Weeks run along the x-axis and weekdays along the y-axis, making streaks, lapses, and seasonal patterns visible at a glance.
Table of Contents
Calendar Heatmap
A calendar heatmap transforms a full year of daily data into a single visual grid, where each cell represents one day and its color intensity reflects whether a target was met or how much activity occurred. The x-axis typically spans weeks and the y-axis spans days of the week, creating a familiar calendar layout that makes patterns of consistency and lapses easy to spot at a glance.
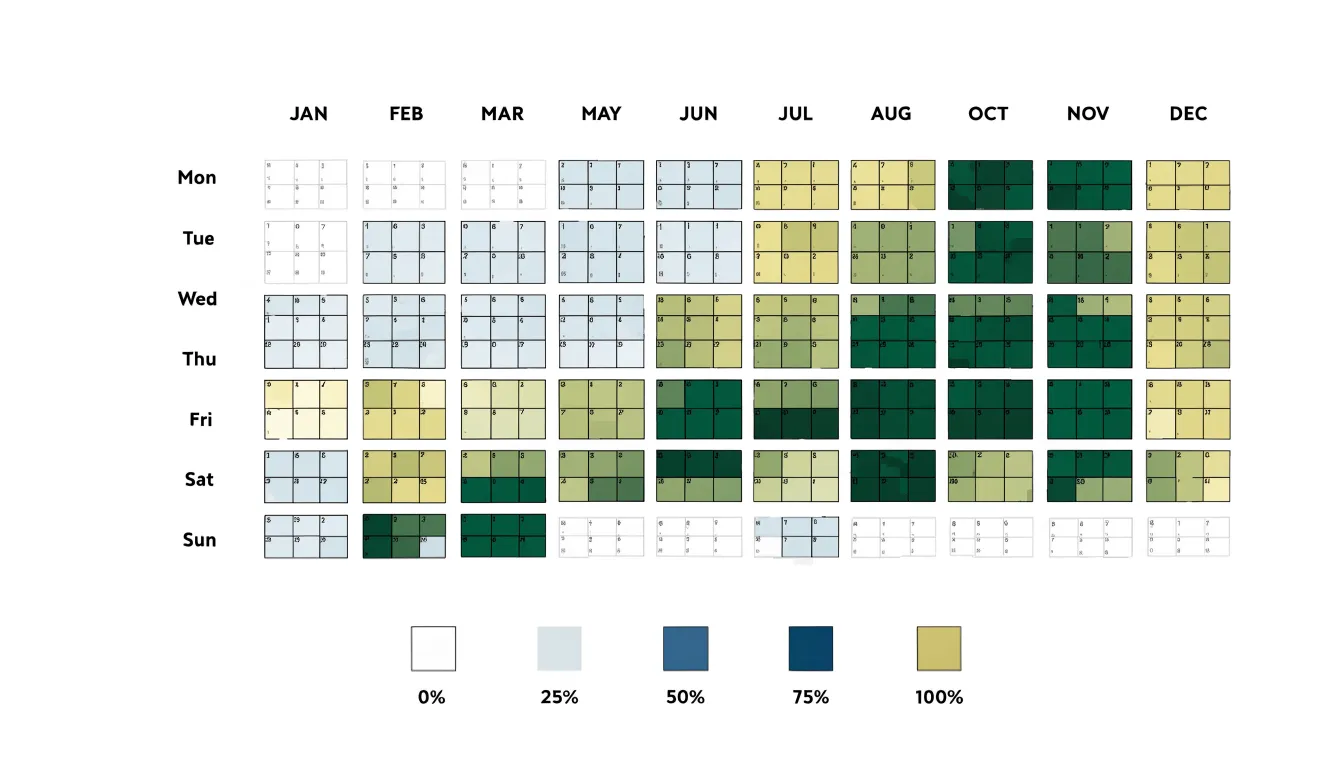
To plot daily target completions, define a success criterion for each day—such as completing at least 30 minutes of exercise or writing 500 words—and record the dates with a boolean or count value in a simple log. You can generate the grid using visualization libraries like Matplotlib or Plotly, or dedicated tools styled after GitHub’s contribution graph. Assign a color scale where lighter shades indicate lower completion and darker shades indicate higher completion or full success.
To track consistency over extended periods, calculate current and longest streaks programmatically and display these metrics alongside the chart, adding annotations for milestones. Reviewing the heatmap weekly or monthly helps maintain momentum by making progress tangible.
Color Intensity
Color intensity is the primary visual channel through which a calendar heatmap communicates magnitude. Each day is filled with a shade from a gradient scale, typically running from a pale, near-background tone at the low end to a saturated, deep tone at the high end. Because the gradient is applied consistently across the grid, the mapping between shade and quantity stays stable, making comparisons between distant dates meaningful.
This approach relies on how human perception handles ordered variation. Lighter shades recede visually, reading as low presence, while darker shades advance and draw attention. High-output days announce themselves without requiring labels, tooltips, or numeric annotations. A dense cluster of dark squares signals a period of sustained effort, while scattered pale squares convey rest, gaps, or minimal engagement.
The gradient can be built from discrete steps of a single hue or continuous interpolations across a color range. Discrete steps aid quick categorization by grouping values into recognizable bands, while continuous scales preserve finer distinctions between adjacent days. Whichever construction is chosen, anchor the scale to the data’s actual range so that the midpoint of the gradient corresponds to a meaningful middle value rather than an arbitrary one. Always include a legend showing sample swatches alongside the values they represent.
Daily Patterns
Daily patterns emerge when calendar heatmaps are read across weeks rather than within a single month. The eye naturally groups rows of similarly shaded cells into columns, exposing the weekday effects that drive most knowledge work. A user scanning twelve weeks of GitHub commits or habit tracking data might notice that Mondays and Tuesdays glow bright while Thursdays and Fridays fade toward pale squares.
Cluster analysis strengthens this reading by flagging contiguous runs of intense color. A three-day streak of dark cells early each week points to a predictable productivity surge, useful for scheduling demanding work. Conversely, a recurring pocket of light cells in the middle of the week signals an energy slump. These mid-week burnout trends often appear as a V-shaped dip: strong Monday, weaker Tuesday, hollow Wednesday, partial recovery Thursday. Once the shape is recognized, deep work can be front-loaded, meetings shifted into the dip, and recovery blocks placed where the heatmap consistently cools.
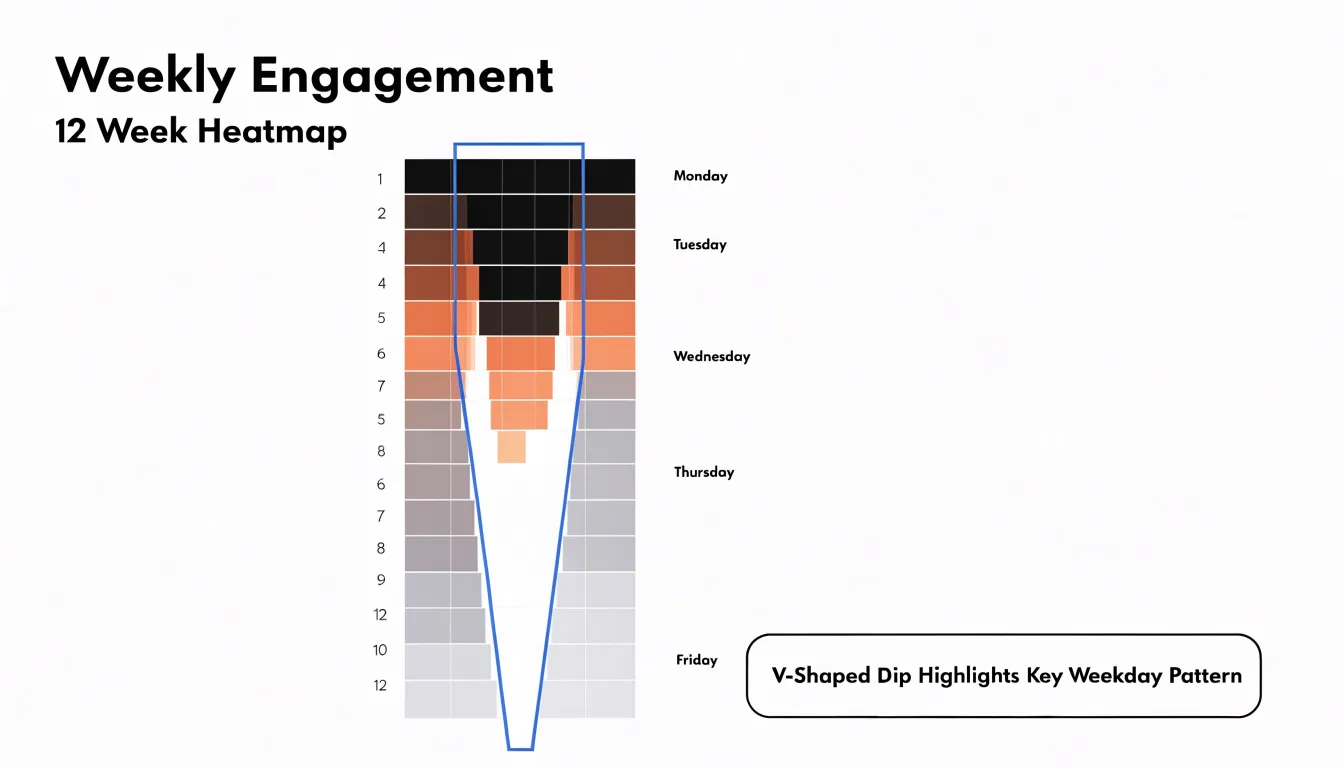
A single dark cell is a busy day, whereas a dark column repeated across many rows is a structural pattern. Treating the heatmap as a longitudinal sample separates random noise from genuine cycles, allowing you to build a schedule that matches real energy rather than idealized intentions.
Habit Streaks
When colored cells line up in an unbroken run, they form a visible streak that measures how strongly a habit has taken hold. A single square shows an action happened once; a chain shows the behavior survived weekends, travel, deadlines, and low motivation. For tracking behavioral retention, streak length offers a signal of consistency that raw totals obscure. Two users might each log 20 exercise sessions over a month, but one who spread them evenly across the weeks has built a more durable routine than one whose 20 sessions came in a burst followed by long gaps.
Streaks also serve as a diagnostic tool. When a run breaks, a gap that appears at the same point across several streaks points to a recurring weak spot: perhaps Mondays after a disrupted weekend, or the third week of a new routine when initial enthusiasm fades. Rather than guessing why a routine failed, a user can look at where the color stopped and connect that moment to a specific context.
Seeing a long chain of colored cells often motivates users to protect it, reinforcing the behavior. When a streak does end, the heatmap shows the full history of prior runs, framing a single missed day as a small interruption within a larger record of consistency rather than a total failure. This perspective helps users resume the habit quickly instead of abandoning it.
Seasonal Shifts
Laying out a full year of activity reveals shifting intensity across quarters that summary statistics often hide. Darker clusters in winter months and lighter stretches in midsummer reflect how weather and daylight shape daily routines at a macro level, influencing when people leave the house, how much they move, and how consistently they keep to habits.
Many people report lower motivation and slower starts during colder, darker months, which the heatmap turns into a visible seasonal dip. Exercise consistency follows a similar arc: warmer quarters often show denser streaks of logged workouts and outdoor activity, while winter quarters show more gaps as short daylight hours and poor weather push routines indoors or displace them entirely. Mapping these fluctuations across quarters separates genuine seasonal affective patterns from one-off disruptions like holidays or illness.
Placing quarters side by side clarifies which months consistently underperform and which rebound reliably. This supports practical planning, such as scheduling lighter goals during known low-energy periods or building indoor alternatives before the cold season arrives. It also gives context to sluggish weeks that might otherwise look like personal failures when they are part of a larger environmental cycle.
Weekend vs Weekday
Comparing weekdays and weekends turns abstract questions about work-life balance into something measurable. Structured workdays (Monday through Friday) tend to produce dense, predictable blocks of meetings, focused work sessions, commutes, and recurring commitments. Weekend days often show a very different texture: some cells go quiet entirely for rest, while others light up with errands, social plans, hobbies, or spillover catch-up work.
This comparison reveals patterns that are hard to notice day to day. A heatmap might show that weekends are not restful at all, filled instead with a different kind of busyness that leaves little room for recovery. It might show that weekday evenings are consistently overloaded while weekend mornings stay open, suggesting where to shift commitments. Or it could highlight a healthy alternation between intense productive days and open ones.
Active recovery depends on this contrast being real. When weekend schedules mirror the structure and pressure of the workweek, the body and mind never get a change of pace. Evaluating these contrast patterns over several weeks helps you guard open blocks on weekends and redistribute tasks that crowd recovery time.
Layered Heatmaps
Layered heatmaps stack several data tracks on the same date grid, aligning metrics like sleep duration, stress levels, mood, and output in parallel rows beneath a shared calendar. Each row keeps its own color scale, allowing the eye to move vertically through a single date and read the full state of that day at once.
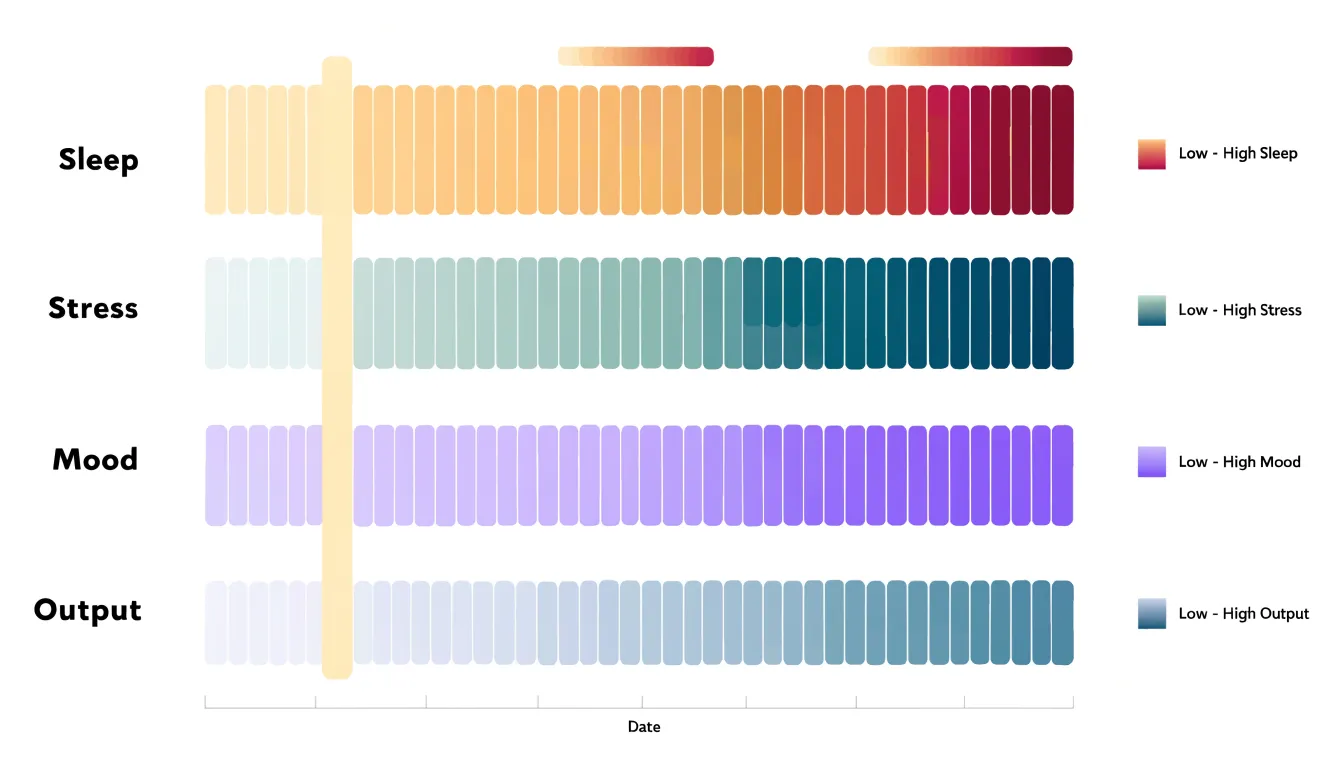
Analytical power emerges when patterns in one row mirror or oppose patterns in another. A stretch of pale sleep cells followed two or three days later by a cluster of dark stress cells and a drop in output reveals a lagged relationship that would be invisible if each metric were examined in isolation. Similarly, periods of high mental well-being often coincide with moderate stress and steady sleep, showing how well-being depends on combined factors.
Building these layers requires precise alignment:
- Date ranges must match exactly.
- Missing days should be rendered as neutral or hatched cells rather than zeros.
- Each track needs its own legend.
- Rows should be ordered deliberately—placing physical recovery metrics near the top, mental and emotional indicators in the middle, and output measures at the bottom to mirror the causal flow analysts usually want to test.
Interactive versions can let users toggle individual layers or highlight a single day to compare all values side by side.
Hidden Triggers
Subtle lifestyle factors often operate below daily awareness, yet their cumulative effect on focus and routine can be profound. By tracking performance metrics alongside lifestyle variables, a heatmap exposes hidden correlations by linking sudden drops in output with seemingly innocuous habits.
For instance, a late night might not immediately disrupt the following day, but the grid could reveal a consistent two-day lag before a sharp decline. Similarly, skipped meals may not register as an immediate cause, but over weeks, days with missed lunches may cluster around periods of low output. Cross-referencing low-performance clusters with notes on sleep, meals, or other routines uncovers highly individual triggers. Once identified, these can be addressed through small adjustments, such as setting a consistent bedtime or planning regular meals.
Choosing Metrics
Deciding what each square represents determines whether the finished chart is a useful instrument or a decorative wall of color. The most reliable starting point is a metric that can be captured in a few seconds at the same time each day with a clear daily boundary, resolving to one unambiguous entry rather than a running total.
- Binary metrics: Questions like “Did I read for 20 minutes?”, “Did I exercise?”, or “Did I write in my journal?” resolve to a simple yes or no. This keeps the logging burden near zero and makes patterns easy to interpret, though it flattens nuance so two very different days look identical.
- Measurable scale metrics: Tracking pages read, minutes exercised, or glasses of water maps each square to a color gradient. This preserves variation at the cost of a slightly heavier logging step and the need to define thresholds in advance. A common middle path is logging a single number and letting the software assign the gradient.
Above all, pick a metric where seeing a run of empty squares would actually prompt a behavior change. Start with one or two metrics to keep logging sustainable; additional rows can be added once the first heatmap has proven its worth over a month or two.
Color Palettes
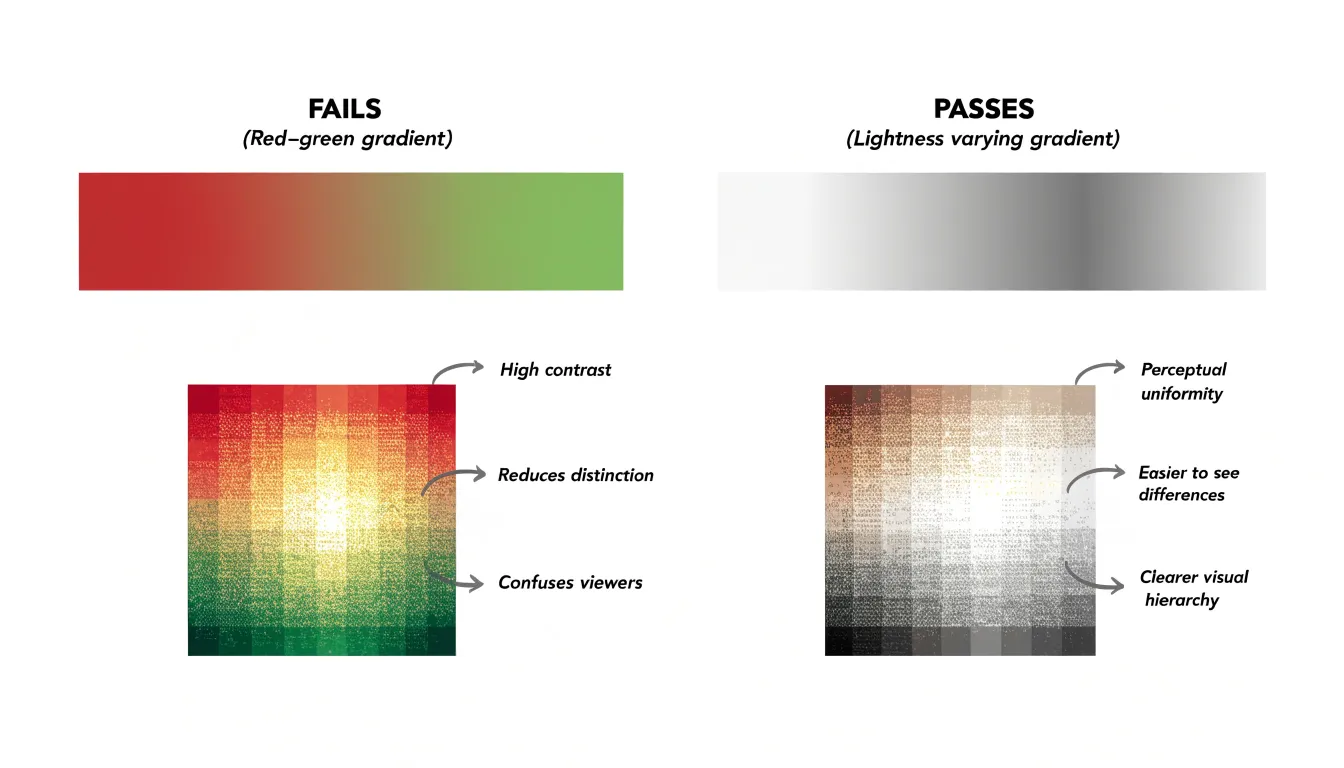
A well-designed color palette allows a reader to scan hundreds of cells and instantly grasp relative intensity, whereas a poor choice forces conscious decoding.
- Sequential gradients: Move smoothly from a light, low-saturation hue for low values to a darker, more saturated version of the same hue for high values. Warm or cool ramps (familiar from weather maps) reduce mental effort.
- Perceptual uniformity: Use palettes derived from established scientific color maps so lightness changes evenly across the spectrum, avoiding misleading visual jumps.
- Accessibility: Roughly one in twelve men has some form of color vision deficiency, so palettes relying solely on red-green distinctions fail a meaningful share of readers. Varying lightness alongside hue keeps the gradient legible for everyone.
- High contrast: Ensure the lightest cell remains distinguishable from the background and the darkest cell retains visible separation from adjacent cells, preventing small squares from blurring together under varied screen lighting.
Tracking Fatigue
Daily logging can become a source of quiet stress when it shifts from a helpful routine into a heavy obligation. To prevent tracking fatigue, set a sustainable pace and give yourself permission to log only the essentials on busy days—a short note and a single number are often enough.
Build in regular rest by choosing one day each week to not log at all, or to only glance at entries without recording anything new. Treating that pause as part of the system keeps it from feeling like a lapse.
Guard against metric fixation, which creeps in when a number becomes the whole story. If a value dips, ask what happened around it rather than whether you failed, shifting attention from the figure to the context. Watch for signs of exhaustion such as dread before logging or guilt after missing a day. When those appear, reduce fields, shorten the time spent, or pause the habit for a few days.
Data Cleanup
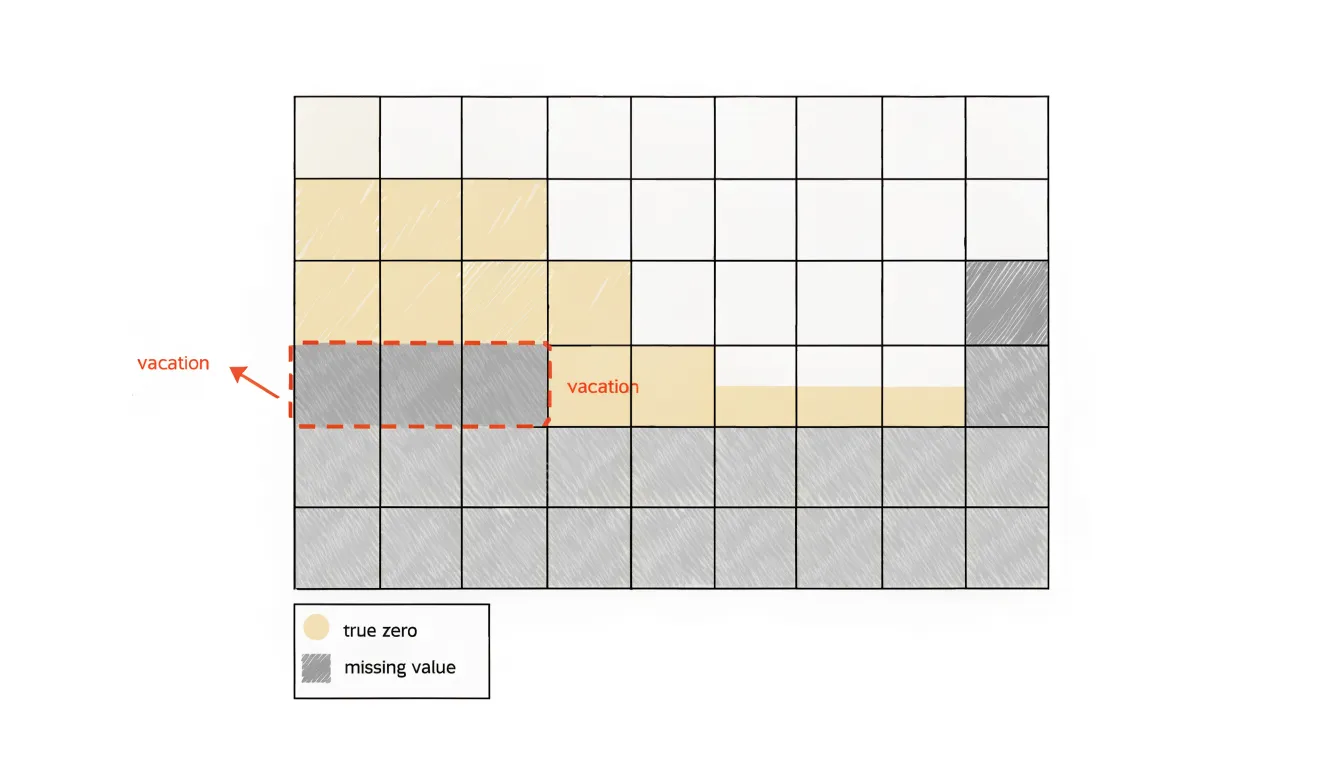
In a raw dataset, a day with a genuine value of zero and a day where no data was recorded look identical, yet they carry very different meanings. A zero-value day represents real activity that produced nothing, while a missing entry represents an absence of measurement. Treating both as zero drags down averages and creates false downward trends.
Apply clear cleanup rules so patterns reflect real behavior:
- Missing days: Mark unrecorded days with a distinct neutral shade or light hatch pattern so the eye reads them as gaps rather than low activity.
- Planned absences: Annotate vacation periods or holidays directly on the calendar so a two-week break in daily commits or sales does not look like a sudden collapse.
- Days in progress: Exclude the current, incomplete day from trend calculations, or display it with partial opacity.
- Summary statistics: Filter out missing and partial days rather than imputing zeros. If imputation is necessary for continuity, document the method and flag imputed cells visually.
- Color scaling: Keep scaling consistent across the full date range, as rescaling around gaps can exaggerate their apparent severity.
Midyear Adjustments
Six months of heatmap data provides an empirical foundation for recalibrating personal expectations. By examining the density and distribution of activity, you can identify your actual baseline—the median number of daily actions consistently achieved—rather than relying on aspirational guesses.
Use this baseline to modify daily thresholds. If you rarely meet a target of five tasks per day but consistently hit three, adjusting the threshold to three or four reduces frustration. You can also set adaptive thresholds that vary by context, such as lower targets on busy weekdays and higher ones on weekends.
Midyear data also refines long-term objectives by projecting realistic annual outcomes. If your heatmap shows an average of four activities per day, a yearly goal of 1,500 activities is grounded in evidence, whereas aiming for 2,000 would require a significant, potentially unsustainable increase. Finally, spotting areas of neglect allows you to reallocate effort from one habit to another or introduce new routines to fill gaps.
Sharing Progress
Posting a weekly or monthly screenshot of a calendar heatmap turns a private habit into a visible commitment, creating social accountability that private tracking cannot replicate. Because the grid communicates progress at a glance, friends, colleagues, or accountability group members can immediately see how far you have come and where gaps appeared. That public record creates gentle pressure to keep the pattern intact.
In accountability groups, members often post screenshots on a fixed schedule. A newcomer seeing someone else’s dense block of filled squares sees visual evidence that steady effort accumulates over time. Screenshots also invite specific feedback: a peer might notice a consistent midweek dip and suggest a schedule adjustment, or congratulate you on a personal record streak.
Sharing is also a way to celebrate milestones, such as reaching 100 consecutive days or completing a full quarter of entries. Capturing the image encourages you to review your own data beforehand, and over months, the shared screenshots form a visual diary documenting seasons of momentum and recovery.
Dashboard Overview
Once a full year of activity is visible in a single dashboard view, synthesize those patterns into concrete workflow and lifestyle modifications. Write a short summary of dense clusters (which reveal the conditions under which your best work happens) and empty stretches (which point to fatigue, competing obligations, or dropped routines).
Translate these observations into specific changes:
- If midweek productivity is consistently strong, protect those days from meetings and administrative tasks, batching shallower work into quieter periods.
- If output drops sharply after long uninterrupted streaks, introduce deliberate rest before the decline appears.
- If steady weekday activity pairs with scattered weekend entries, rebalance your schedule to prevent overextension and protect recovery habits.
Choose one or two small modifications at a time, define what success looks like on the grid, and revisit the annual view monthly to confirm the change is holding. Over successive cycles, the map becomes a record of intentional iteration rather than passive tracking.
Frequently Asked Questions
What is a calendar heatmap used for?
A calendar heatmap turns a full year of daily data into a single grid where each cell is one day and color intensity shows whether a target was met or how much activity occurred. It helps make patterns of consistency and lapses easy to spot at a glance.
How do I choose what to track in a calendar heatmap?
Start with a metric you can capture in a few seconds at the same time each day with a clear daily boundary and one unambiguous entry. Binary yes/no metrics keep logging easy, while scale metrics preserve variation but require thresholds; start with one or two metrics to keep logging sustainable.
How can a calendar heatmap reveal weekday patterns?
Reading across weeks exposes weekday effects, such as Mondays and Tuesdays being bright while Thursdays and Fridays fade. Cluster analysis can flag contiguous runs of intense color and recurring light pockets, including a V-shaped mid-week dip.
What do streaks tell you in a habit heatmap?
An unbroken run of colored cells shows how strongly a habit has taken hold and measures consistency that raw totals can obscure. When a streak breaks, looking at where the color stopped can point to a recurring weak spot; seeing prior runs frames one missed day as a small interruption.
How should I handle missing days versus zero-value days in a heatmap?
A zero-value day represents real activity that produced nothing, while a missing entry means no measurement was recorded. Mark missing days with a distinct neutral shade or hatch pattern, annotate planned absences, and filter out missing and partial days rather than imputing zeros.
How can I prevent tracking fatigue?
Set a sustainable pace and give yourself permission to log only essentials on busy days, such as a short note and a single number. Build in regular rest—like one day each week with no new logging—and watch for signs such as dread before logging or guilt after missing a day; if those appear, reduce fields, shorten logging time, or pause for a few days.
Tony Astor
Tony writes about data visualization and the tools people use to build charts and dashboards. More about Data Illustrator