Butterfly Chart: Comparing Two Groups Side by Side
 By Tony Astor ·

Butterfly Chart
A butterfly chart displays two related datasets as horizontal bars extending left and right from a shared central column of category labels, letting viewers compare paired values row by row at a glance. Bar length encodes each value from a common zero baseline, and population pyramids are a common example comparing males and females across age groups.
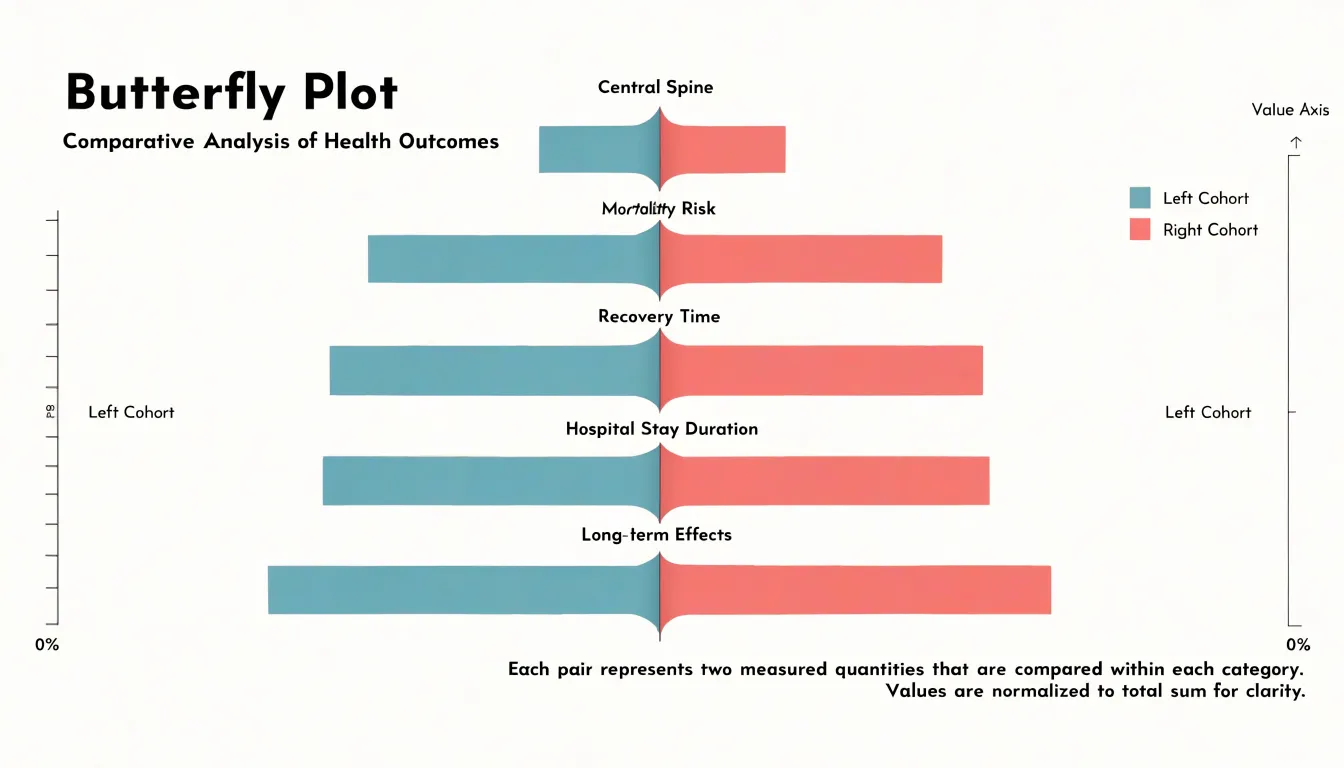
Table of Contents
Butterfly Chart
A butterfly chart arranges horizontal bars on either side of a shared central column, allowing two related measures or categories to be compared at a glance. Down the middle runs a vertical spine listing the categories, labels, or entities being examined—such as age groups, product lines, or regions. Bars for one dataset extend horizontally to the right, while bars for a second dataset extend to the left. Because each row aligns with a single item in the central column, the opposing bars sit opposite one another like a pair of wings.
Values are encoded by bar length, measured outward from the shared middle rather than from a common outer edge. Because both sides spring from the same vertical spine, the eye can sweep down the center and compare paired bars row by row without jumping between separate charts.
This layout suits side-by-side comparisons of two populations or two time periods, such as men and women within each age bracket, or imports against exports for each trading partner. Designers often mirror the horizontal axes so that both sides read as positive quantities, using the direction of extension rather than a plus or minus sign to distinguish the two datasets.
Anatomy
The butterfly chart’s structure relies on three core components:
- Central spine: A vertical line or column of concise category labels at the midpoint that identifies the groups being compared without requiring separate lists.
- Flanking numerical axes: Two horizontal axes, one on the far left and one on the far right, that measure values for their respective sides. These axes are typically symmetrical, using identical scales and tick marks so bar lengths remain directly comparable, though they can be adjusted to highlight specific differences.
- Mirrored horizontal bars: Paired bars sharing the same vertical row position and extending outward from the center.
This symmetry is functional rather than merely aesthetic: it draws the eye to the midline and allows quick visual scanning of imbalances between the two groups, whether in population pyramids or paired survey results.
When to Use It
Butterfly charts work best when two groups are measured across an identical set of categories, making each row a genuine side-by-side pairing rather than two unrelated distributions pushed together. The chart loses clarity when categories differ between sides or when more than two groups need representation.
Common applications include:
- Binary group analyses: When a population splits cleanly into two segments—such as male and female respondents in a demographic study—each segment occupies its own wing while sharing the central category labels.
- Pre- and post-test results: Measuring the same subjects before and after an intervention produces matched categories. Categories that grow after the test extend further on the post side, while those that shrink recede, showing program impact without requiring two separate charts.
- Competing product evaluations: When two products, brands, or vendors are rated across common attributes, asymmetries between the wings reveal differences in satisfaction, feature preference, or perceived value faster than clustered bars or parallel tables. The central list also keeps long sets of evaluation criteria compact.
Butterfly vs. Tornado Chart
The tornado chart and the butterfly chart both use horizontal bars and a symmetrical silhouette, but they organize information differently.
A tornado chart is a ranking device used in sensitivity analysis. It orders variables from top to bottom by impact, placing the most influential driver at the top with subsequent bars shrinking toward the bottom. Each bar’s length shows how much an output moves when a given input changes. Because this ranking derives from the data, the vertical sequence of rows shifts whenever the underlying model or assumptions change, requiring the chart to be rebuilt for each new analysis.
A butterfly chart keeps categorical alignment fixed. Two cohorts sit on opposite sides of the central axis, and the vertical ordering follows a stable scheme—such as alphabetical sequence, geographic convention, or an established reporting standard—so rows keep their positions across editions.
Choose a tornado chart to answer questions about priority and show which variables drive an outcome most strongly. Choose a butterfly chart to answer questions about composition and show how two populations differ across a stable set of categories.
Population Pyramids
Population pyramids are among the most recognizable butterfly charts. The vertical axis lists age cohorts, typically in five-year bands from the youngest at the base to the oldest at the top, while the horizontal axes measure population counts or normalized percentages (which allow comparisons between populations of very different sizes). With males on one side and females on the other, the chart shows how age and gender distributions intersect within a region or time period.
The overall silhouette reveals demographic structure:
- Broad base tapering to a narrow top: Indicates a young, rapidly growing population with high birth rates.
- Narrow base with wider middle sections: Suggests an aging population with declining fertility.
- Left-right symmetry or asymmetry: Highlights gender balance at each age band, or draws attention to differences in mortality, migration, or social conditions affecting one gender more than another.
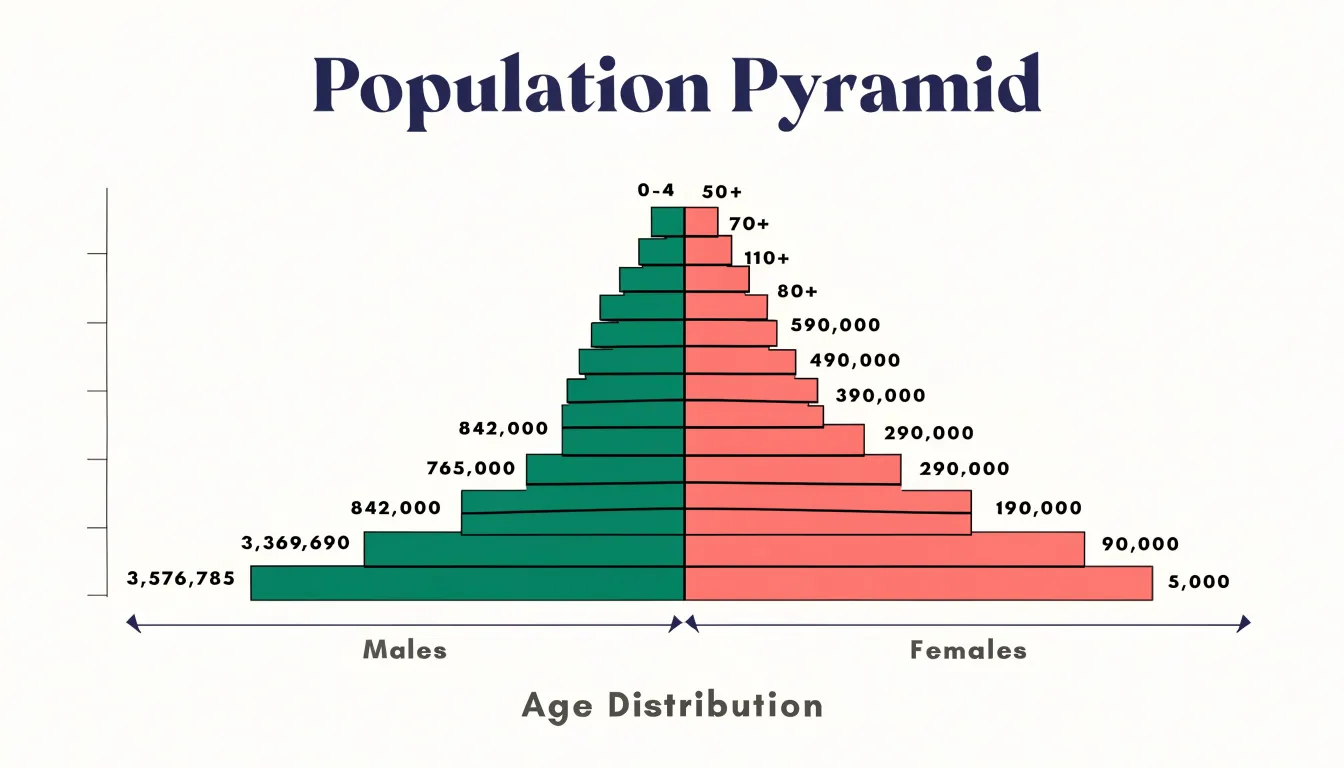
Because cohorts are stacked vertically, analysts can trace how a large cohort moves upward over successive time periods, or place pyramids side by side to contrast urban and rural demographics.
Survey Results
Butterfly charts are well suited to survey results built on Likert scales and satisfaction metrics. When two cohorts—such as new and returning users—are placed on opposite sides of the central spine, the spine holds the ordered response categories (from strongly disagree through strongly agree) or survey items, and diverging bars show each group’s distribution.
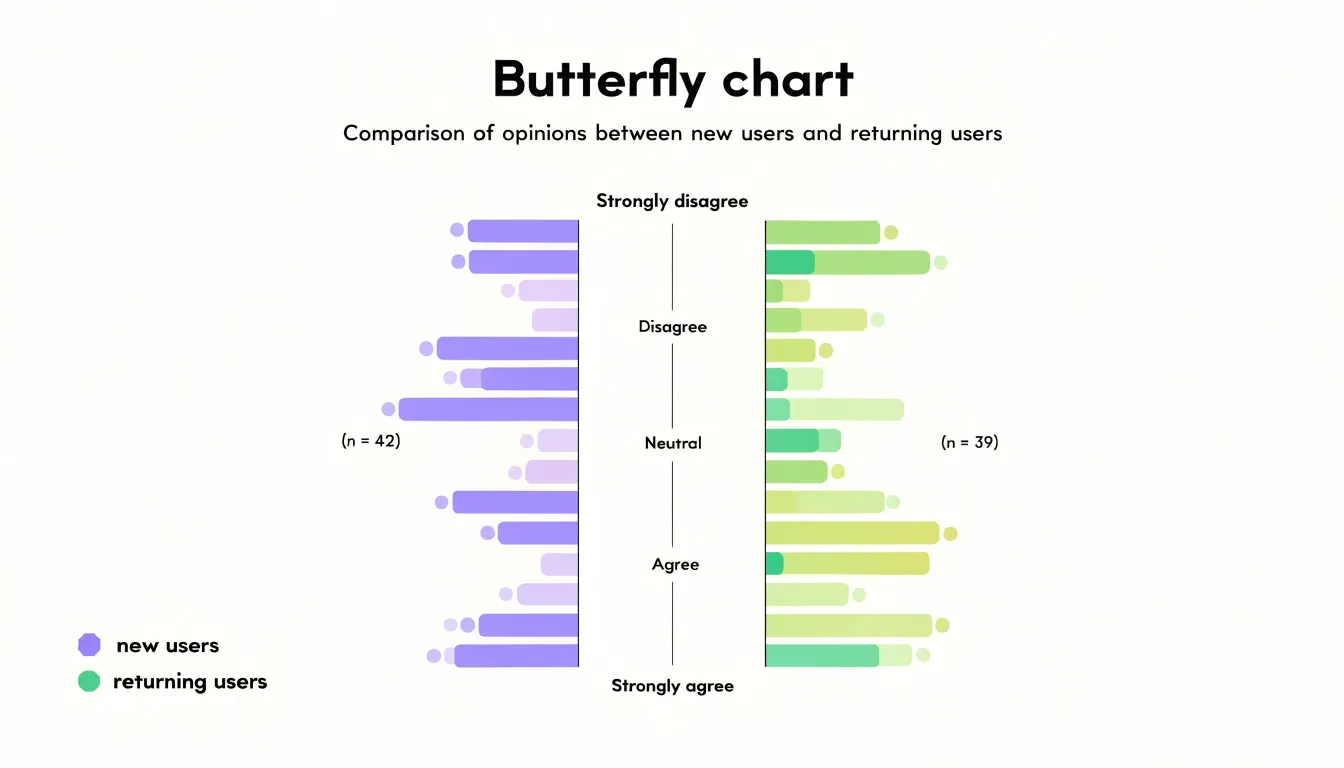
This structure serves several common survey comparisons:
- Product teams evaluating whether first-time buyers find onboarding clear compared to long-term customers who navigate by habit.
- Support organizations comparing how new and returning customers rate response times.
- Marketing groups contrasting brand perception between prospects and loyal users.
Forcing both cohorts onto identical response anchors highlights subtle distribution patterns—such as one group clustering around neutral answers while the other spreads toward the extremes, or a shared skew indicating an issue that affects everyone regardless of tenure. Pairing the chart with the underlying sample sizes gives audiences the context needed to interpret these gaps responsibly.
Market Research
In market research, butterfly charts contrast two buyer personas or competing products across shared attributes:
- Brand affinity: Rows can plot the percentage of Persona A (left) and Persona B (right) expressing strong loyalty, familiarity, or willingness to recommend.
- Feature preference: Rows show the share of each group ranking a capability as essential, helping product teams spot features that are table stakes for one segment, a differentiator for another, or ignored by one side entirely.
- Purchasing habits: Rows capture purchase frequency, preferred channel, price sensitivity thresholds, or average order value bands.
Sorting rows by the magnitude of the gap between wings—rather than alphabetically—draws immediate attention to the most decision-relevant differences during segmentation, positioning, and competitive benchmarking discussions. Annotations calling out the largest asymmetries further speed up stakeholder review.
Data Setup
Prepare your raw data in a clean, rectangular table before building the chart:
- Create the shared category column: Place the category labels (product lines, regions, or survey questions) in the first column, using one row per category. Keep spelling and capitalization consistent so the charting tool matches each category to its values without error.
- Add two cohort value columns: To the right of the categories, create one column for each group (e.g., “Group A” and “Group B”). Keep all values in the same unit of measure and sign convention.
- Fill empty values with zeros: Where a category has no data for one cohort, enter
0rather than leaving the cell blank to keep row counts aligned and prevent plotting errors. - Remove structural clutter: Avoid merged cells, subtotals, or decorative formatting inside the data range, as these disrupt the row-and-column structure charting tools expect.
- Sort the rows: Order the table by a meaningful measure, such as total magnitude or alphabetical order, so the shared category column stays synchronized with both value columns.
Axis and Color Choices
Both horizontal wings must share the same scale, tick spacing, and zero baseline so that a bar extending twice as far on one side represents twice the quantity. Labeling the zero line once at the center reinforces this shared baseline.
Color choices should distinguish the two cohorts without overwhelming the reader:
- Complementary or contrasting palettes: Pair a warm hue with a cool one, or a saturated tone with a lighter tint from a different color family, to give each side a distinct identity.
- Focal accenting: Reserve a single accent color for the category of greatest interest and use a muted neutral for the other to direct the eye.
- Visual consistency: Use the same color for the same cohort throughout the chart, keep the center line visually dominant as the shared reference, and avoid adding extra hues that compete with the two primary groups.
Test the finished figure at a glance—ideally with someone unfamiliar with the data—to confirm the colors clarify the contrast rather than merely decorating it.
Labeling
Because a butterfly chart splits attention between a central spine and two wings, every label needs deliberate placement:
- Data labels: Place values on the outer edge of each wing, just beyond the bar tip, so numbers read outward from the center. When bars are short, place the label just inside the tip to keep it attached to its mark without crowding the axis line. Keep label alignment consistent down each side so the eye can scan the numbers as a column.
- Axis titles: Because the central spine already names the rows, place horizontal axis titles at the outer ends of the horizontal scales—one per side—showing units and measures directly. Keep tick marks and gridlines light or drop them entirely, as the mirrored bars provide enough structure.
- Legends: A single shared legend in the middle can imply symmetry that the data does not support, especially if the wings represent different measures. Place separate legend entries near the wings they describe, matching the bar colors exactly, or rely on direct labeling at the wing ends.
- Central spine clearance: Leave the narrow corridor where the two halves meet empty except for the row names, keeping all values and annotations on their respective wings.
Excel
To build a butterfly chart using Excel’s native formatting tools:
- Prepare the data: Set up a two-column data range with one column holding positive values and the other holding the values to display in the opposite direction.
- Insert the base chart: From the Insert tab, insert a standard clustered bar chart with both columns selected as series.
- Split the axes: Right-click the series that should extend leftward, open Format Data Series, and under Series Options set Plot Series On to Secondary Axis.
- Reverse the secondary scale: In the Axis Options panel, set the horizontal axis bounds so both the primary and secondary axes run from zero to the same maximum, then set the secondary axis to display in reverse order so its bars grow leftward from the center.
- Align the category spine: Hide the secondary vertical axis by setting its labels to None, and format the primary vertical axis to display the categories in the center.
- Format negative labels as positive: If using negative numbers to reverse a series, select the axis or data labels on the reversed side, open Format Cells, and apply a custom number format such as
0;0to display absolute values while preserving the underlying numbers. - Clean up the styling: Apply distinct fill colors to each series, remove gridlines and chart borders, adjust the gap width so the bars meet cleanly at the center, and add data labels with matching custom formats.
Tableau
To build a butterfly chart in Tableau:
- Create directional measures: Prepare two measures to flank the central category axis by creating a calculated field for each side—a positive version of one measure and a negative version of the other.
- Place pills on shelves: Drag the category dimension to the Rows shelf and both calculated measures to the Columns shelf, which initially produces two side-by-side bar charts.
- Merge onto a dual axis: Right-click the second measure’s pill on the Columns shelf, select ‘Dual Axis’, and synchronize the axes to overlay the bars on the same horizontal plane.
- Reverse the negative axis: Right-click the axis for the negative measure, select ‘Edit Axis’, and check ‘Reverse’ so those bars extend leftward from the center.
- Standardize and style: Set symmetric axis ranges, hide the zero line, and assign distinct colors to each measure.
- Center the labels in a dashboard: If you prefer a central spine over left-aligned row headers, combine sheets in a dashboard using vertical containers—either placing a dedicated label sheet alongside the chart or positioning side-by-side containers so the category names sit between the opposing bars.
Common Pitfalls and Scale Standardization
Several common design errors undermine the visual honesty of a butterfly chart:
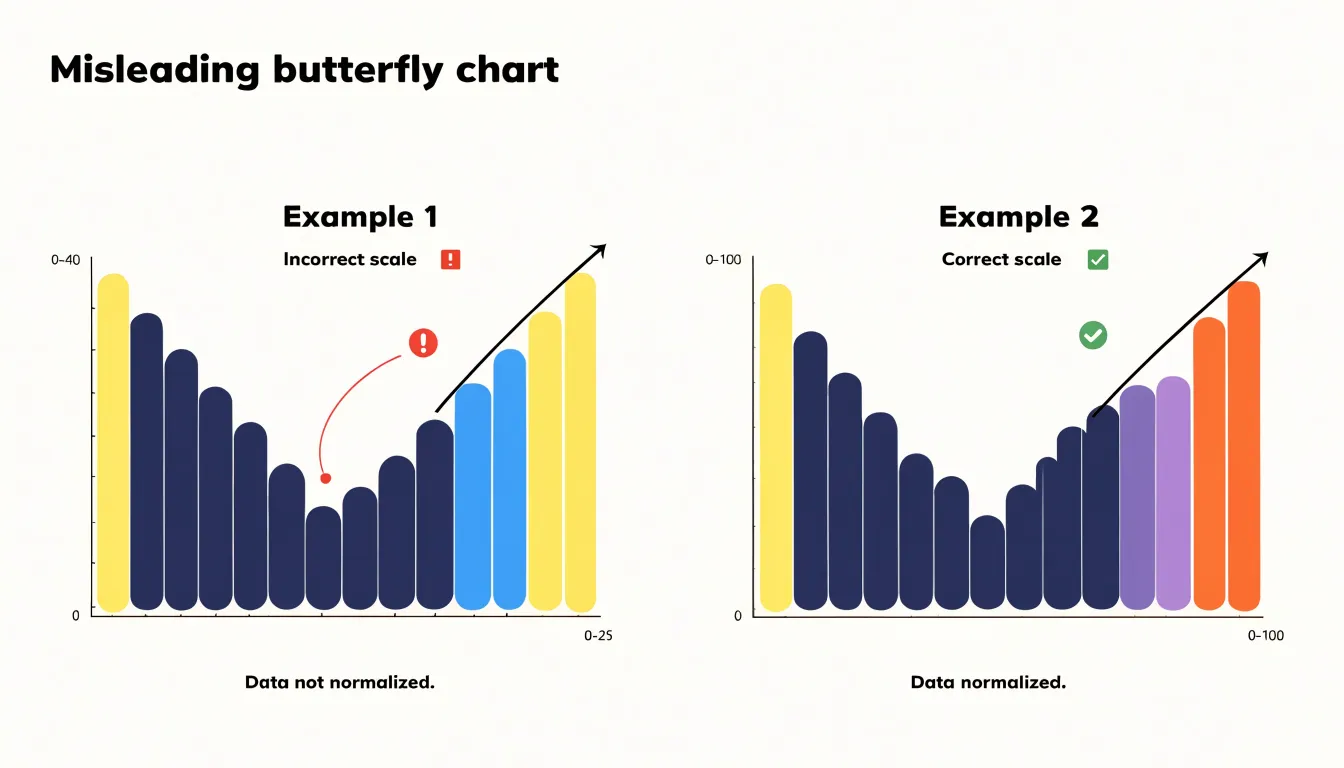
- Unstandardized axis ranges: Allowing the left and right axes to use independent ranges—for instance, when one cohort peaks at 40 and the other at 25—makes equal bar lengths represent unequal quantities. Always find the maximum absolute value across both datasets and apply it symmetrically to both axes. If one side genuinely requires a wider range, flag and annotate the asymmetry explicitly.
- Broken proportionality: Starting bars from a non-zero baseline, truncating bars, or scaling marks by area rather than length distorts perceived magnitude, with errors growing more severe further from the origin. Keep scaling zero-anchored and linear.
- Category overload: Cramming dozens of categories onto the vertical spine turns bars into slivers and crowds labels into noise. Group minor categories, filter to the most consequential items, or split the display across multiple charts to keep the comparison legible.
Interactive and Mobile Adjustments
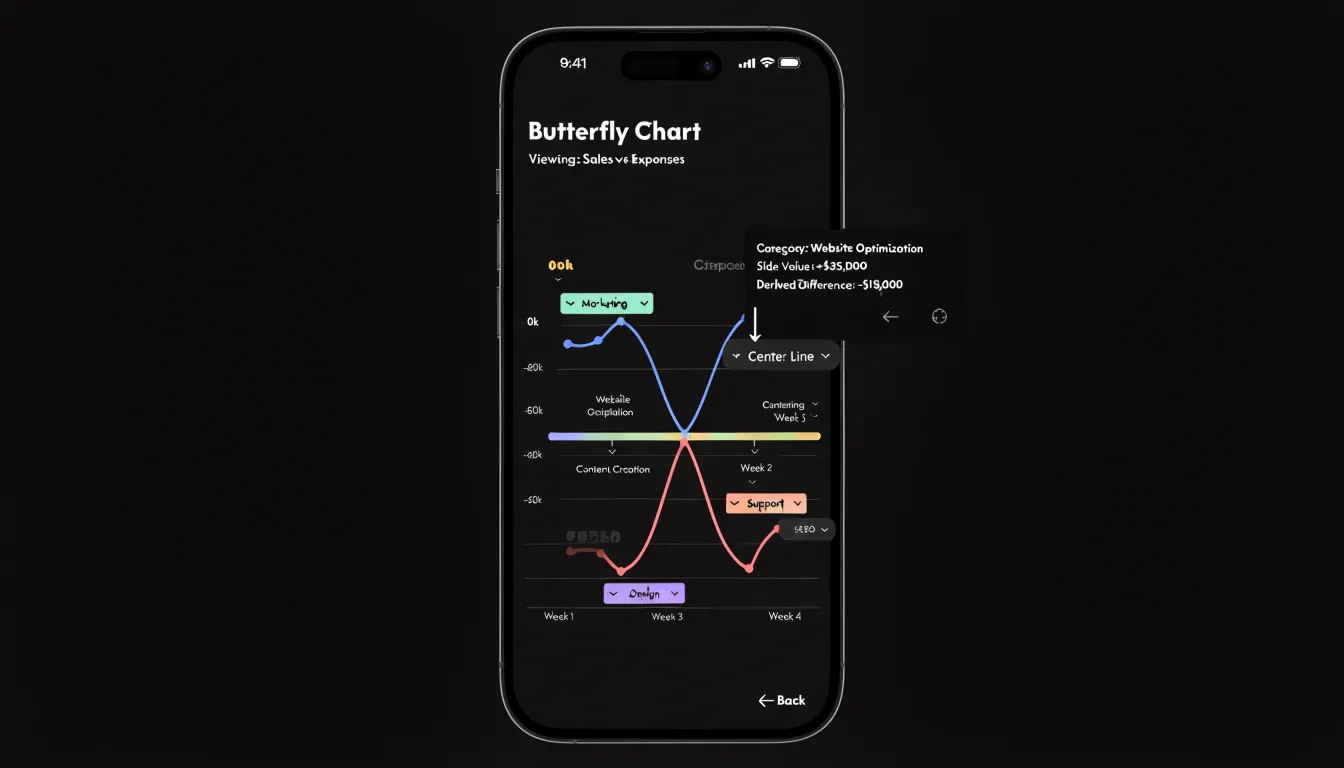
Adapting a butterfly chart for smaller screens and touch devices requires rethinking how information is revealed rather than simply shrinking the desktop graphic:
- Dynamic tooltips: Because touch screens lack a hover pointer, use tap and long-press gestures to trigger tooltips positioned near the touched bar, dismissing them on an outside tap. Include the category label, the side’s value, and the derived difference between wings so the reader gets the full comparison without cross-referencing a legend.
- Collapsible categories: When vertical space is tight, group related rows under expandable headers that default to a compact state on mobile. Display a count of hidden entries on each header, and animate the bars into place when a reader expands a group.
- Vertical scrolling with sticky references: Instead of compressing bars horizontally on narrow viewports, place the chart in a taller scrollable container with generous tap targets and responsive typography. Use sticky axis labels, a fixed center reference line, and scroll snapping between category groups so readers keep their bearings as they scroll.
Case Studies and Final Design Checklist
Beyond demographics, survey research, and market benchmarks, butterfly charts appear in public health dashboards contrasting vaccinated and unvaccinated groups across age bands to highlight risk concentrations, and in budget analyses placing revenue on one wing and expenditure on the other so row-by-row surpluses and deficits become immediately visible.
Before publishing, run through this final checklist:
- Clarity: Confirm the central axis represents a dimension both sides genuinely share, verify category order is identical on both wings, and check that labels sit close enough to their bars to prevent ambiguity.
- Accuracy: Ensure both wings use the same zero-anchored scale, verify any scale asymmetry is intentional and annotated, and check that displayed totals reconcile with the underlying data.
- Accessibility: Test color contrast between the two wings, avoid relying on hue alone to distinguish sides, provide text alternatives or data tables, and confirm readability for viewers with color vision deficiencies or low vision.
- Context: Check that the title and subtitle state the exact comparison being made, and ensure source notes, sample sizes, and units appear where readers expect them.
Frequently Asked Questions
What is a butterfly chart used for?
A butterfly chart arranges horizontal bars on either side of a shared central column to compare two related measures or categories at a glance. It suits side-by-side comparisons such as men and women within each age bracket or imports against exports for each trading partner.
How is a butterfly chart different from a tornado chart?
A tornado chart is a ranking device used in sensitivity analysis and orders variables by impact, so its row sequence shifts when the underlying model or assumptions change. A butterfly chart keeps categorical alignment fixed, with two cohorts on opposite sides of the central axis across a stable set of categories.
Is a population pyramid a type of butterfly chart?
Yes, population pyramids are among the most recognizable butterfly charts. They typically list age cohorts vertically, with males on one side and females on the other, while horizontal axes measure population counts or normalized percentages.
How should I set up data for a butterfly chart?
Use a clean, rectangular table with the shared category labels in the first column and one value column for each cohort to the right, keeping values in the same unit of measure and sign convention. Fill empty values with zeros, remove structural clutter such as merged cells or subtotals, and sort the rows by a meaningful measure.
Why should both sides of a butterfly chart use the same scale?
Both horizontal wings must share the same scale, tick spacing, and zero baseline so that a bar extending twice as far on one side represents twice the quantity. Allowing the left and right axes to use independent ranges makes equal bar lengths represent unequal quantities.
How can I make a butterfly chart work on mobile?
Use tap and long-press gestures to trigger tooltips near the touched bar, including the category label, the side’s value, and the derived difference between wings. When vertical space is tight, use collapsible categories and a taller scrollable container with sticky axis labels, a fixed center reference line, and scroll snapping.
Tony Astor
Tony writes about data visualization and the tools people use to build charts and dashboards. More about Data Illustrator