Bump Chart vs Line Chart: Rankings vs Values
 By Tony Astor ·

Bump Chart vs Line Chart
A line chart plots raw numeric values on a continuous vertical axis, showing exact magnitudes and trends over time. A bump chart converts those values into rankings, connecting each category’s ordinal position across periods to show who leads, overtakes, or falls behind. Use line charts for precise values; bump charts for competitive standing.
Table of Contents
Line Chart
A line chart tracks continuous numeric values over time. It plots data points along a quantitative vertical y-axis against uniform time intervals—such as days, months, or years—on the horizontal x-axis. Straight line segments connect these points to form a continuous path.
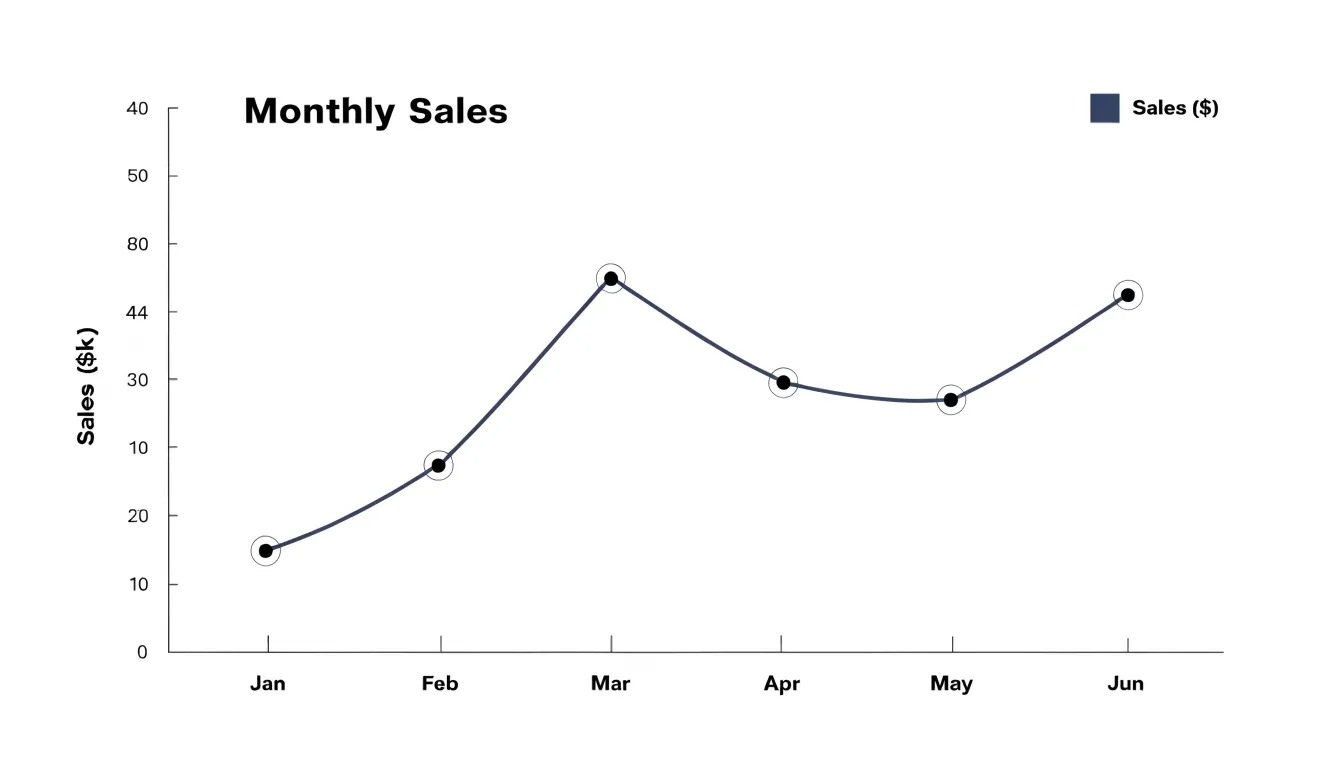
Because each point’s vertical position directly encodes an exact value, viewers can read approximate figures by referencing the y-axis, while the connecting lines highlight overall trends and magnitude changes. For example, a monthly sales line chart shows both individual monthly volumes and whether sales are rising, falling, or fluctuating. Uniform time intervals keep horizontal distances consistent, allowing accurate comparison of slopes and rates of change across periods.
Line charts can compare multiple categories at once using distinct colors or line styles. However, their clarity depends on data density: too few points make the line appear angular and obscure subtle patterns, while too many points clutter the view.
Bump Chart
A bump chart translates raw numeric values into discrete integer rankings, assigning each category a position from first to last at every time interval. Before any plotting occurs, the underlying measurement—whether sales volume, population, or points scored—is sorted at each interval and replaced by its ordinal position. Lines then connect each category’s rank from one period to the next, so vertical position represents standing rather than magnitude.
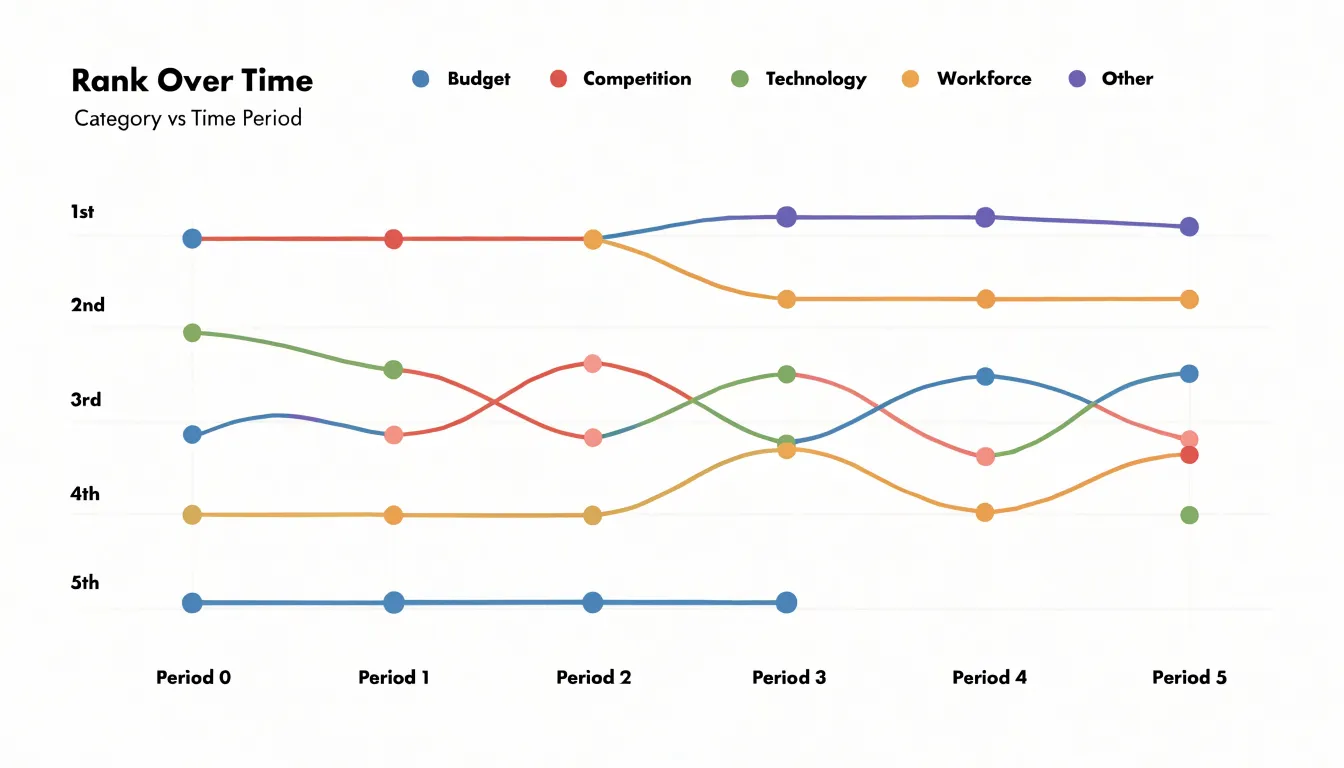
Because ranks are integers, lines travel between fixed horizontal levels, and any crossing of two lines marks an exchange of position. A category that climbs several rungs appears as a steep ascending line, while one that holds steady stays flat. The topmost band forms the leading group and lower bands show the chasing pack. Designers typically add markers at each observation point and use consistent coloring so readers can trace individual categories through dense crossings.
Converting values to ranks removes absolute differences: a narrow margin and a wide margin both register as a single step. Bump charts therefore focus entirely on competitive dynamics—who overtakes whom, how long a lead persists, and which categories surge or fade.
Key Differences
The core distinction between these charts is how they structure the vertical axis. A line chart plots raw measurements on a continuous scale: vertical distance between lines reflects the real numerical gap, and lines drift freely as values rise and fall.
A bump chart replaces continuous magnitude with an ordered track where rank one sits at the top and the lowest rank at the bottom. Every adjacent rank is spaced equally regardless of the underlying values, confining lines to a fixed set of horizontal lanes. It also imposes a fixed vertical resolution—with ten categories, there are only ten possible vertical positions—so raw value changes that do not alter the ordering leave the chart unchanged.
Choosing between them depends on whether the reader needs to see how much values differ or simply who leads whom over time.
Reading Line Charts
On a standard line chart, the slope between consecutive points shows the rate of change over that interval. A steep upward segment indicates a large gain across a short period, a flat segment signals stability, and a downward segment shows a loss. Because the eye reads angles quickly, comparing slopes across the chart reveals which periods performed strongest.
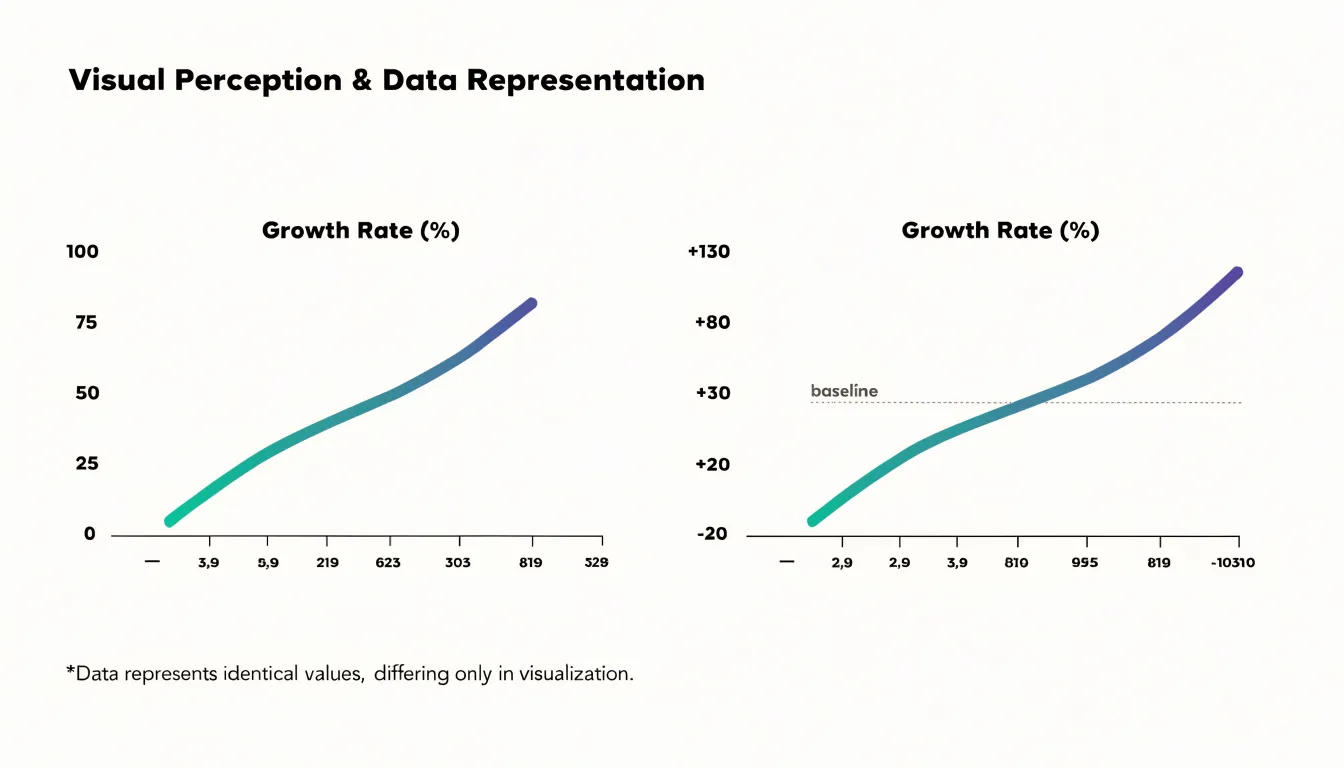
The vertical baseline is equally important. When the y-axis starts at zero, vertical distances reflect true proportional differences, and a doubling of values looks like a visibly larger jump. A truncated or shifted axis stretches the visual space between points, making modest movement look dramatic and meaningful growth look flat. Always check where the vertical axis begins before judging the size of a change.
Cumulative growth curves follow a different logic. Because each point adds to the running total of prior values, the line almost always rises, and the focus shifts to the rate of that rise. A steepening curve signals accelerating accumulation, a straight diagonal indicates steady addition, and a flattening curve shows deceleration even as the total keeps climbing.
Reading Bump Charts
Reading a bump chart centers on three visual patterns:
- Crossovers: Intersecting lines indicate swapped standings. A cluster of crossovers in a single period signals high volatility across the field, while isolated crossovers highlight a specific rivalry or singular shift.
- Top-tier stability: Parallel, evenly spaced lines near the top show leading entities maintaining their relative order. Because rank hides magnitude, however, a flat line at the top does not reveal whether the leader’s numerical lead is widening or narrowing.
- Steep climbs and drops: Long diagonal segments traversing multiple ranks show rapid rises or sudden losses of position, often tied to specific events or turning points. Repeated direction reversals suggest instability or alternating successes and setbacks.
When Rankings Matter
Rankings drive decisions in domains where relative placement carries more weight than raw volume:
- SEO keyword standings: A marketing team tracking twenty target keywords cares less about exact search volume and more about whether their pages sit in the top three positions or have slipped to page two. A keyword with enormous traffic in eighth place is often less valuable than a modest term in first.
- Sports leagues: A table of aggregate points tells a fan little at a glance, and a team with impressive raw statistics may still miss a playoff spot. Plotting league standings across a season clearly shows surges, collapses, and late-season charges.
- Popularity lists: In music charts, app store rankings, and streaming top tens, audience attention is a positional contest and the list order is the product itself.
In these scenarios, a bump chart keeps attention fixed on the competition for position, showing who leads, who trails, and when the field rearranges itself.
When Exact Values Count
When decisions depend on precise figures rather than relative standing, only a continuous value scale preserves the necessary detail:
- Financial revenue reporting: A quarterly total of $4.28 million must appear as that exact figure because small differences between periods affect budgeting, forecasting, and auditing. Knowing a region moved from third to first is secondary to reconciling actuals against plan.
- Server uptime: Operations teams track availability to two or three decimal places because service-level agreements are written against strict thresholds—99.95 percent and 99.99 percent sit in different contractual tiers. Ranking services hides whether a system met its commitment or fell just short.
- Physical measurements: Temperature, pressure, voltage, and weight carry units and tolerances that require direct reading. A lab technician needs to see whether a sample sits at 36.8 degrees or 37.2 degrees, since that fraction determines the next action.
Spotting Trends
Because a line chart preserves actual spacing between values, the shape of the line exposes specific temporal patterns:
- Peaks and drops: A sharp rise and fall creates an obvious peak, while a sudden drop followed by a recovery shows both the severity of a disruption and how quickly conditions normalized.
- Seasonal fluctuations: A metric that climbs every December and retreats every January traces a repeating wave. Across multiple cycles, readers can compare year-over-year peaks, see whether the seasonal swing is widening or narrowing, and observe how annual rhythms interact with long-term movement.
- Sudden percentage spikes: A jump from 2 percent to 9 percent produces a steep, high slope that communicates both speed and size. Plotting overlapping series lets analysts connect a spike in one measure with movement in another to test causes, while annotations can flag and explain exceptional points directly on the canvas.
Highlighting Competition
In a category where three or four major players jockey for market share, a bump chart turns periodic rank data into a clear view of moves and countermoves. When a challenger climbs from fourth to second over two quarters, its ascent appears alongside the displaced brand’s descent, drawing the rivalry directly as an intersection.
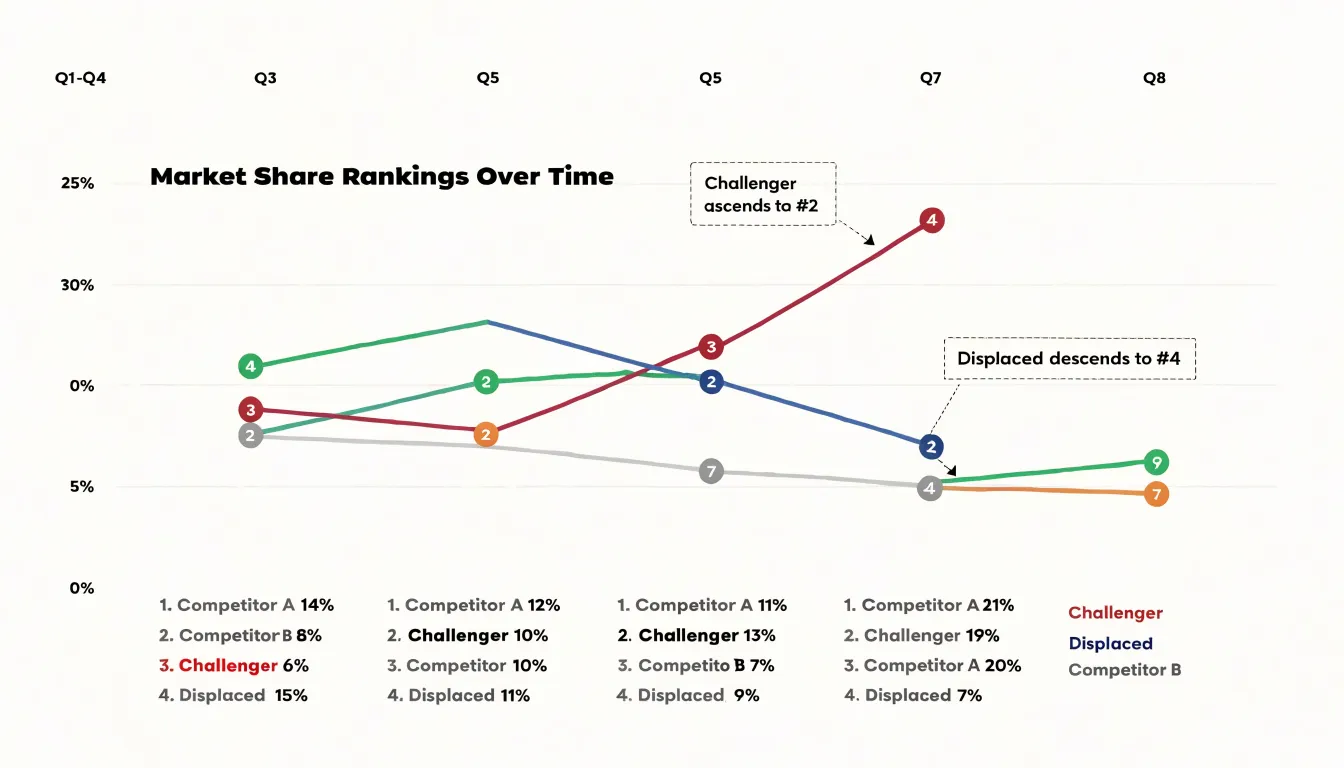
Rank inversions also surface competitive dynamics that raw values can obscure. Two competitors may both be growing in absolute terms, yet one grows faster and passes the other. A bump chart highlights the exact period in which the gap closed and reversed. Across multiple intervals, repeated crossings between the same lines signal an ongoing head-to-head rivalry, while a single crossing followed by widening rank separation indicates a decisive shift in momentum.
Handling Cluttered Visuals
When many categories cluster in adjacent positions on a bump chart, crossing and stacked lines create dense bands of color that are hard to follow. Four techniques help keep the chart readable:
- Interactive highlighting: Hovering over or selecting a line brings that trajectory forward while fading competing lines into the background, letting users trace one category without losing overall context.
- Top-N filtering: Limiting the chart to the highest-ranked entries removes the noisy long tail of low-position lines. Showing between five and ten categories usually keeps the view legible, depending on data density and display size.
- Adjusting node spacing: Increasing the vertical gap between rank positions, reducing marker size, or slightly offsetting markers at crowded intervals helps separate merging lines.
- Thinning time steps: Reducing the number of intervals shown along the horizontal axis relieves congestion when many rank changes occur at once.
Common Mistakes
A few scale and encoding errors can distort either chart type:
- Truncated baselines (Line charts): Starting the y-axis above zero exaggerates visual differences between points, making minor fluctuations look dramatic.
- Inverted y-axes (Line charts): Plotting higher values lower on the vertical axis can work in specialized contexts, but on a standard trend chart it reverses the reader’s intuition about which direction represents growth.
- Unhandled ties (Bump charts): Plotting tied entities on the exact same point creates ambiguity about whether one is ahead or both are level, and can cause inconsistent ordering between periods that looks like a false rank swap. Offset tied items slightly and indicate the shared rank through color, labels, or a note, applying consistent tie-breaking rules across the series.
- Uneven rank spacing (Bump charts): Spacing the y-axis unevenly or compressing ranks at one end misrepresents the ordinal steps between positions.
Choosing The Right Metric
To decide between absolute amounts (line chart) and relative order (bump chart), ask three questions about your data and audience:
- Does the audience care about the numerical gap between values? If yes, use absolute amounts to show real scale and growth.
- Is the goal to highlight changes in standing? If moving from third to first place is the primary takeaway, use relative order.
- Does the dataset have many categories with overlapping trajectories? If so, converting values to relative order spaces the lines evenly into discrete tracks, reducing overlap.
Remember that a company can grow its absolute revenue while simultaneously dropping in market rank; choose the metric that matches the specific insight you need to communicate.
Real World Case Studies
A consumer electronics company tracking quarterly performance across regional markets illustrates how both charts serve different teams. The finance team uses a line chart to follow gross sales revenue over eight quarters, watching revenue climb from $4.2 million to $6.8 million during the holiday season before settling near $5.5 million in the spring. Meanwhile, the strategy group uses a bump chart to track market share rankings among five rival brands in those same regions. When a challenger overtakes the incumbent in Q3, the crossing lines make the reversal and the reshuffling of third and fourth place immediately visible—a shift that would require close reading on a raw percentage line chart.
A grocery retail chain uses a similar pairing. Store-level sales on a line chart reveal seasonal holiday spikes to guide inventory and staffing. Alongside it, a monthly bump chart of local competitor rankings shows whether the chain is gaining or losing ground, surfacing cases where store revenue stays flat or grows slightly while the chain slips in local standing.
Dashboard Strategies
Pairing a line chart and a bump chart side by side on an executive dashboard answers how much progress has been made and how that progress compares to peers in a single view. Showing only revenue growth can mislead if competitors are growing faster, while showing only rank hides whether the underlying market is expanding or contracting.
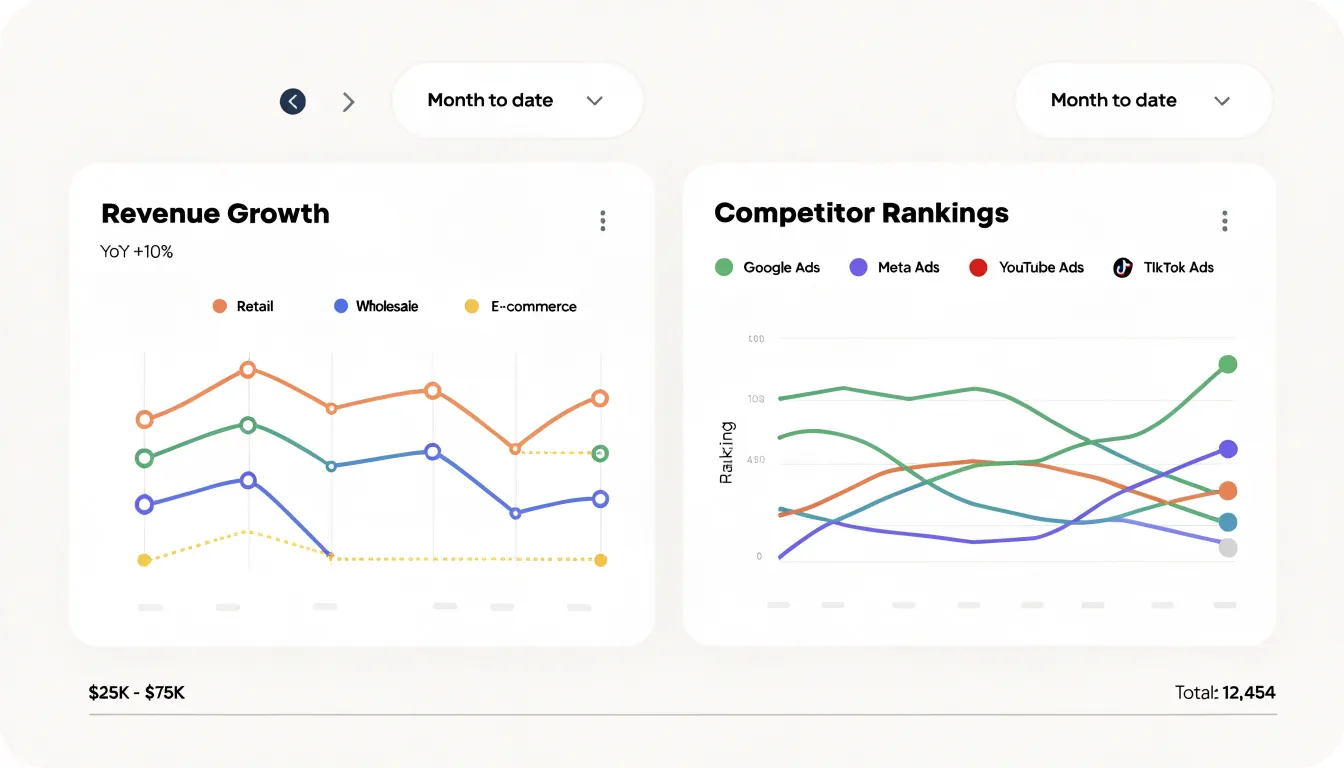
To build an effective paired layout:
- Align axes and timeframes: Place the charts in adjacent panels with a shared x-axis and identical time windows. Label the line chart’s y-axis with currency or volume and the bump chart’s y-axis with ordinal positions from top to bottom.
- Match color coding: Assign the same color to each entity across both panels so readers can trace a single competitor in both views at once.
- Synchronize interactivity: Connect date-range selectors and segment filters to both charts so drilling into a product line updates growth and standing together. Use tooltips that display both the exact figure and the rank for any hovered data point.
Frequently Asked Questions
What’s the main difference between a line chart and a bump chart?
A line chart plots raw measurements on a continuous scale, while a bump chart converts values into rankings and places categories on an ordered track from first to last. In a line chart, vertical distance reflects the real numerical gap; in a bump chart, every adjacent rank is spaced equally.
When should I use a bump chart instead of a line chart?
Use a bump chart when the goal is to highlight changes in standing, such as who leads whom over time, rather than showing how much values differ. Use a line chart when the audience needs to see exact numerical gaps and real scale.
What do crossing lines mean in a bump chart?
Crossing lines mark an exchange of position between categories. A cluster of crossovers in one period signals high volatility across the field, while isolated crossovers highlight a specific rivalry or singular shift.
Why does a truncated y-axis distort a line chart?
Starting the y-axis above zero stretches the visual space between points, exaggerating minor fluctuations and making modest movement look dramatic. The article advises checking where the vertical axis begins before judging the size of a change.
How can I reduce clutter in a bump chart with many categories?
The article suggests interactive highlighting, top-N filtering, adjusting node spacing, and thinning time steps. Top-N filtering usually keeps the view legible with between five and ten categories, depending on data density and display size.
How should tied ranks be handled in a bump chart?
Plotting tied entities on the exact same point creates ambiguity and can look like a false rank swap, so the article recommends offsetting tied items slightly and indicating the shared rank through color, labels, or a note. Apply consistent tie-breaking rules across the series.
Tony Astor
Tony writes about data visualization and the tools people use to build charts and dashboards. More about Data Illustrator