Bump Chart: How to Show Rankings Over Time
 By Tony Astor ·

Bump Chart
A bump chart is a line chart that plots ordinal rank over time rather than numeric value, placing rank one at the top so lines rise and fall as standings shift. It suits keyword tracking, leaderboards, and competitive standings where who is ahead matters more than the magnitude behind each position.
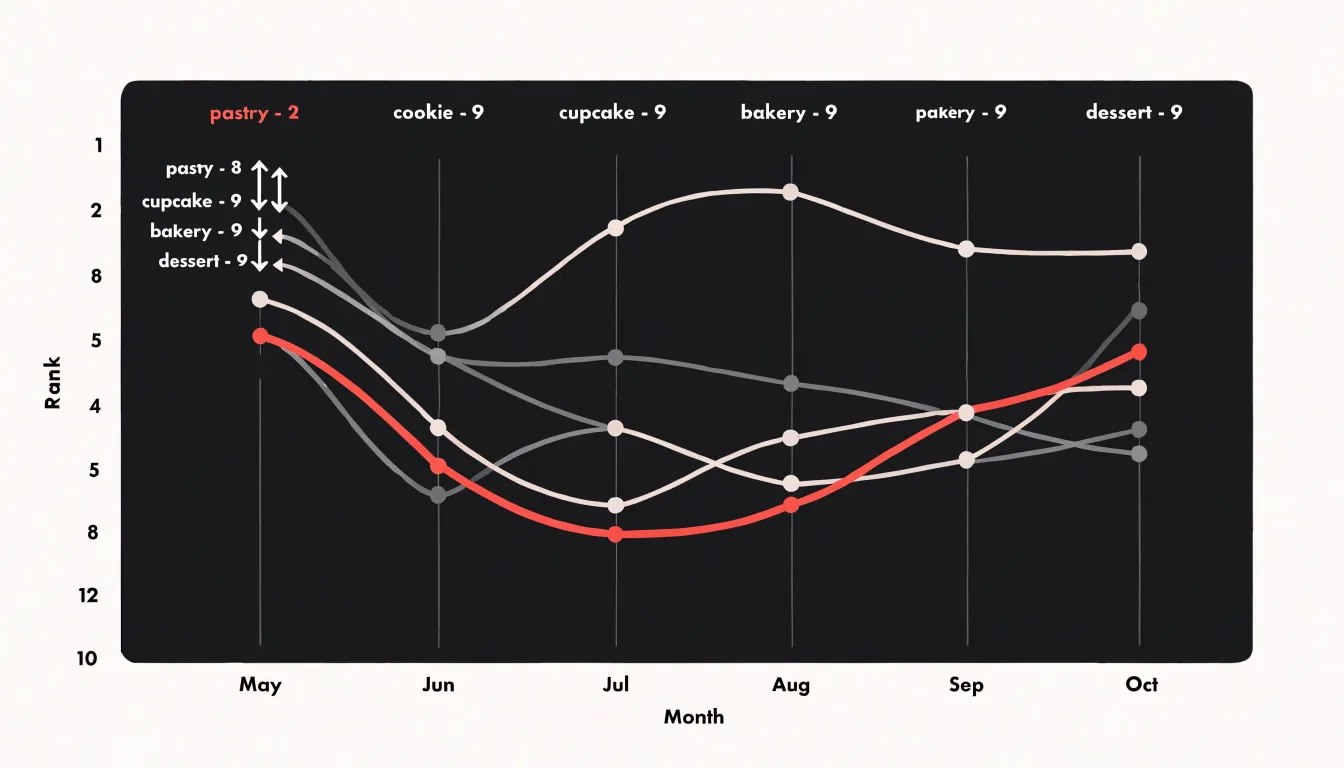
Table of Contents
Bump Chart
A bump chart is a line chart built specifically for ordinal standings, where the vertical position of each series shows its rank at a given point in time rather than its measured value. Each entity—whether a keyword, a product, a salesperson, or a competitor—receives its own line, and those lines rise and fall as standings shift from period to period. Where a standard line chart places a point according to a quantity like revenue or traffic, a bump chart places it according to position: rank one at the top, rank two just below, and so on down to the bottom of the list. This inversion of priorities is the defining feature of the form.
The chart excels in scenarios where the sequence of ranks matters more than the raw magnitude behind them. Keyword position tracking is a classic example. A site might move from position twelve to position four while the underlying search volume and click-through curve shift unevenly, and the story an analyst cares about is the climb itself. Sales leaderboards tell a similar story, as do sports standings, product category rankings, and competitive share-of-voice tables. In each case, the question being asked is who is ahead of whom and how that order has changed.
When several entities are involved, the chart also reveals crossings and overtakes that tables of numbers tend to bury. A line that overtakes another shows precisely when one keyword, product, or team passed its rival, and clusters of crossings highlight periods of unusual volatility. The visual emphasis on trajectories over absolute values makes bump charts a natural fit for dashboards and reports where the audience needs to follow the race rather than audit the figures.
Bump Chart vs Line Chart
The decision between a bump chart and a line chart hinges on what question the visualization is meant to answer. A line chart plots absolute numerical values along a continuous axis, so the vertical distance between points reflects real magnitude: a revenue gap of twenty million dollars appears twice as tall as a gap of ten million. This makes line charts the natural choice when the reader needs to understand trajectory in quantitative terms, such as growth rates, seasonal fluctuations, or the size of a lead over time. A bump chart plots rank position instead, shifting the visual emphasis from how large a difference is to whether one entity has overtaken another.
A distortion problem arises when a standard line chart is used to communicate rank. Because the vertical axis is scaled to magnitude, a series with a very large lead can push the remaining lines into a compressed band near the bottom, making rank changes among the trailing competitors almost invisible. Conversely, a narrow value range in a crowded field may produce constant crossing that overstates the significance of trivial rank swaps. A bump chart solves this by allocating equal vertical spacing to every rank position, so each change in standing occupies the same visual distance regardless of the underlying numbers. The trade-off is that bump charts discard information about magnitude entirely, so a first-place finish by a wide margin looks identical to a first-place finish by a hair.
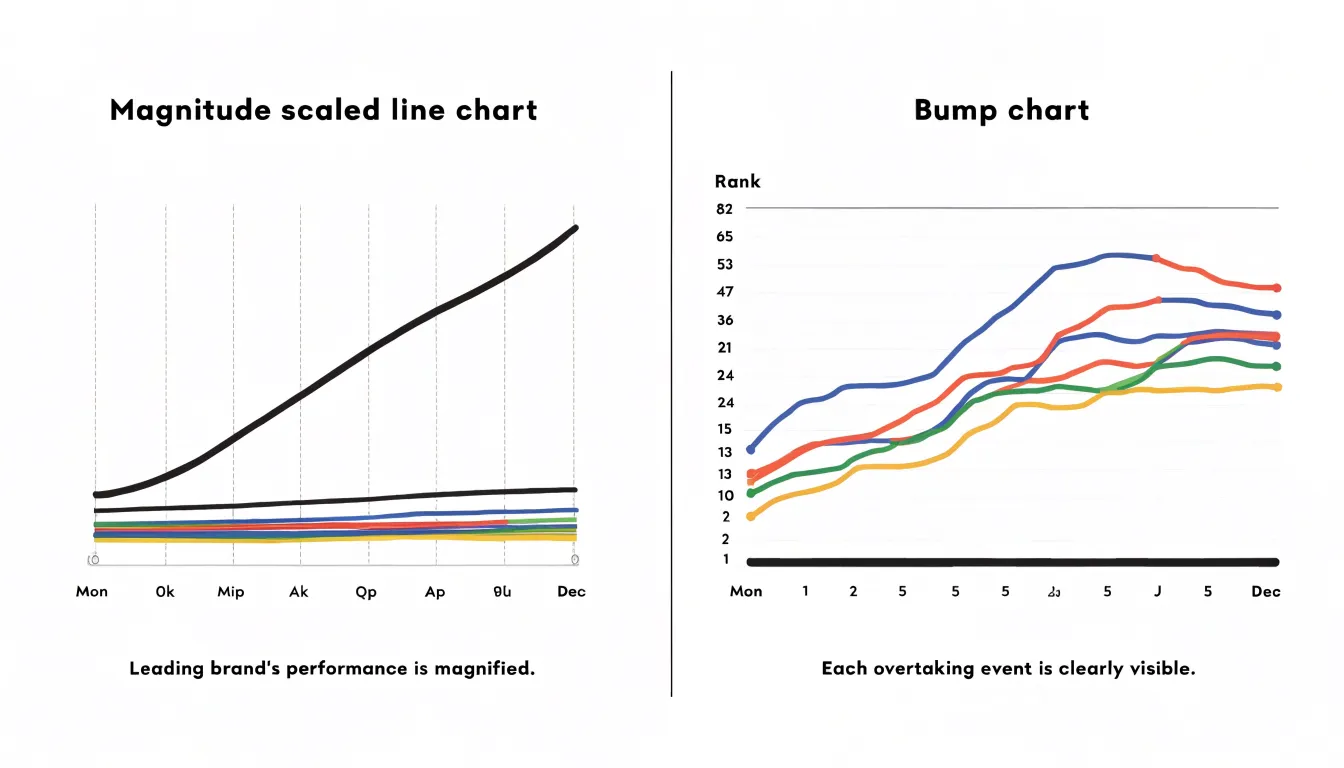
In practice, if the audience needs to compare sizes, rates, or totals over time, a line chart preserves the quantitative relationships. If the audience needs to follow who is ahead, who is gaining, and how positions shuffle across stages, a bump chart delivers that signal more cleanly. Many analysts pair the two, using a bump chart to orient readers to the competitive story and a line chart to supply the underlying scale.
Bump Chart
Preparing a bump chart dataset requires three core elements: a time dimension, entities, and their explicit ranks. The two common data structures are wide and long formats:
- Wide format: Each row represents a time period, and each column corresponds to an entity, with cell values holding the ranks. For example, a row for January 2023 might have columns for Team A, Team B, and Team C containing their respective ranks that month. This format is intuitive for small numbers of entities but becomes unwieldy as entities increase.
- Long format: Each row represents one entity at one time period, with separate columns for time, entity, and rank. This structure is more flexible and is often required by charting libraries.
Regardless of format, you need explicit rank calculated fields computed from an underlying metric, such as sales or score, using a ranking function. Ensure that ranks are integers and handle ties appropriately, either by assigning average ranks or using a method like ‘min’ or ‘dense’.
Timestamps should be in a consistent format, preferably ISO 8601, and may need to be aggregated to the desired granularity (e.g., monthly). Entity categories need consistent naming and may include additional attributes for grouping or coloring. You must also handle missing data: if an entity has no value for a period, decide whether to omit it or assign a rank based on available data. Mapping time, entity, and explicit rank directly to visual channels reduces errors and makes the chart easy to update.
Bump Chart
Setting up the axes for a bump chart requires specific configurations for both vertical and horizontal scales. On the vertical Y-axis, rank number one should appear at the top of the chart by convention. Because the default Y-axis in most charting libraries increases from bottom to top—which would place rank one at the bottom—you must explicitly reverse the axis direction or set the axis range from the maximum rank at the bottom to one at the top. This aligns with the intuitive reading of rankings, where the best performer is positioned highest and upward movement reads as improvement.
On the horizontal X-axis, time intervals must be mapped uniformly. Each time period—whether days, months, quarters, or years—should be spaced consistently across a categorical or discrete axis where each tick corresponds to a specific time point, rather than a continuous scale that might misrepresent the intervals. Uniform spacing prevents visual distortions and makes the slopes between points meaningful: a steep slope indicates a significant rank change, while a gentle slope shows stability.
Bump Chart
Within the axis grid, every entity’s rank at every time step is plotted as a discrete node—a small marker centered on the intersection of its time column and rank row. These nodes anchor the visual structure and should be sized and colored consistently so readers can track them without distraction. Any entity whose line will be highlighted can carry a slightly larger or more saturated node.
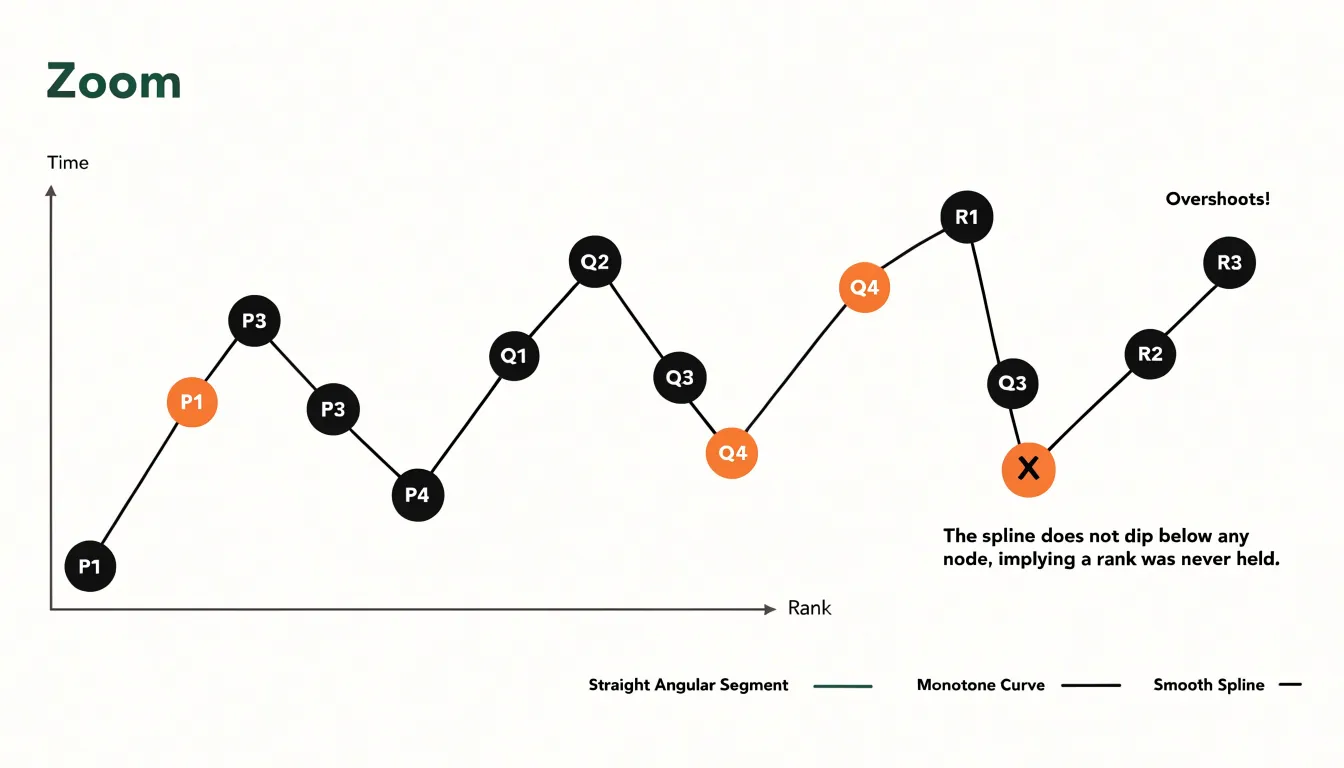
Once the nodes are placed, the next decision concerns how to connect them:
- Straight segments: Produce a clean, angular path between ranks, making each step change immediately legible; the eye reads the vertical rise or fall between adjacent columns as a single discrete jump.
- Smooth curves: Ease the transition between ranks and lend the chart a flowing quality that suits dense fields with many crossing trajectories. Spline interpolation should be applied carefully, because an aggressive curve can dip below or overshoot a node and imply a rank the entity never held. A gentle monotone interpolation preserves the direction of travel while avoiding false intermediate values.
Line weight, opacity, and color reinforce the direction of movement across time, with a highlighted series drawn thicker and in a strong hue while contextual lines recede.
Bump Chart
Tied rankings present a practical challenge because a bump chart depends on each entity occupying a distinct vertical position at every time point. When two or more categories share the same rank in a given period, a naive plotting approach places their nodes at identical vertical coordinates, causing markers to overlap and connective paths to collapse into a single line or fragment into confusing segments. Resolving ties requires a deliberate ranking strategy applied before drawing the chart.
Under fractional ranking (or average ranking), tied entities receive the mean of the positions they jointly occupy. If two items are tied for third and fourth place, both are assigned a rank of 3.5. This preserves the total ordering of the scale and keeps the vertical axis numerically consistent across periods, which matters when viewers compare positions between time points. The trade-off is that fractional values introduce half-step positions that may look slightly unusual on a discrete rank axis, so axis labels often need adjustment.
In dense ranking, tied entities share the same rank, and the next distinct value receives the immediately following integer rather than skipping ahead. Two items tied for third both receive rank three, and the next item becomes rank four. This keeps all ranks as whole numbers and produces a compact vertical scale, though it compresses the distance between the tied group and the ranks below it.
To ensure every node has a unique or clearly offset vertical position, some practitioners combine a ranking method with small visual jitter or grouped node placement to separate tied markers. Documenting the chosen convention in a caption or legend helps readers interpret the chart accurately and avoids misreading tied positions as data errors.
Bump Chart
Because bump charts often feature many lines crossing across a shared horizontal axis, strategic color choices establish a visual hierarchy before the viewer reads a single label. The most effective approach assigns vivid, saturated colors to the one to three entities that carry the chart’s main story, such as a product line that has climbed steadily or a competitor that has collapsed in rank. Secondary series recede into neutral grays, muted taupes, or pale tints of the highlight color, remaining visible enough to supply competitive context without competing for attention.
Restraint in the number of highlighted colors matters; beyond three or four vivid hues, the chart loses its focal point and the viewer’s gaze scatters. Beyond hue itself, lightness and saturation carry weight: a deep, saturated tone reads as foreground, while a light, desaturated tone sits back. Color assignment must also remain consistent so a red line represents the same entity at every rank position, while gray lines stay interchangeable unless labeling demands otherwise. Finally, chosen highlight colors should remain distinguishable for viewers with color vision deficiencies, ideally through variation in lightness as well as hue.
Bump Chart
When a chart tracks many entities across several periods, a reader’s eye naturally seeks out the extremes: the lines that stay pinned near the top and the lines that plunge dramatically. Designers can guide that attention through dynamic callouts and custom end-point markers placed at the conclusion of the relevant series.
For consistent top performers, a callout that travels along the leading line—such as a small label anchored to the final period or a highlighted band running the full width of the chart—signals sustained dominance. A custom end-point marker, such as an enlarged circle, a flag icon, or a distinct shape at the terminal node, tells the viewer that a series deserves special notice without requiring them to trace the entire path. These markers work best when reserved for a handful of series, since scattering them across every line dilutes their impact.
For dramatic drop-offs, an end-point marker that changes color, gains a downward arrow, or carries a short annotation describing the magnitude of the fall (for example, ‘fell 12 places since period one’) makes the story legible immediately. Connecting the starting and ending positions with a subtle emphasis, or adding a callout near the steepest segment, reinforces the narrative of decline.
Bump Chart
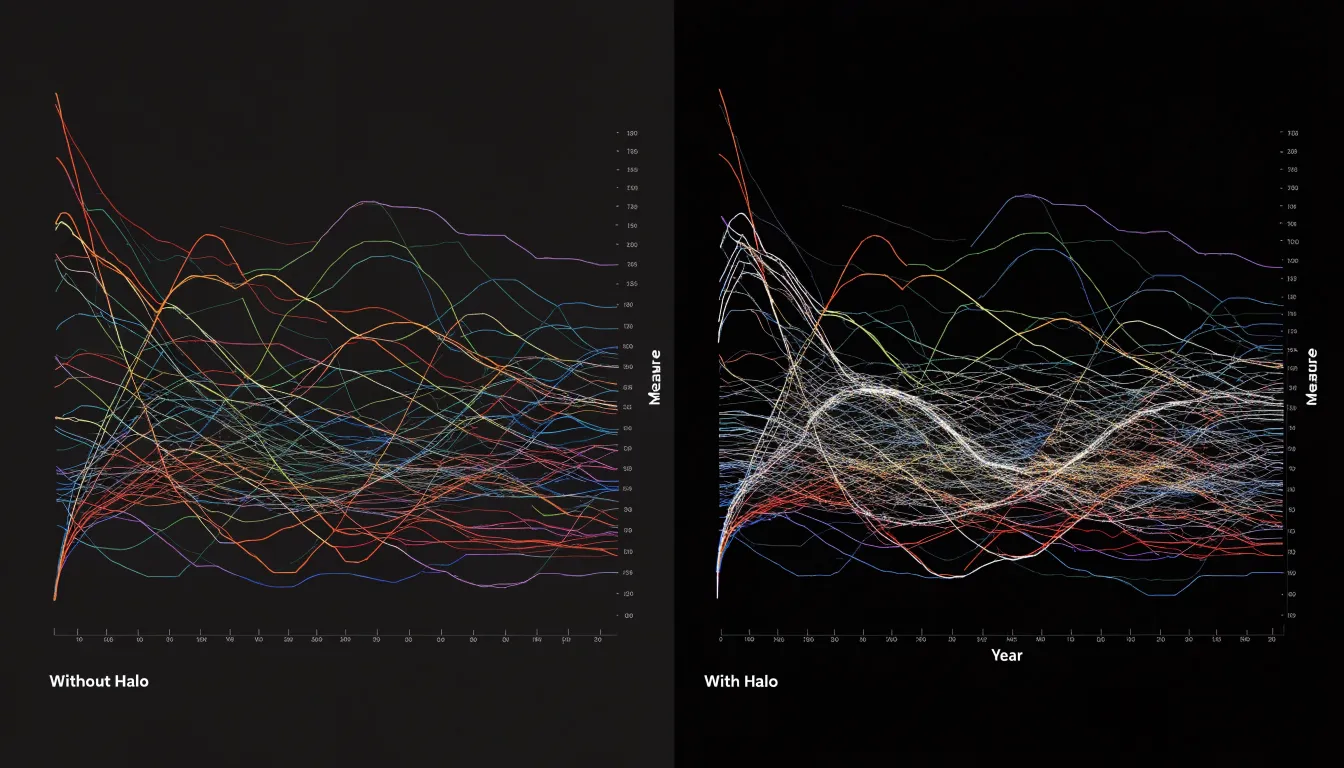
When many lines cross in a small area, dense intersection points create a tangled web that obscures individual paths. Several techniques help separate intersecting trajectories:
- Line weight and transparency: Adjust line weights so paths are thick enough to be seen easily without overlapping excessively. A moderate line weight paired with slight transparency maintains visibility in crowded areas.
- White outline halos: Adding a consistent white outline around each line creates a subtle buffer between intersecting paths, making it clear which line is on top and preventing visual merging.
- Consistent drawing order: Drawing lines in a predictable z-order (e.g., ordered by final rank) makes intersections easier for the eye to resolve.
- Filtering rank ranges: Showing only the top and bottom portions of the standings, allowing interactive filtering to a subset of ranks, or splitting different rank ranges into small multiples reduces the total number of intersecting lines.
Bump Chart
Placing entity labels directly beside the starting and ending data points eliminates the need for a separate legend—that box of colored swatches and names that forces the reader to look in two places at once and match colors across crossing lines. Without a legend, the chart gains space and the reader can follow a line directly from label to label.
On the left side of the chart, labels sit just outside the first data point, aligned to the entity’s starting rank. On the right side, labels sit just outside the final data point, aligned to the ending rank. Keeping both anchors labeled means a reader can enter the chart from either direction, whether they want to know where an entity began or where it finished.
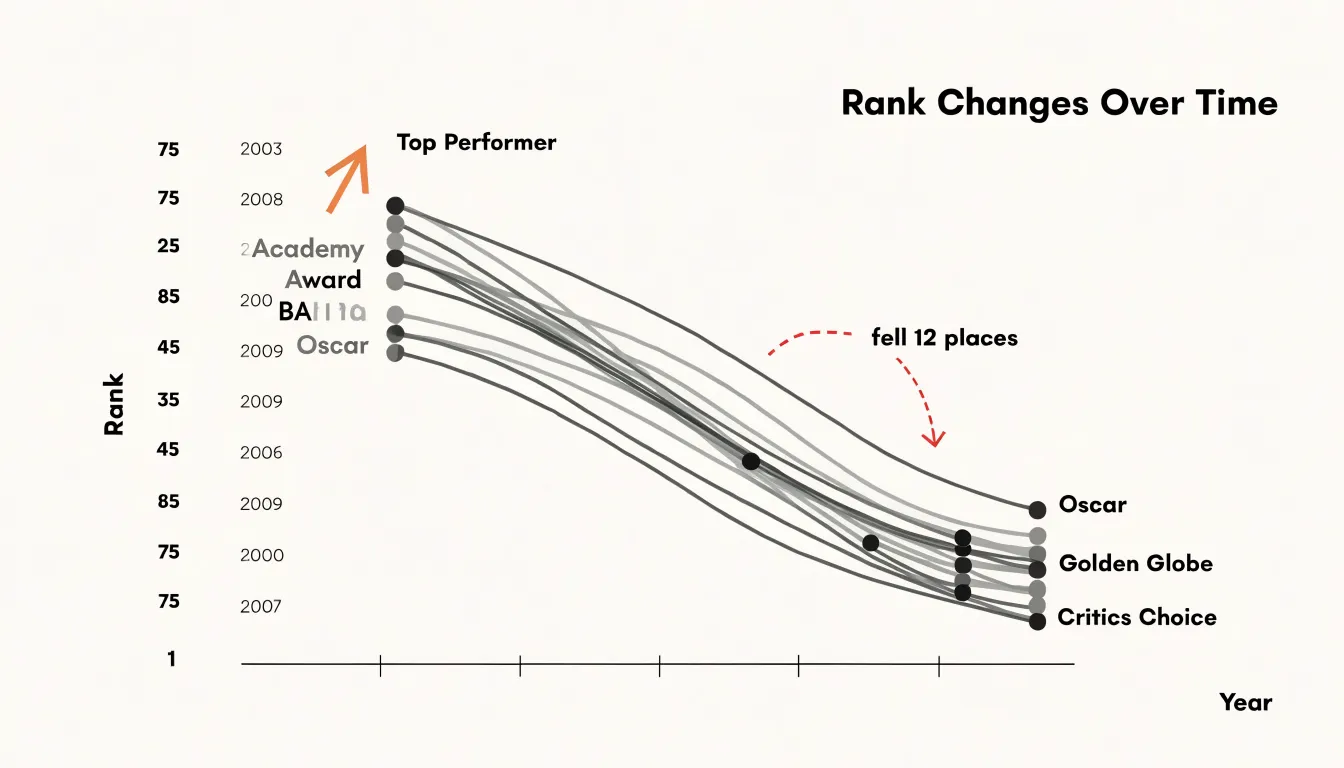
Set labels in a consistent typeface and size, with enough horizontal padding that they do not touch the plot area. Where several lines converge on nearly the same rank at one end, nudge labels vertically so each remains legible while keeping the implied connection to its line clear. Increasing the outer margins of the chart gives these labels the room they need without compressing the plotting area.
Bump Chart
Three frequent design mistakes can undermine the clarity of a bump chart:
- Plotting too many competing categories: A bump chart with more than eight to ten lines becomes nearly impossible to trace. Focus on the most relevant categories, group the rest into an ‘other’ category, or use small multiples to separate the data.
- Failing to invert the Y-axis: Leaving rank 1 at the bottom contradicts intuitive reading and leads to misinterpretation. Always position the highest rank at the top.
- Overly saturated color schemes: Applying bright, intense colors to every line overwhelms the viewer and makes categories difficult to distinguish. Use a restrained palette and reserve high saturation for key highlighted categories.
Bump Chart
Seasonal comparison in a bump chart begins with slicing the timeline into identical windows, such as matching calendar months or equivalent fiscal quarters across successive years. Once each slice contains the same number of periods and the same start and end boundaries, ranks from different years can be plotted on a shared axis so recurring movements become visible. Aligning historical date slices lets analysts separate genuine annual patterns from one-off shocks, since a rank change that reappears at the same point in every cycle signals a structural rhythm rather than random noise. For example, a product that consistently climbs two or three places every autumn and falls back each spring reveals a seasonal demand curve that a raw chronological chart would obscure.
Year-over-year alignment adds a second layer by comparing the same macro period across multiple years, holding external conditions as constant as possible. When the chart overlays rank position for each matched window, long-term competitive dynamics emerge: a brand that steadily gains ground across five consecutive summers demonstrates durable momentum, while a rival that oscillates within the same range shows stable but stagnant performance. Because rank is relative, these movements also capture how competitors respond to one another, showing whether a leader’s advantage widens or narrows over time.
Practical execution requires consistent aggregation rules, identical interval lengths, and careful handling of missing data so a gap in one year does not distort the alignment. Analysts should annotate known events, such as promotions or market entries, to distinguish deliberate strategy from seasonal drift.
Bump Chart
To build a dynamic bump chart in Excel that updates automatically when underlying data changes, follow these steps:
- Calculate ranks: Prepare a table with ranks for each period using the
RANKformula. For example, if your data is in columns B through E for four periods and rows 2 through 6 for five categories, enter=RANK(B2,$B$2:$B$6,1)to rank the first period, then copy the formula across and down to create a matrix of ranks. - Insert a line chart: Select the range of ranks and insert a standard line chart. Excel will plot each category as a separate line with rank 1 at the bottom by default.
- Reverse the Y-axis: Right-click the Y-axis, choose Format Axis, and check the box for Values in reverse order to place rank 1 at the top.
- Customize markers: Select a line, go to Format Data Series, and choose Marker Options. Set the marker type to a circle or square, adjust the size, and vary marker colors to make categories distinct.
- Clean up the layout: Remove gridlines, add data labels if desired, and adjust the chart title and axis labels to indicate the time periods and ranking metric.
Bump Chart
Building a bump chart in Tableau combines table calculations for dynamic ranking with dual-axis mark layering for node styling:
- Set up the initial view: Connect to a data source containing a time dimension, a category dimension, and a measure for ranking. Place the time dimension on Columns and the measure on Rows.
- Create the rank calculation: Create a calculated field using the
RANK()function, such asRANK(SUM([Measure])), and set the table calculation to compute along the time dimension (e.g., Specific Dimensions: Time) to assign a rank to each category per period. - Replace the measure: Replace the original measure on Rows with the new rank calculation.
- Create a dual axis: Duplicate the rank calculation so it appears on two Rows shelves. Right-click the second axis, select Dual Axis, and synchronize the axes to ensure alignment.
- Configure mark types: On the Marks card, set the first axis to a Line mark type and the second axis to a Circle mark type. Adjust the circle size to make the nodes prominent, and add the category dimension to the Color shelf on both marks.
- Format and add interactivity: Reverse the Y-axis order so rank 1 appears at the top, hide unnecessary headers, and add filters, parameters, or tooltips so users can focus on specific categories or time ranges.
Bump Chart
Adding interactivity and visual polish prepares a bump chart for stakeholder reporting. Hover tooltips provide on-demand details—such as the entity’s name, its exact rank at a specific point in time, and the rank change from the previous period—without cluttering the surface with text. Click or hover highlight actions further improve usability by emphasizing a selected entity’s line while dimming the rest, allowing users to isolate a single trajectory with smooth transitions.
For final visual polish, apply a legible sans-serif font with consistent sizing for axis labels and annotations, ensuring strong contrast against the background. Add a clear title and subtitle that state the chart’s purpose, and strip away unnecessary gridlines and borders so the viewer’s attention stays on the rank trajectories.
Frequently Asked Questions
What is a bump chart used for?
A bump chart is a line chart built for ordinal standings, where vertical position shows each entity’s rank at a point in time rather than its measured value. It is used for things like keyword position tracking, sales leaderboards, sports standings, product category rankings, and competitive share-of-voice tables.
When should I use a bump chart instead of a line chart?
Use a bump chart when the audience needs to follow who is ahead, who is gaining, and how positions shuffle across stages. Use a line chart when the audience needs to compare sizes, rates, or totals over time, because a line chart preserves quantitative relationships.
How should the Y-axis be set up for a bump chart?
Rank number one should appear at the top by convention, so you must reverse the axis direction or set the axis range from the maximum rank at the bottom to one at the top. On the X-axis, time intervals should be mapped uniformly on a categorical or discrete axis.
How do you handle tied ranks in a bump chart?
With fractional ranking, tied entities receive the mean of the positions they jointly occupy, so two items tied for third and fourth both get a rank of 3.5. With dense ranking, tied entities share the same rank, and the next distinct value receives the immediately following integer.
What mistakes should I avoid when designing a bump chart?
Avoid plotting more than eight to ten competing lines, since that becomes nearly impossible to trace; focus on relevant categories, group the rest into an “other” category, or use small multiples. Also invert the Y-axis so rank 1 is at the top, and use a restrained color palette that reserves high saturation for key highlighted categories.
How do I create a dynamic bump chart in Excel?
Calculate ranks for each period using the RANK formula, insert a standard line chart, reverse the Y-axis so rank 1 is at the top, customize markers, and clean up the layout by removing gridlines and adjusting labels.
Tony Astor
Tony writes about data visualization and the tools people use to build charts and dashboards. More about Data Illustrator