Bullet Chart vs Gauge Chart: Which Shows KPIs Better?
 By Tony Astor ·

Bullet Chart vs Gauge Chart
Bullet charts display a measure as a horizontal bar against target markers and qualitative ranges in minimal space, making them faster and more accurate to read than gauge charts, which use a radial dial and needle. Choose bullet charts for dense dashboards and comparisons; use gauges for single-metric status checks.
Table of Contents
Gauge Charts
A gauge chart takes the familiar form of a speedometer and turns it into a data display. The design centers on a dial with a fixed arc of tick marks, and a single needle swings across that arc to point at the current value of one metric. The scale is defined in advance, so the needle’s position carries immediate meaning: sitting near the left edge signals a low reading, while a needle pushed toward the right edge shows a high one. Many implementations add colored bands along the arc, marking zones such as acceptable, caution, and critical ranges, which lets the viewer interpret the reading without consulting a legend or table.
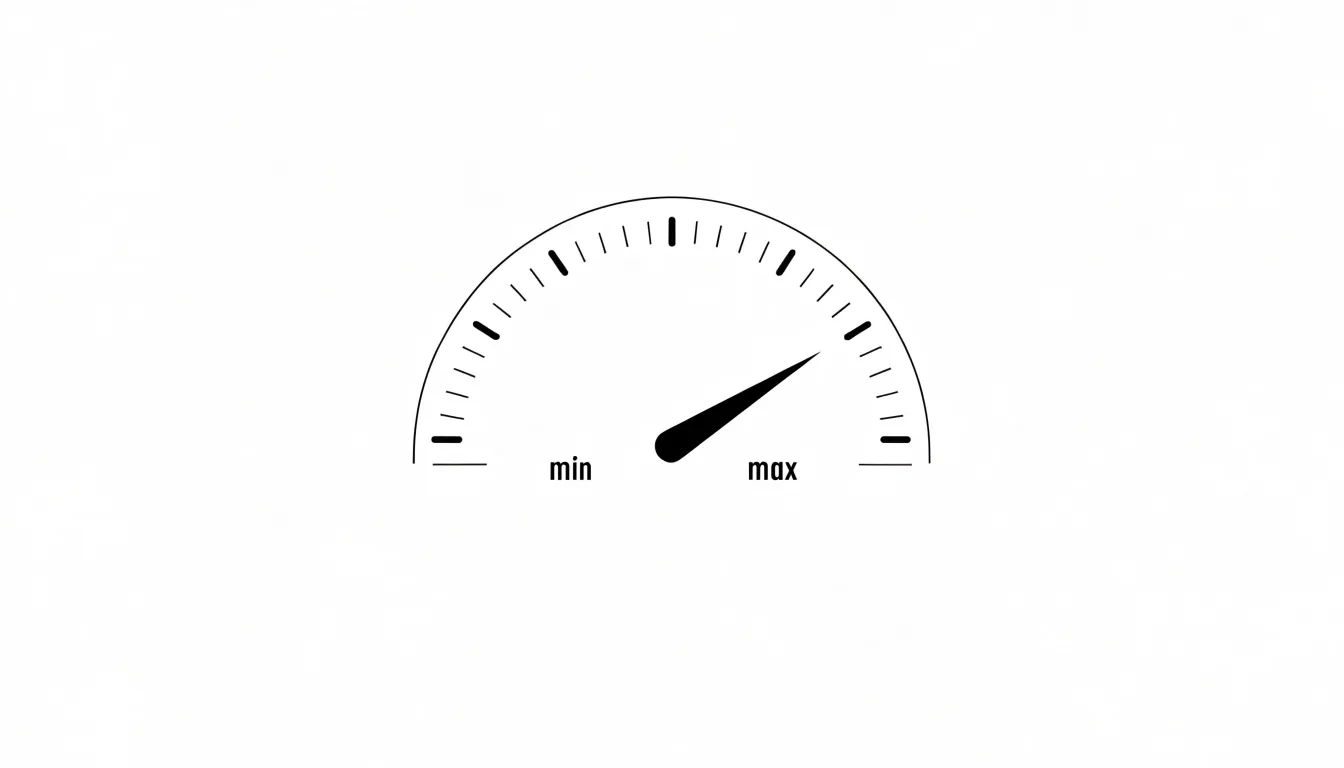
A minimum and maximum establish the endpoints of the arc, and the metric’s present value is mapped proportionally onto that span. A value sitting halfway between the endpoints places the needle at the midpoint of the dial. Because the mapping is fixed, the same reading always produces the same needle position, which makes the chart reliable for repeated glances over time. Some designs include a small target marker or a secondary indicator showing the previous reading, giving the viewer a reference point alongside the current value.
The intuitive appeal of the speedometer design comes from its cultural familiarity. Most people have watched a needle move on a dashboard and understand instinctively that its position conveys status at a glance. That recognition makes gauge charts effective for high-level monitoring, where the purpose is to answer a simple question: is this metric where it should be? A viewer can register the answer in a fraction of a second, without reading numbers or tracing a trend line. This suits dashboards meant for quick check-ins, executive summaries, and any context where a single headline figure needs to register instantly with an audience that may not study the display closely.
Bullet Charts
Bullet charts, developed by Stephen Few, are a compact and efficient way to display performance data against targets and qualitative ranges. The design centers on a horizontal bar that represents the actual value achieved. This feature bar is typically a solid, dark color, making it the most prominent element. Behind it, lighter shaded bands indicate qualitative ranges, such as poor, satisfactory, and good, providing context for interpreting the actual value. A vertical line or marker on the bar denotes the target or goal, while additional markers may indicate comparative values, such as last year’s performance or an industry benchmark.
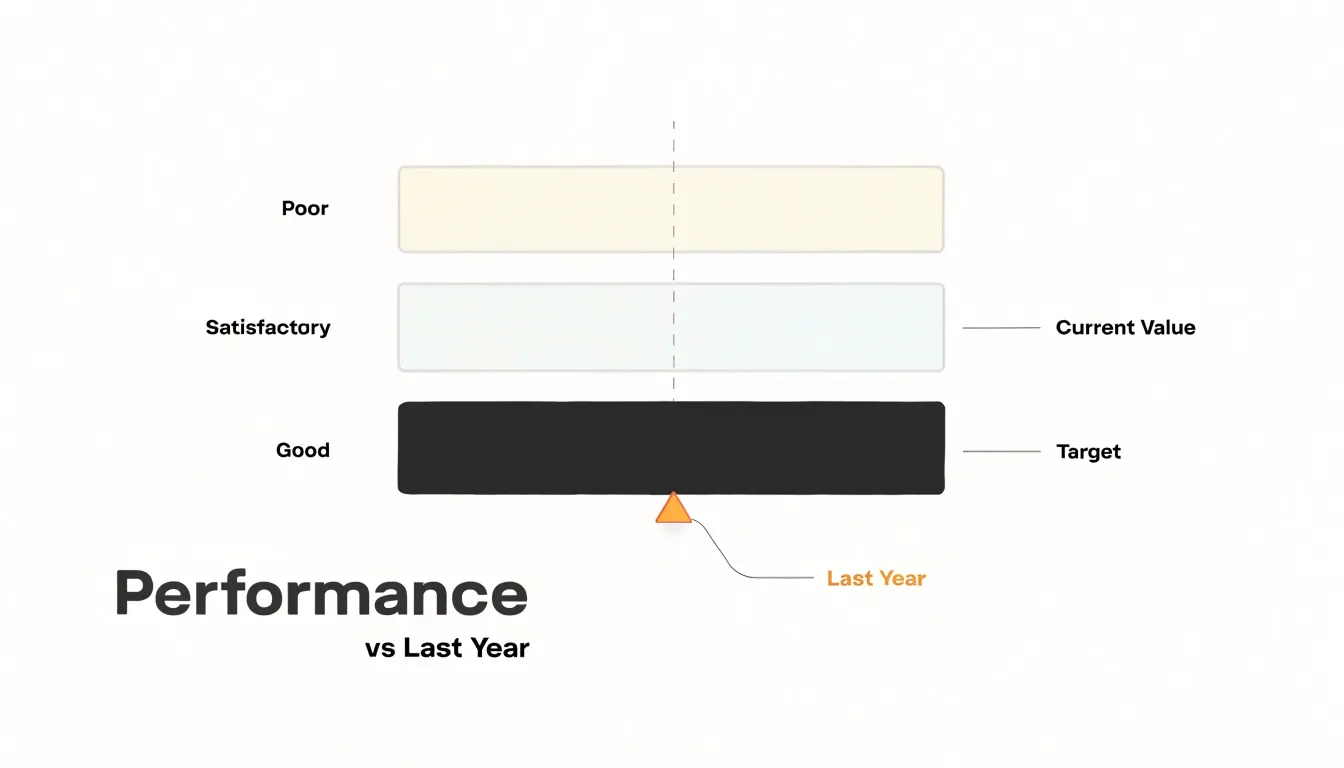
The bullet chart’s minimalist, clean design has no unnecessary decoration, ensuring the data remains the focus. By combining actual values, targets, and ranges in a single glance, bullet charts allow multiple metrics to be compared in a small space without the visual clutter of gauges.
Space Efficiency
Space efficiency is a decisive factor when arranging a dashboard, and the two chart types differ sharply in how much room they demand. A bullet chart is fundamentally linear, packing its bar, comparative marker, and qualitative bands into one long, thin rectangle that consumes only as much vertical height as a single row of text. Designers can therefore stack a dozen bullet charts in a column, align them with labels on the left, and still leave room for other dashboard elements. This linear profile makes bullet charts well suited to dense layouts, such as performance summaries or operational scorecards that track many metrics side by side.
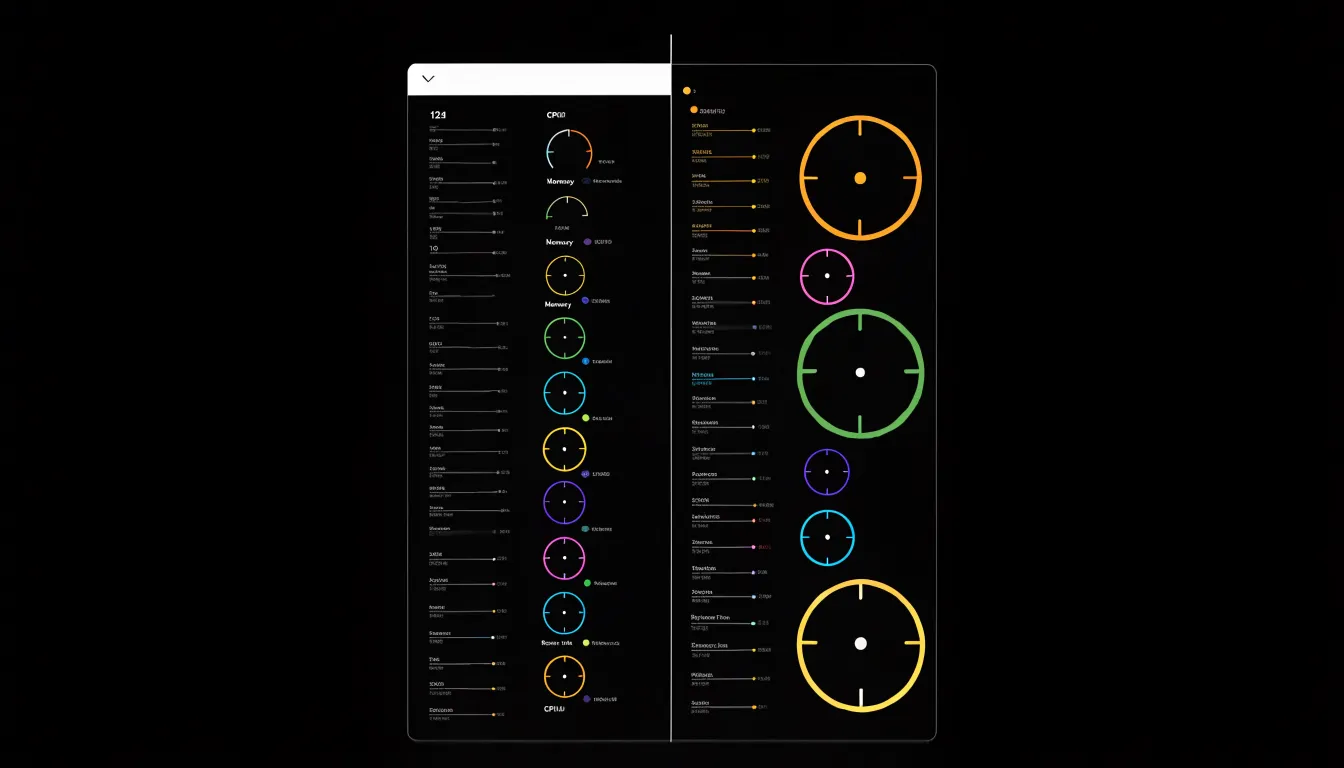
A radial gauge chart works in the opposite direction. Its circular arc occupies a roughly square footprint regardless of the quantity of data it displays. A gauge showing a single value can easily claim a 200 by 200 pixel block, and that space is largely padding: the arc’s curvature leaves empty corners and an unused center. When several gauges appear together, the required screen real estate multiplies quickly, pushing other widgets off the page or forcing the dashboard onto multiple views. On smaller displays, including tablets and laptops, radial gauges can crowd out supporting context like trend lines or tables.
In dense dashboards where many metrics must remain visible at once, bullet charts let designers maximize the number of indicators per square inch while keeping each one readable. Radial gauge charts impose a spatial premium that limits how many can comfortably share a single screen.
Reading Speed and Accuracy
Usability research offers useful guidance on how quickly people decode gauges versus bullet charts. With a gauge, the viewer must first locate the needle against a curved scale, then trace the arc to the nearest tick and mentally translate that position into a number. Each step adds a small cognitive cost that compounds when the scale is unfamiliar or the needle falls between labeled marks. Studies of dashboard comprehension consistently show that people take longer to extract an exact value from a round gauge than from a linear display, and their estimates tend to be rougher. Error rates rise as well, particularly when several gauges sit side by side and viewers must compare needle positions across different scales.
The bullet chart sidesteps most of this effort. A horizontal bar aligned with a labeled axis lets readers map length directly onto quantity, so the value can be read at a glance without an intermediate translation step. Because the bar shares a common baseline and axis orientation, comparisons across several metrics become almost automatic, and judging the relationship between the bar and its target marker requires little extra work. In practice, stakeholders scanning a report tend to arrive at the correct value faster with bullet charts and make fewer misreadings. While gauges retain appeal where a single value is monitored in isolation, the evidence favors the horizontal bullet format when the priority is speedy, accurate interpretation across a range of metrics.
Targets and Ranges
Performance zones give a chart its interpretive backbone, allowing a reader to judge whether a value represents success or trouble. Both bullet charts and gauge charts typically divide their measurement space into three qualitative bands: unsatisfactory, acceptable, and optimal. The most common convention maps these to red, yellow, and green—signaling poor, fair, and good performance—though brand palettes or muted tones can serve the same purpose.
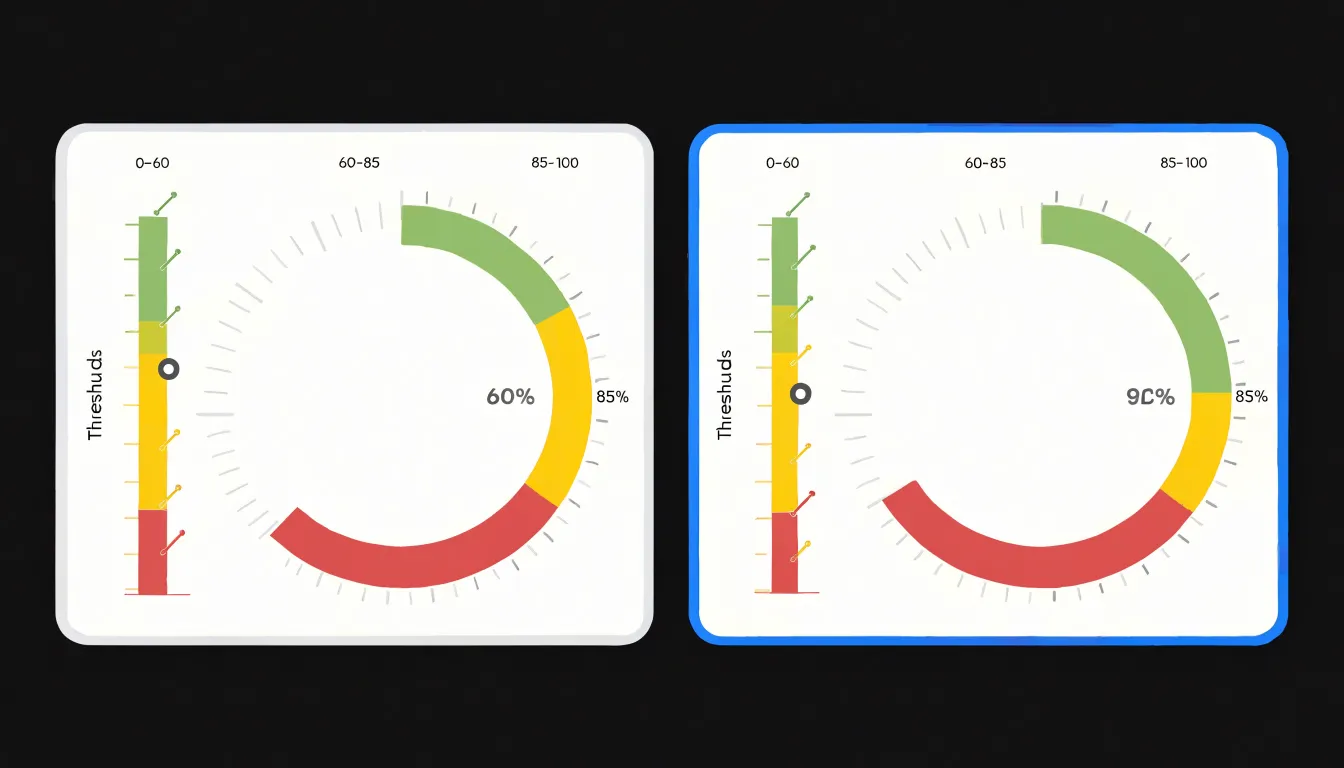
In a bullet chart, each horizontal background band occupies a defined span along the axis: an unsatisfactory zone might run from zero to 60 percent of target, a fair zone from 60 to 85 percent, and a good zone from 85 percent to the maximum. With the measure bar in front and a target marker ticking across the bands, viewers instantly see which zone the current value falls into and how far it sits from the target line. The linear layout makes the boundaries easy to label and compare across multiple charts sharing a common scale.
Gauge charts express the same three zones as arcs swept around a dial: the unsatisfactory arc at the low end, the fair arc mid-scale, and the good arc reaching toward the high end. Because gauges devote most of their space to the dial, the zones dominate the visual field, which suits single-metric displays where the qualitative threshold matters more than precise comparison.
In both formats, threshold values should come from agreed performance standards rather than arbitrary round numbers. Consistent color meaning across a dashboard helps readers move between charts without relearning the zones each time, and labeling the boundaries or providing a small legend removes ambiguity when ranges are not self-evident.
Design Best Practices
When designing gauge charts, a slim, unobtrusive needle with a pointed tip clearly indicates the value without dominating the visual space. Avoid ornate or thick needles that obscure the dial and create visual noise. Instead, opt for a simple, solid color that contrasts with the background without overpowering other elements, and keep the needle’s pivot small and centered.
Qualitative bands should use muted, low-saturation colors—such as soft pastels or light grays—to avoid competing with the needle, measure bar, and data labels. Reserve vibrant colors for critical thresholds or alerts, and use them sparingly.
Comparative markers, such as target indicators or previous value markers, should be crisp and distinct. Use thin lines or small triangles positioned precisely at the relevant value, and consider a contrasting color like black or white to ensure visibility against the bands. Limit the chart to one or two key comparisons to prevent visual clutter.
Mobile Screens
Adapting bullet charts and gauge charts to small mobile displays requires deliberate design choices. Responsive layouts should begin with fluid containers that allow each chart to occupy the available width rather than fixed pixel dimensions. For linear bullet bars, horizontal scaling works naturally: bars, comparative markers, and qualitative range bands stretch or compress proportionally while preserving their relative positions. On narrow screens, however, labels and tick marks can crowd together, so designers often reduce the number of tick labels, rotate them, or move them beneath the bar as a compact legend. Touch targets for interactive markers or tooltips must also remain large enough to tap accurately with a finger.
Radial dials present a more complex adaptation problem because their geometry depends on available height as well as width. On smartphones, a gauge that fills a wide desktop panel may become vertically constrained, shrinking the dial until its numeric readouts and needle become hard to read. Strategies include capping the dial size, repositioning the central value label into a large, legible typeface above or below the arc, and simplifying decorative tick marks into fewer, clearer intervals. Where space is truly limited, a full circle can be reduced to a semicircular arc that uses screen width more efficiently.
Legibility across both chart types depends on maintaining minimum font sizes, sufficient contrast, and consistent spacing between elements. Layouts should reflow gracefully between portrait and landscape orientations, and teams should test rendering across multiple viewport widths and device pixel ratios to catch overlapping annotations or clipped range bands.
Color Blind Accessibility
Color blindness affects a substantial portion of the population, with red-green deficiencies alone impacting roughly one in twelve men and one in two hundred women. For charts that communicate status through color-coded threshold zones, this demographic risks misreading performance data entirely. A gauge chart’s red-yellow-green traffic light convention collapses into indistinguishable shades for deuteranopic viewers, and bullet charts carry the same hazard when red and yellow bands appear nearly identical. The first defense is selecting accessible palettes: colorblind-safe combinations such as blue-orange, or the viridis family, preserve separation across common deficiency types. Tools like ColorBrewer provide pre-validated sets that avoid problematic pairings.
Threshold zones also need sufficient luminance difference to remain distinct when hue information is lost. WCAG guidance suggests a contrast ratio of at least 3:1 for graphical elements; applying this to adjacent band colors ensures that viewers perceiving the chart in grayscale can still locate boundaries. Checking designs with a grayscale rendering or a contrast analyzer catches zones that merge at low luminance.
Pattern-based techniques add a redundant channel that does not depend on color perception:
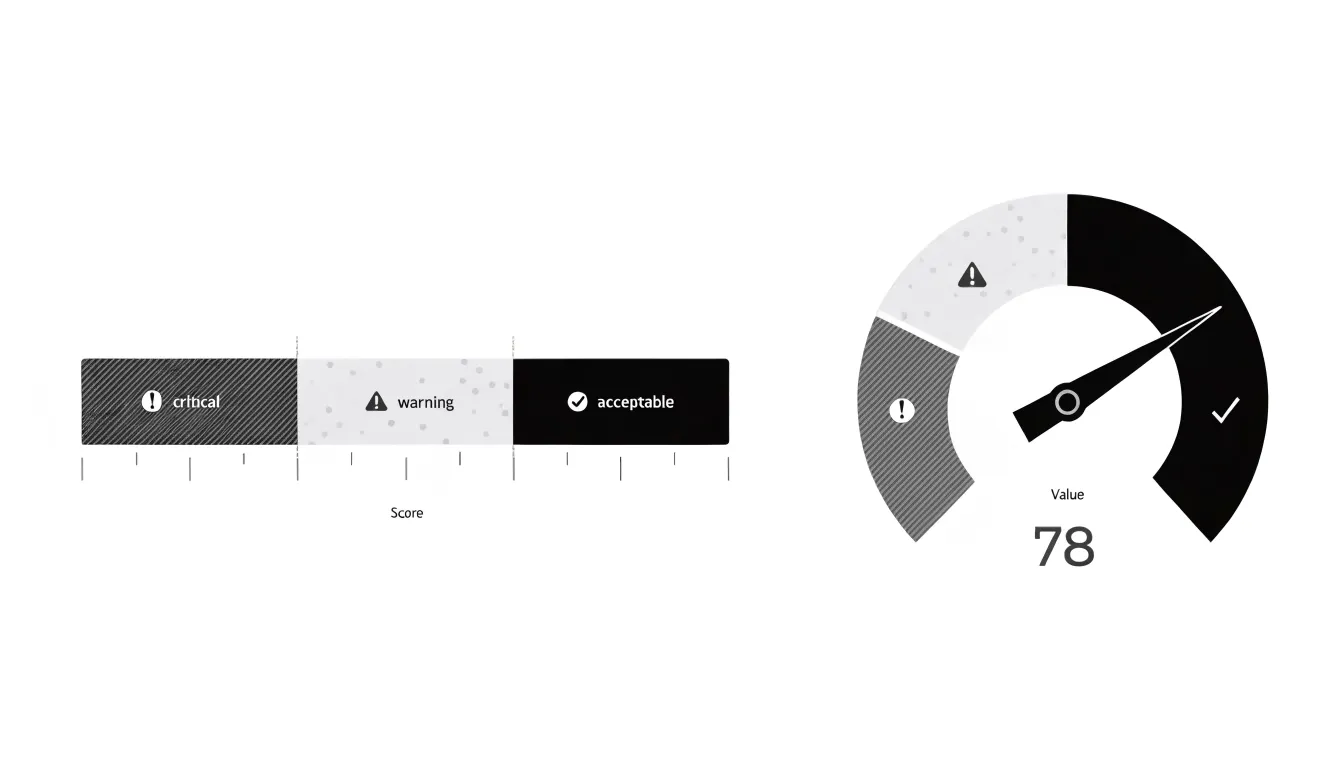
- Diagonal hatching for critical bands
- Stippling for warning zones
- Solid fills for acceptable ranges
Bullet charts accommodate these textures naturally through their rectangular bands, while gauge charts can apply patterns to arc segments. Labels or icons placed directly within threshold zones reinforce the encoding further, ensuring interpretation never hinges on a single visual attribute.
Sales Progress
Sales teams tracking progress toward monthly quotas and revenue projections need to see whether performance is ahead, on par, or behind target. In a bullet chart, the linear scale makes the distance between actual month-to-date sales and the quota marker immediately interpretable.
When tracking year-to-date revenue projections against benchmarks, bullet charts can display multiple measures on a single axis—such as showing year-to-date actuals as the primary bar, with markers for the year-to-date target and prior year’s performance. This allows for comparisons across time and against plan. Stacking several bullet charts vertically shows performance across products, regions, or sales reps in minimal space. Because the key sales questions are “how far to target?” and “how does this compare to benchmarks?”, the bullet chart’s aligned linear layout is typically superior to radial gauges, which make small differences and multi-chart comparisons hard to discern.
Server Uptime
Gauge charts are a natural fit for IT monitoring dashboards because operations teams can read them from across a room. For server uptime, an engineer glancing at a semicircular dial instantly sees where a system stands relative to its availability target: a needle resting in the green zone signals normal operation, while a needle drifting toward red draws the eye immediately.
This visual grammar works well across core IT metrics that have clear pass and fail boundaries:
- CPU load maps naturally onto a 0 to 100 percent scale, with colored bands showing when utilization approaches saturation.
- Network availability uses the needle’s position to reflect whether an interface or link is operating within acceptable parameters or edging into degraded territory.
In high-pressure monitoring contexts, a wall of gauges sharing a consistent visual language can be scanned quickly to triage which system needs attention first based on needle position and zone color. New team members and non-specialist stakeholders recognize a dial and its red zone without training, shortening the path from seeing a metric to understanding system health.
Customer Satisfaction
Customer satisfaction scores such as CSAT and Net Promoter Score (NPS) often inform executive strategic priorities and resource allocation. Presenting these metrics requires showing both the current score and the distance from a meaningful goal. A bullet chart allows executives to immediately see whether a current CSAT of 78 sits comfortably within the expected range or falls short of the 85 target set for the quarter. NPS benefits from the same treatment, positioning the score against both industry benchmarks and internal goals without requiring separate charts for each comparison.
Because bullet charts are compact, leadership can review CSAT, NPS, and other satisfaction indicators side by side in one coherent view rather than flipping between disparate visuals. Gauge charts, by contrast, use a large share of visual space to communicate a single value, which can feel dramatic but offers limited comparative context for executive decision-making.
Common Design Pitfalls
Several design missteps can distort data or distract the audience when building bullet and gauge charts:
- 3D effects: Depth and perspective distort the relationship between a value and its target, making a bar or needle appear larger or smaller than it actually is. Readers end up estimating quantities from shading rather than position.
- Non-zero baselines: When an axis starts at a value other than zero, differences between actual performance and the target are exaggerated, making a modest gap look dramatic and undermining honest comparison.
- Vibrant gradient bands: Rendering qualitative ranges in loud, multi-hue gradients draws the eye to the decorative background rather than the actual value marker and target line.
- Crowded data labels: Placing a label on every segment, tick, or range saturates the chart with text, forcing readers to scan instead of absorb. Prioritize a few essential labels, such as the current value and the target.
Dashboard Software
Building bullet and gauge charts follows a distinct workflow in each major business intelligence platform:
- Tableau: A bullet chart begins with a bar mark placed on a category dimension, with a reference line added for the target value and a distribution band or background shading for qualitative ranges. Because Tableau does not ship a native gauge mark type, builders usually construct one from a pie or donut chart using a calculated field that splits the measure into filled and remaining segments, then layer a text label and a needle using a dual-axis combination.
- Power BI: Users can download a dedicated bullet chart custom visual from the AppSource marketplace, which exposes settings for target values, qualitative bands, and comparative measures in the formatting pane. Gauge charts are a built-in visual; users simply set the minimum, maximum, and target values and adjust color thresholds in the format panel.
- Excel: Both charts rely on native combo and doughnut capabilities. A bullet chart is assembled as a stacked bar with a scatter or line series overlaid for the target marker, while a gauge is commonly built from a doughnut chart with two or three segments formatted to hide the unnecessary portions.
Across all three tools, store target and threshold values as separate measures rather than hard-coding them, keep axis ranges fixed so comparisons remain valid, and test each build against real data volumes to confirm that labels and markers remain legible at typical dashboard sizes.
Audience Fit
Executives and operational managers bring different mental models to a dashboard. A senior leader reviewing a dense scorecard during a weekly briefing often responds well to bullet charts, where aligned bars and target lines make performance gaps across many metrics immediately visible. Conversely, an operations supervisor monitoring real-time throughput on a wall monitor or during a stand-up meeting may prefer a gauge chart because its dial and needle mirror the physical instruments common in production environments.
Matching the chart to the audience starts with observation. Review which charts stakeholders reference most often, ask how they describe metrics in meetings, and note where confusion arises. When viewers consistently ask what a needle position means or where the target sits, that feedback points toward switching chart styles so decision-making stays focused on the business question rather than decoding the visual.
KPI Checklist and Final Choice
Before committing to either chart type, walk through a short checklist to evaluate what your dashboard needs to communicate:
- Data density: How many KPIs will share the same view, and how many supporting values accompany each one? If your dashboard presents a dozen metrics in a single view, bullet charts prevent the page from turning into a crowded wall of dials.
- Target complexity: Does each KPI carry a single threshold, a stretch goal, or multiple performance bands? A gauge suffices for simple, absolute targets, whereas a bullet chart handles layered or comparative references in a fraction of the space.
- User intent: Will viewers glance at the display to confirm status, or study it to compare performance across categories and time periods? Glanceable status checks tolerate a gauge’s single-value focus, while comparison and prioritization tasks favor the aligned scales of a bullet chart.
- Practical constraints: How much screen space is available, does the task require precise reading or a quick impression, and is the audience already fluent with either format?
Score each question against your specific context, and document the reasoning so the choice is easy to revisit as reporting needs evolve.
Frequently Asked Questions
What is the difference between a bullet chart and a gauge chart?
A gauge chart uses a speedometer-style dial with a needle to show one metric, while a bullet chart uses a horizontal bar with qualitative bands and target markers. Bullet charts are compact and linear, whereas gauge charts are radial and occupy a roughly square footprint.
Which chart is better for dashboards with many metrics?
Bullet charts are generally better for dense dashboards because they pack a bar, comparative marker, and qualitative bands into a long, thin rectangle, so a dozen can be stacked in a column. Radial gauges take up roughly square space and can crowd out other dashboard elements.
Are bullet charts easier to read accurately than gauge charts?
Usability research consistently shows people take longer to extract exact values from round gauges than from linear displays, and their estimates tend to be rougher, with error rates rising. Bullet charts let readers map length directly onto quantity, so they tend to be faster and more accurate for scanning and comparing metrics; gauges retain appeal for a single value monitored in isolation.
How should target ranges or performance zones be set?
Both chart types typically divide measurement space into three qualitative bands: unsatisfactory, acceptable, and optimal, often mapped to red, yellow, and green. Threshold values should come from agreed performance standards rather than arbitrary round numbers, and consistent color meaning helps readers move between charts.
Are gauge charts accessible for people with color blindness?
Red-green deficiencies alone impact roughly one in twelve men and one in two hundred women, and a gauge chart’s red-yellow-green convention can collapse into indistinguishable shades for deuteranopic viewers. The article recommends colorblind-safe palettes, at least 3:1 luminance contrast for graphical elements, and pattern-based techniques such as diagonal hatching, stippling, and solid fills to add a redundant channel.
How do bullet and gauge charts work on mobile screens?
Responsive layouts should use fluid containers, and linear bullet bars scale horizontally naturally, though labels and tick marks can crowd on narrow screens. Radial dials are more complex because their geometry depends on height as well as width, and on smartphones a gauge may shrink until its numeric readouts and needle become hard to read.
Tony Astor
Tony writes about data visualization and the tools people use to build charts and dashboards. More about Data Illustrator