Bullet Chart: A Compact Way to Show Progress Toward a Target
 By Tony Astor ·

Bullet Chart
A bullet chart is a compact data visualization created by Stephen Few that displays a single performance measure as a horizontal bar, a target marker as a vertical line, and qualitative ranges as shaded background bands. It replaces gauges and dials on dashboards, showing actual value, goal, and performance tiers in minimal space.
Table of Contents
Bullet Chart
The bullet chart, also known as the bullet graph, was created by data visualization expert Stephen Few in the mid-2000s as a compact replacement for the gauges and dials that once dominated performance dashboards. It gives analysts a way to show a single performance metric against meaningful reference points without wasting space. The chart borrows its name from its resemblance to a horizontal bullet, with a narrow central band carrying the data and richer context surrounding it.
At its core, a bullet chart displays one primary measure, often called the feature measure, as a dark horizontal bar whose length encodes the current value. A thin vertical line across the same row marks the target, and a small vertical tick can serve as a comparative marker for a prior period’s value or a benchmark. Behind the feature measure sit qualitative ranges, typically rendered as bands of varying intensity, such as light gray, medium gray, and dark gray, representing states like poor, satisfactory, and good. Labels and scales are kept minimal so the graphic fits into a small rectangular footprint, making it practical to stack many bullet charts in a scorecard, KPI summary, or table.
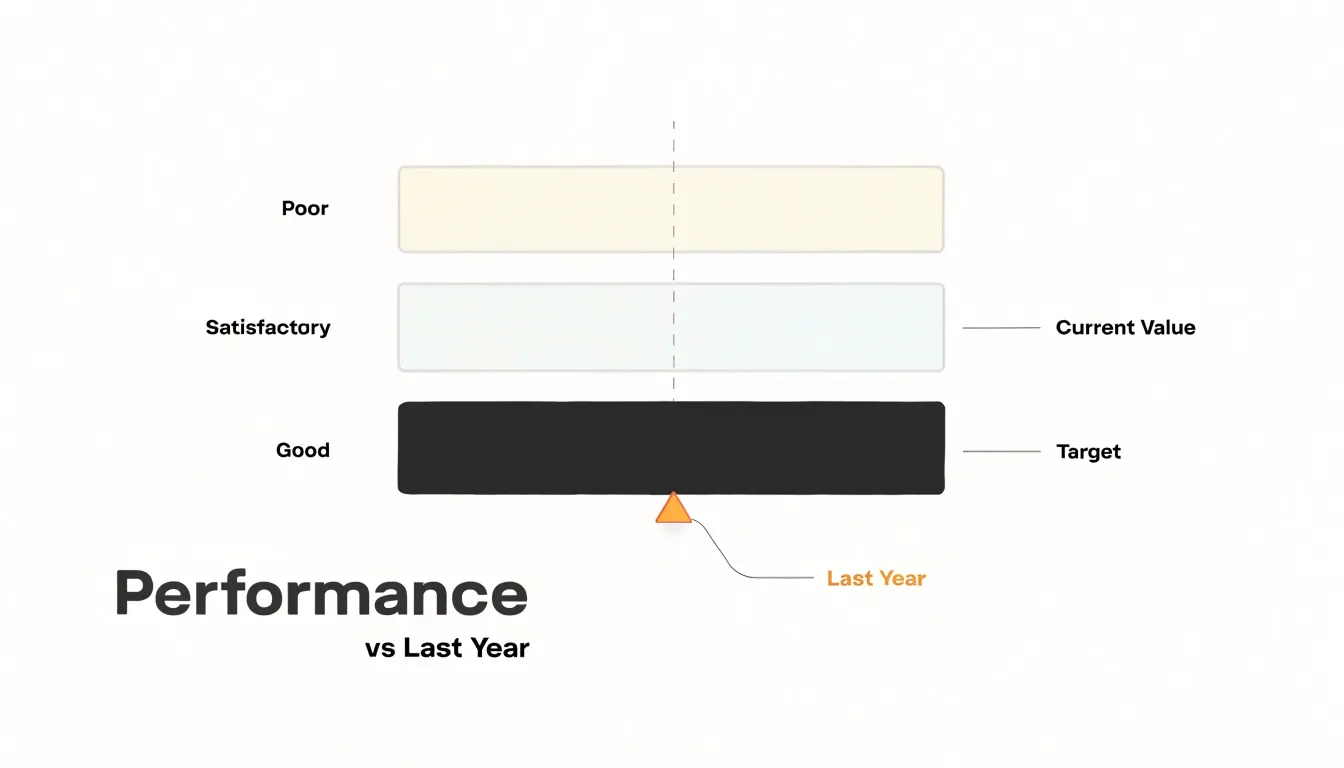
A useful way to read a bullet chart is to look first at the qualitative bands, then the target line, and finally the feature measure bar. That sequence shows what good performance looks like, what was attempted, and what was actually achieved.
Bullet Chart
A bullet chart is built from four interlocking elements. At its foundation sits the quantitative scale, a linear axis that defines the range of values and establishes a common reference so that the measure, target, and qualitative bands all read against the same units and increments. Clear tick marks and consistent intervals keep the scale legible.
The featured measure bar is the chart’s primary subject. Rendered as a solid, prominent bar running horizontally across the scale, it shows the actual value being tracked, such as current revenue, headcount, or production output. Because it occupies the chart’s visual center of gravity, it draws the eye first.
The target marker line adds a comparative reference point. Drawn as a short vertical tick or thin line crossing the measure bar, it indicates the goal, benchmark, or expected value for the same period.
Behind these foreground elements lie the shaded qualitative ranges, which segment the quantitative scale into performance tiers. Darker shading usually marks lower performance zones while lighter tones indicate stronger tiers, or the reverse depending on the palette chosen. These bands let a viewer classify the measure without consulting a separate legend or table.
Bullet Chart
The target marker is the feature that distinguishes the bullet chart from an ordinary progress bar. Positioned as a short, perpendicular line spanning the height of the bar and aligned precisely to the value scale, its distance from the bar’s leading edge translates directly into units of shortfall or surplus. When the filled bar extends past the marker, the viewer reads overachievement; when it stops short, the gap signals underperformance without numerical annotation. Designers often render the target in a contrasting dark tone so it never blends into the bar or background bands, and a well-positioned line will usually land inside one of the bands to show what the target itself represents.
Progress tracking adds a temporal dimension. As the actual bar grows across reporting periods, the distance between the bar tip and the marker shrinks or expands, turning the chart into a compact trend indicator. Keeping the scale fixed across updates preserves this comparability; rescaling around the current value destroys the visual narrative. Some implementations add a secondary marker for a prior period or forecast, letting readers see both the goal and the trajectory.
Bullet Chart
Bullet graphs and standard bar charts differ first in how they establish visual hierarchy. A conventional bar chart devotes most of its ink to the measure itself, so any reference values compete for attention as separate marks or overlays. The bullet graph reorganizes that hierarchy: the measure appears as a narrow solid bar, the target stands apart through contrast rather than size, and the qualitative ranges recede into a light background layer. Each element occupies a distinct visual level.
Screen real estate consumption follows from that structure. Traditional bar charts typically allocate generous space to axis labels, gridlines, and wide bars, which limits how many measures fit on a dashboard without scrolling or paging. Radial gauges consume comparable or greater space while adding curved geometry that is harder to scan across a row.
Contextual depth is the third distinction. Bar charts usually show values against an axis and perhaps a single target line, leaving benchmarks implicit, while the bullet graph embeds qualitative ranges directly behind the data. Radial gauges offer some context through colored arcs, yet the circular format forces the eye to trace an angle rather than compare linear positions.
Bullet Chart
Quarterly revenue is the anchor metric of most executive reviews, and a bullet chart pairs actual revenue against the plan figure while shaded bands communicate underperformance, on-plan, and stretch territory. Sales quotas follow the same logic at the team and individual level: a regional sales manager can display each rep’s attainment against assigned quota, with banding that flags which performers are dangerously below threshold and which are approaching accelerators.
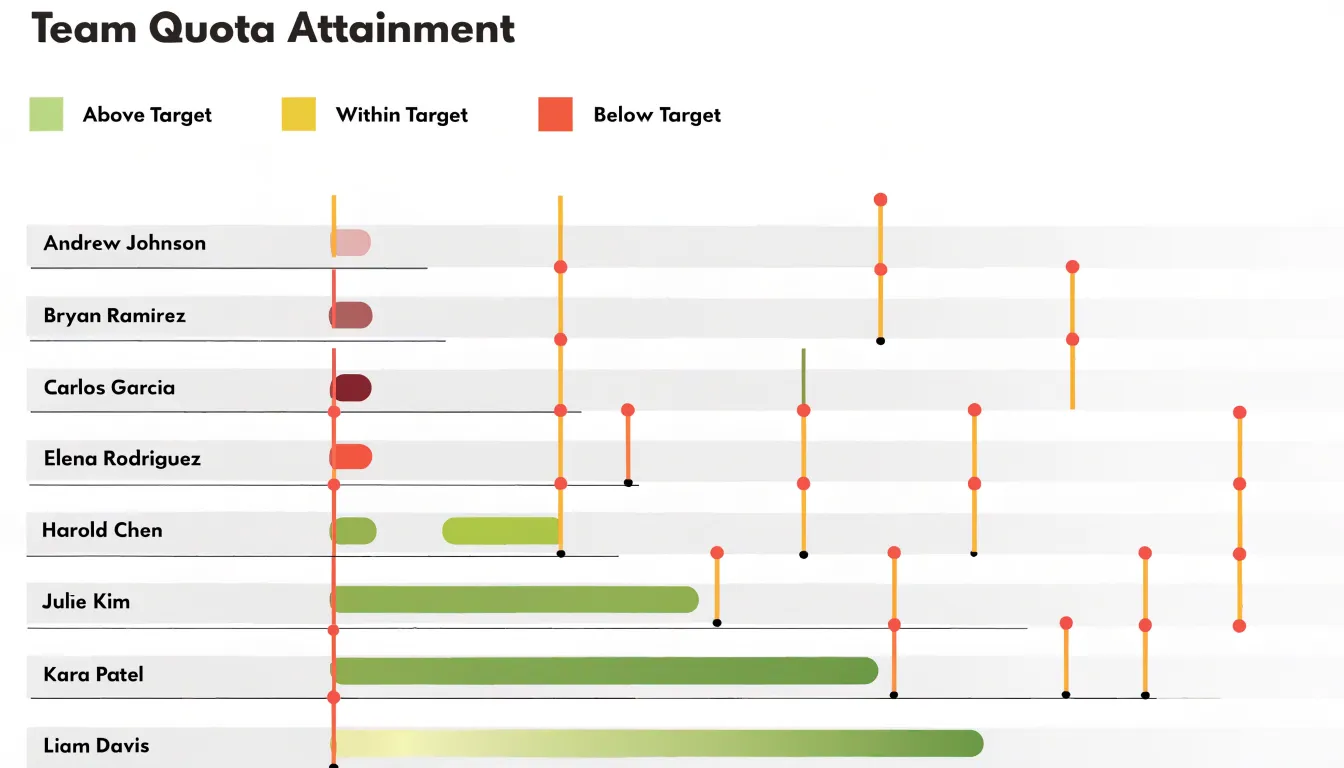
Customer acquisition cost (CAC) benefits from qualitative ranges because a healthy CAC differs by channel and segment. Placing the current blended CAC against a benchmark marker and coloring the bands from favorable to concerning helps leadership judge whether sales and marketing spend is producing efficient growth or drifting into expensive territory. Profit margin rounds out the picture, often displayed per product line or business unit, with the target margin marking the threshold that keeps the company financially healthy.
Four or five of these charts can sit in a single dashboard row, giving a complete view of revenue, quota attainment, acquisition efficiency, and profitability so follow-up discussion can focus on the metrics that need attention.
Bullet Chart
Bullet charts also work well for tracking personal goals and habits in spreadsheet tools or habit-tracking apps that support custom visualizations:
- Fitness targets: Display current weekly exercise minutes alongside a goal (e.g., 150 minutes) and qualitative ranges for poor, average, and good performance.
- Monthly budget savings: Show actual savings to date against a target, with ranges indicating spending levels.
- Reading habits: Track the number of books read this month against a goal of two books, with ranges showing minimal, moderate, and extensive reading.
- Daily step counts: Plot today’s steps relative to a 10,000-step goal, with ranges for sedentary, lightly active, and active days.
Regularly updating the chart provides a visual history of consistency and motivates you to stay within or surpass the desired range.
Bullet Chart
Choosing colors for a bullet chart begins with separating background context from foreground data. The performance background bands should use neutral, monochromatic shades drawn from a single hue and stepped gradually in lightness, such as light gray paired with medium gray, or a soft tint of blue moving into deeper tones. Keeping the bands low in saturation and close in value ensures they read as context rather than content. A common approach is to start with a pale shade for the lowest band and darken slightly with each successive range.
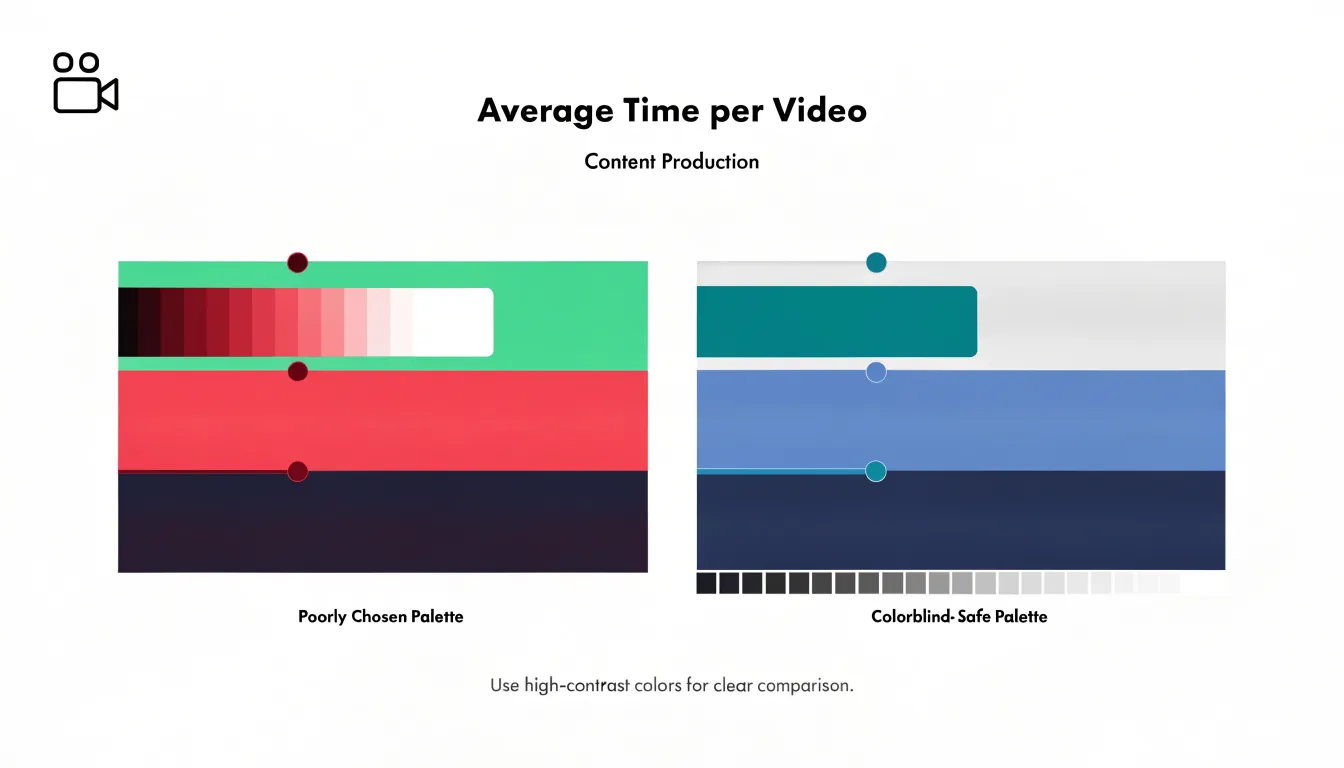
The main progress measure bar deserves the strongest visual weight in the composition. A bold, saturated color such as deep navy, rich teal, or vivid crimson creates an immediate focal point. The bar should use a single solid fill with enough darkness or intensity to stand out clearly against every band behind it. Before finalizing a palette, check the contrast between the bar and each background shade individually; the bar must remain legible whether it ends over the lightest or darkest band. Testing in grayscale is a useful final step, since a bar that still reads clearly in black and white will hold up for viewers with color vision deficiencies.
Bullet Chart
Horizontal bullet charts place the category label at the left and extend the measure, target marker, and qualitative ranges along the x-axis. This layout mirrors the way people read text and scan lists, making it well suited for KPI dashboards where each row represents a distinct metric such as revenue, churn, or customer satisfaction. A vertical stack of horizontal bars lets viewers compare values across many named measures without tilting their heads, and long category names fit naturally beside the bar without truncation or wrapping.
Vertical orientation rotates the same anatomy so the bar rises from a baseline, with the label beneath the axis. This arrangement suits side-by-side comparisons because narrow vertical bars can sit close together in a compact row, anchored by a shared baseline that makes relative heights immediately legible. Vertical layouts also adapt well to mobile displays, where screen width is limited and users can scroll down through a column of narrow charts. When selecting orientation, consider the number of measures, the length of their labels, the grouping you want to emphasize, and the target device.
Bullet Chart
Several common pitfalls can undermine a bullet chart’s clarity:
- Non-zero axis baselines: When the axis starts away from zero, small differences between the measured value and the target appear dramatic. A reader may conclude that a measure is far off target when the actual gap is modest, or that a value has surged when the change is trivial. Keeping the axis anchored at zero preserves honest proportions across a dashboard.
- Overcomplicated color palettes: Introducing many hues, gradients, or decorative fills obscures which element carries which meaning and forces repeated trips to a legend. Reserve a single accent color for the measure and neutral tones for the range bands.
- Overcrowding: Loading a single chart with too many data points, unrelated series, or secondary metrics dilutes its purpose. Limit each chart to one measure, its target, and a few meaningful range thresholds.
Bullet Chart
Preparing data for a bullet chart starts with organizing the raw table so that every visual series has its own explicit column: one for the actual value achieved (per product line, sales region, or salesperson), a second for the target goal, and additional columns for each qualitative threshold boundary. Keeping these elements separate at the table level, rather than embedding them in formulas or comments, makes the dataset readable and lets the charting tool map each column directly to a visual element.
Each threshold column should contain a single numeric boundary per row, ordered consistently from the lowest band to the highest. Column headers should be descriptive and stable, with the same row order maintained across all columns. Store numeric fields as numbers rather than text, document units in the header or a nearby note, and handle missing data explicitly by leaving cells blank or entering a defined placeholder to prevent misalignment. Separating raw data from presentation makes updating the chart a matter of refreshing values rather than rebuilding the structure.
Bullet Chart
Building a bullet chart in Excel begins with three columns: category label, target value, and actual performance value. Select these columns and insert a clustered bar chart, then switch the target series to a scatter or line type so the two elements can be styled independently. To create the qualitative range bands, add three columns for poor, satisfactory, and good thresholds, insert them as stacked bar series, and set their fills to progressively darker shades of gray. Move the target series to the secondary axis and adjust the gap width so the bars render at a reasonable thickness. Next, remove gridlines and borders, hide the secondary axis, and adjust the primary axis so category labels appear in the correct order. To format the target as a marker, add a single error bar to the target series, set it to a fixed value or plus direction only, and style the line consistently.
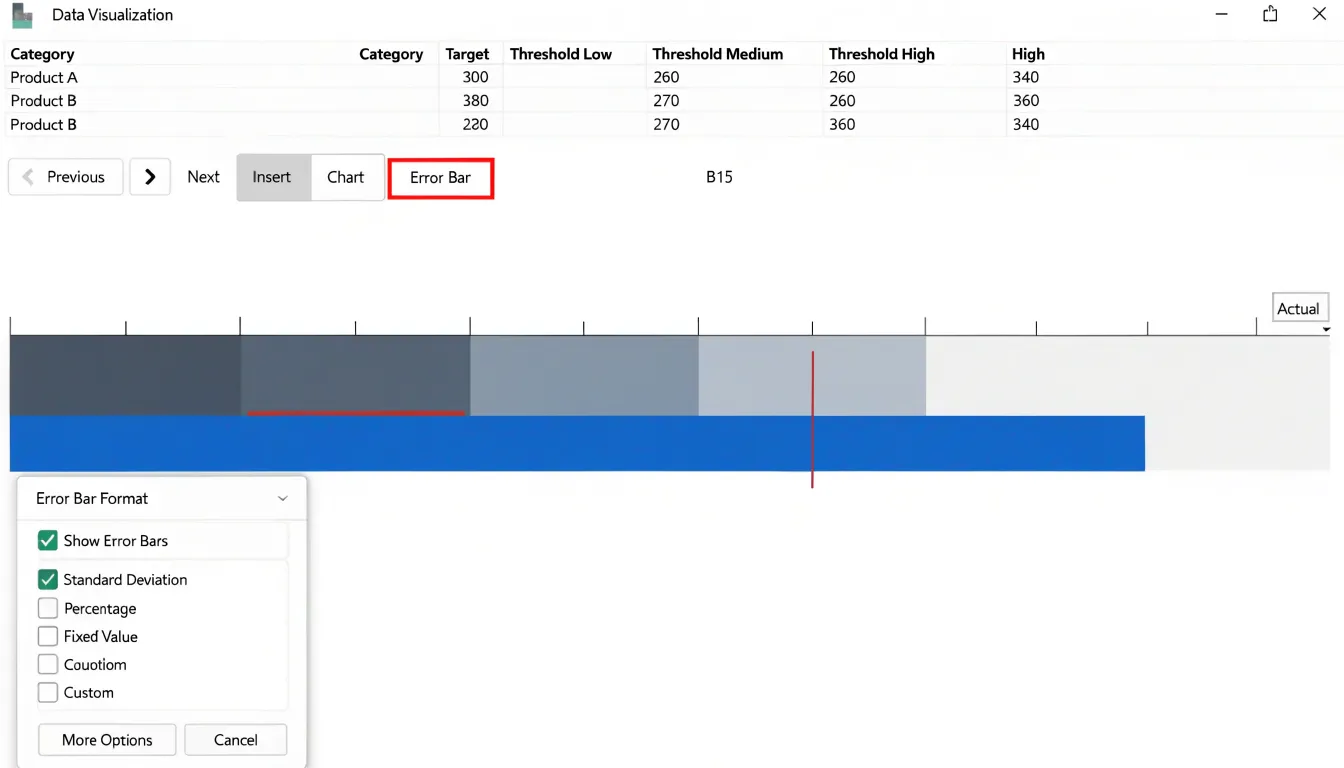
Google Sheets follows a similar path using native combo charts. Create a stacked bar chart from the range data, then use the Series settings in the chart editor to change the target series to a line or scatter type and assign it to a secondary axis under the Customize tab. Range bands are stacked the same way, and error bars can be approximated using a scatter series with custom point markers. Because formatting options in Sheets are more limited than Excel’s, you may need to resize the chart area and manually tune axis minimums and maximums. Save the chart as a template or duplicate the sheet to reuse the layout across reports.
Bullet Chart
When a bullet chart carries multiple reference points for each measure, a strict hierarchy of visual weight keeps them from competing for attention:
- Primary target: A thick, bold vertical line positioned at the expected value.
- Stretch goal: A thinner, lighter marker—often a small vertical tick or subtle dash—placed further along the axis to signal an aspirational level without being mistaken for the main target.
- Historical benchmark: A small diamond or short horizontal dash in a muted tone showing last year’s result or a rolling average, receding behind the primary target line.
Keep marker placement and styles consistent across all rows so readers do not have to re-interpret the legend for every measure, and include a short, fixed legend to remove ambiguity. When values sit very close together on the axis, nudge them apart slightly or differentiate them by shape so overlapping symbols stay readable.
Bullet Chart
Designing bullet charts for accessibility rests on three practices:
- Colorblind-safe palettes: Because red-green color blindness affects a substantial portion of the population, palettes that rely on distinguishing red from green for qualitative ranges will fail many viewers. Choose hues separated by lightness as well as hue—such as pale gray through mid blue to dark navy—or build bands from tints of a single hue ordered light to dark. Use colorblind simulators to preview palettes under deuteranopia, protanopia, and tritanopia.
- Pattern fills: Subtle diagonal hatching, dots, or crosshatch textures let viewers distinguish bands by texture rather than hue alone. Keep patterns low-contrast against their background so they do not compete with the data, and give the measure bar and target marker distinct treatments, such as a solid fill for the measure and a thick outline for the target.
- Text contrast: Labels for the measure, target, and range thresholds should meet WCAG contrast ratios of at least 4.5:1 against their backgrounds. Threshold labels placed directly on colored bands often fall below this standard; move them to a neutral margin or add a light halo behind the text. Set axis tick labels in a readable size with generous spacing.
Bullet Chart
In software development and IT, bullet charts are used to track sprint velocity, budget burn rates, and milestone completion:
- Sprint velocity: A mid-sized SaaS company plotted actual velocity each sprint against a target range and a stretch goal against qualitative bands. Over several sprints, the chart revealed a consistent velocity shortfall during holiday periods, allowing the team to adjust planning.
- Budget burn rates: A consulting firm tracked actual project spend against budgeted spend (target), a budget ceiling (maximum), and forecasted spend at completion (comparative marker). When one project’s actual spend consistently exceeded the target while remaining below the ceiling, the chart prompted a review that uncovered inefficient resource allocation before the ceiling was breached.
- Milestone completion: A large enterprise IT department tracked monthly milestone completion rates using the actual rate, a 95% target rate, and the previous month’s rate as a comparative marker, with qualitative bands set to red (below 80%), yellow (80–94%), and green (95% and above). When a project stayed in the yellow band for two consecutive months, leadership triggered a root-cause analysis that resolved a dependency issue before it affected the final deadline.
Dashboard
On a dashboard that must report on a dozen or more metrics at once, spatial efficiency compounds quickly. Twelve dial gauges can overwhelm a single screen, whereas twelve bullet rows fit comfortably into a single column that an executive can scan in one pass. Pie charts, meanwhile, dedicate most of their area to proportions that often matter less than absolute values and targets, and they are difficult to compare across multiple metrics.
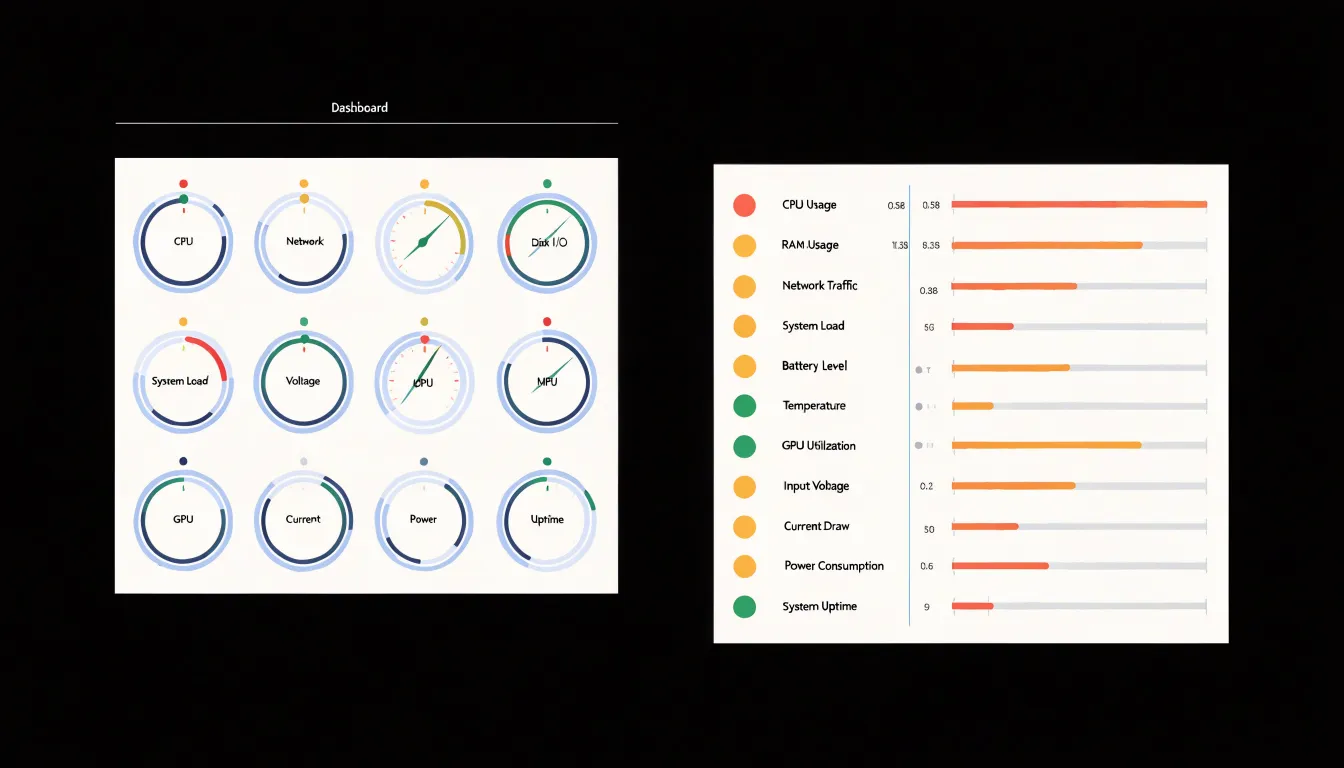
Aligning a row of bullet charts along a shared visual axis establishes a consistent rhythm: label on the left, performance bar in the middle, and target tick and range bands providing context. Viewers can move their eyes naturally down the column, spot short bars relative to their targets, and keep both headline metrics and secondary indicators in a single view.
Frequently Asked Questions
What is a bullet chart?
A bullet chart, also called a bullet graph, is a compact chart created by Stephen Few in the mid-2000s to replace gauges and dials on performance dashboards. It shows a single performance metric against reference points such as a target and qualitative ranges.
How do you read a bullet chart?
Look first at the qualitative bands, then the target line, and finally the feature measure bar. This sequence shows what good performance looks like, what was attempted, and what was actually achieved.
What does the target marker mean in a bullet chart?
The target marker is a short perpendicular line crossing the measure bar that indicates the goal, benchmark, or expected value for the period. If the filled bar extends past the marker, it reads as overachievement; if it stops short, the gap signals underperformance.
How is a bullet chart different from a standard bar chart?
A bullet chart differs in visual hierarchy, screen space use, and contextual depth. It uses a narrow solid bar for the measure, a contrasting target marker, and qualitative ranges embedded behind the data rather than leaving benchmarks implicit.
How do I make a bullet chart in Excel?
Start with columns for category label, target value, and actual performance value, then insert a clustered bar chart and switch the target series to a scatter or line type. Add threshold columns as stacked bar series for qualitative bands, move the target series to the secondary axis, and format the target marker, such as by adding an error bar.
What common mistakes should I avoid when designing a bullet chart?
Avoid non-zero axis baselines, overcomplicated color palettes, and overcrowding. Keep the axis anchored at zero, use a single accent color for the measure with neutral tones for range bands, and limit each chart to one measure, its target, and a few meaningful range thresholds.
Tony Astor
Tony writes about data visualization and the tools people use to build charts and dashboards. More about Data Illustrator