Best Infographic Tools Compared
 By Tony Astor ·
Best Infographic Tools Compared
The best infographic tool depends on the user’s needs: Canva suits beginners and teams wanting fast drag-and-drop design, Piktochart and Visme fit data-driven corporate visuals, Infogram excels at interactive live-data charts, and Venngage, Adobe Express, Easel.ly, DesignCap, Snappa, and Vizzlo serve specialized branding, social, budget, or presentation workflows.
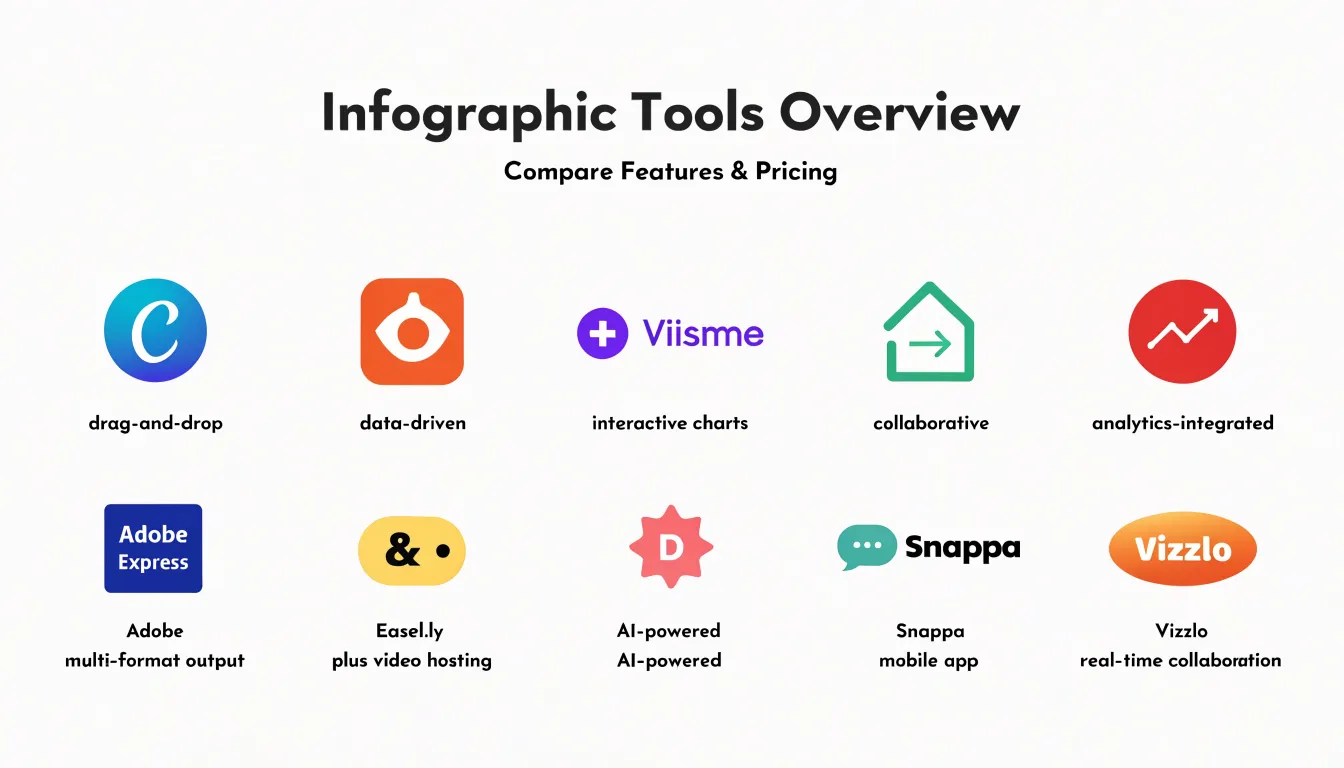
Table of Contents
Canva
Canva is a go-to solution for individuals and teams who need to create infographics quickly without formal design training. Its drag-and-drop interface eliminates the steep learning curve of professional design software. Users select elements from a sidebar, place them on the canvas, and adjust size, color, and position with intuitive controls, allowing beginners to produce polished graphics in minutes.
Canva also offers thousands of customizable infographic templates organized by category, topic, style, and occasion. Starting from a professionally designed base and adapting it to specific content and branding saves hours of work while maintaining a cohesive structure.
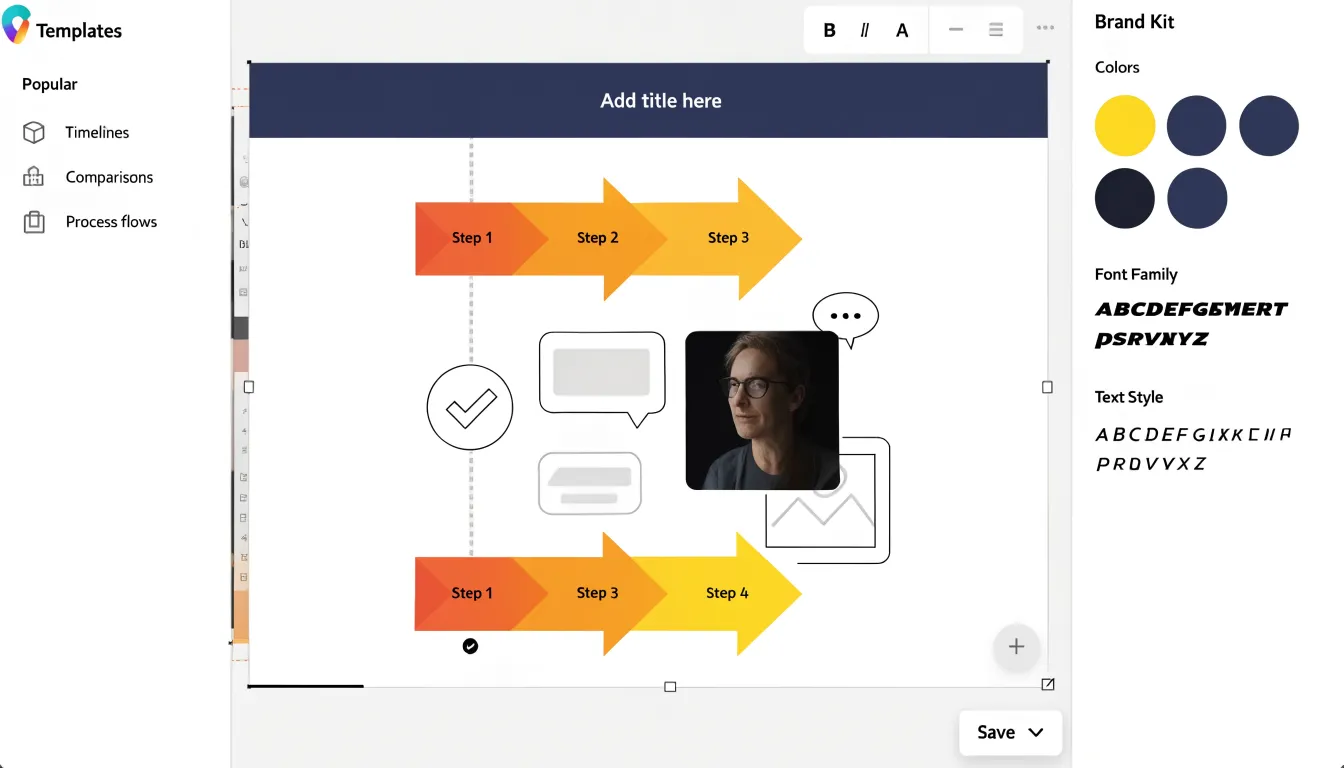
Real-time collaboration features make Canva well-suited for team projects:
- Simultaneous editing: Multiple users can work on the same design at once, with changes appearing instantly.
- Feedback tools: Comments and annotations support seamless iteration without back-and-forth file sharing or version control issues.
- Brand management: Shared folders and brand kits help maintain visual consistency across team members.
Piktochart
Piktochart focuses on transforming raw data into presentation-ready corporate visuals for marketers, analysts, and educators. Users can import data from spreadsheets or enter figures manually to generate bar graphs, pie charts, line graphs, and other chart types with customizable colors, fonts, and labels.
The template library includes corporate-ready assets—icons, photos, and illustrations—alongside hundreds of layouts tailored to annual reports, marketing summaries, and project updates. Users can build from scratch or rearrange template elements in the drag-and-drop editor, and teams can comment and edit in real time. Piktochart exports high-resolution PDF, PNG, and JPEG files for print or digital distribution.
Visme
Visme combines a drag-and-drop design platform with the analytical depth of a data visualization suite, giving business users advanced options without specialized software or coding. Beyond basic bar and pie graphs, users can build stacked area charts, radar diagrams, waterfall charts, and hierarchical treemaps via a table interface. Labels, colors, and axes remain fully editable for quick iteration on financial summaries, market comparisons, and performance dashboards.
Visme stands out for its dynamic widgets, interactive elements, and live data links:
- Sequential animations: Reveal data points step by step to guide an audience through a narrative.
- Interactive details: Hover effects, clickable legends, and embedded tooltips let viewers explore web-based infographics at their own pace.
- Live data connections: Link charts to external sources so teams can update figures without rebuilding the visual.
Venngage
Venngage organizes its template library around specific business use cases for marketing teams and HR departments:
- Technical reports: Layouts structured for data-heavy findings with clear charts, callouts, and hierarchies.
- HR and onboarding: Guides covering company policies, org charts, and first-week schedules.
- Marketing campaigns: Templates for product launches, social media announcements, and promotional timelines.
A core feature is brand kit enforcement. Organizations upload logos, color palettes, and fonts once, and designers can lock these elements so non-designers stay within approved guidelines, preventing off-brand colors or stretched logos. The drag-and-drop editor includes icons, illustrations, chart tools, and multi-stakeholder commenting, with exports to PDF, PNG, and interactive web pages.
Infogram
Infogram focuses on interactive, data-driven visuals rather than static templates. Its charting engine connects directly to spreadsheets, Google Sheets, or API feeds so published graphics update automatically as underlying numbers change. This real-time streaming suits publishers tracking live election results, market movements, or sports statistics.
Infogram also tracks audience engagement. Its analytics dashboard records view counts, average time spent, and interactions with hover tooltips, clickable legends, and drill-down chart views, helping editorial teams see which stories resonate. Additionally, users can embed video, audio clips, maps, and third-party widgets alongside charts and text in responsive layouts that adapt to desktop and mobile screens, making it well-suited for long-form data journalism.
Adobe Express
Adobe Express serves as a fast lane for social graphics and straightforward data visuals, anchored by deep integration with Creative Cloud libraries. Teams that maintain brand assets in Photoshop or Illustrator can pull colors, fonts, logos, and templates directly into Express, letting non-designers produce on-brand content without full Creative Cloud expertise.
For social media managers publishing daily across channels, automatic asset resizing reformats a single design for multiple platforms—such as Square for Instagram, Stories for vertical placements, and Landscape for Twitter or LinkedIn—without manual rebuilding. Its charting tools generate simple bar, line, or pie charts styled with Creative Cloud brand colors for social posts, basic reports, or presentation slides.
Easel.ly
Easel.ly offers a low-cost entry point for educators, students, and small nonprofits working on modest budgets. Its template-driven canvas keeps the learning curve gentle so users can focus on organizing content rather than wrestling with complex layout controls.
Teachers can create visual lesson summaries, students can assemble research into poster-style reports, and nonprofit staff can produce annual summaries, program overviews, or awareness handouts without a design department. Pre-built layouts help beginners avoid inconsistent spacing or cluttered text while adjusting charts, icons, and text blocks. While its feature set is narrower than professional-grade software, its affordability makes it practical for equipping classrooms and small community teams.
DesignCap
DesignCap is a browser-based platform built around predefined layout modules—grids, columns, timelines, comparison frames, and chart blocks—that users drop onto the canvas and rearrange with clicks. Running entirely in the cloud with no installation required, this predetermined structure prevents blank-page paralysis for non-designers.
Its categorized asset library includes icons, illustrations, shapes, and common chart formats (bar, pie, line, and progress visuals) generated via a simple data table. Text controls focus on basic font, size, and alignment settings rather than deep typography, while alignment guides and snapping keep layouts tidy. Finished designs can be downloaded as images or PDFs or shared via links and social channels.
Snappa
Snappa is built for speed, helping social media managers produce social-first infographics on a daily schedule. Instead of guessing at pixel sizes or manually adapting layouts to multiple aspect ratios, users start from preset canvas dimensions tied to specific social networks, preventing cropped elements or misplaced text across channels.
To speed up production further, Snappa integrates a library of royalty-free stock photos and graphics directly inside the editor. Social managers juggling multiple accounts can source licensed imagery, pair it with data points, and publish without leaving the workspace or managing separate licenses.
Vizzlo
Vizzlo targets corporate presentation workflows and executive decks. Its automated chart layout engine positions labels, sizes elements, and balances visual weight, recalculating the arrangement automatically whenever a user drops in a new dataset or switches chart types.
Organizations can define approved color palettes, typography, and branding rules that Vizzlo enforces across every diagram. A financial analyst building a quarterly revenue breakdown and a marketing manager assembling a timeline will produce visuals that look like they came from the same design team. Preconfigured business templates—including waterfall charts, Gantt timelines, and comparison matrices—render with restrained spacing and hierarchy, reducing review cycles and last-minute formatting fixes before leadership reviews.
Pricing
Infographic tools generally use freemium pricing, and comparing total cost of ownership—including add-ons for storage or advanced features—helps teams avoid hidden expenses. Key differentiators between free and paid plans include:
- Feature gates: Free tiers often restrict access to premium templates, advanced icons, and specialized chart types.
- Export restrictions: Free plans typically limit users to low-resolution images or add watermarks, while paid plans unlock high-resolution PDF, PNG, and SVG files.
- Seat costs: Free plans usually allow only one user. Paid plans either charge per user—which gets expensive as teams grow—or offer flat-rate pricing with unlimited seats.
A small team with basic needs might find a free tier sufficient if export limits are acceptable, whereas larger teams needing brand consistency, collaboration, and high-volume print or web exports will require a paid subscription.
Templates and customization
Choosing an infographic tool involves balancing the speed of pre-made layouts against the control required for unique branding. Pre-made templates for timelines, comparisons, or process flows help teams on tight deadlines maintain baseline visual consistency without starting from a blank canvas.
Deeper customization, however, relies on specific branding controls:
- Custom font uploads to align typography with brand guidelines.
- Color palette locking to apply brand colors automatically and prevent accidental deviations.
- White-labeling so agencies and businesses can replace the tool’s branding with their own for a seamless client experience.
Extensive customization options can steepen the learning curve and slow production, while rigid templates sacrifice brand identity for speed. The most versatile tools combine customizable templates with locked palettes and font uploads to support both rapid output and strict branding.
Data integration
Moving from hand-drafted infographics to dedicated tools starts with data integration:
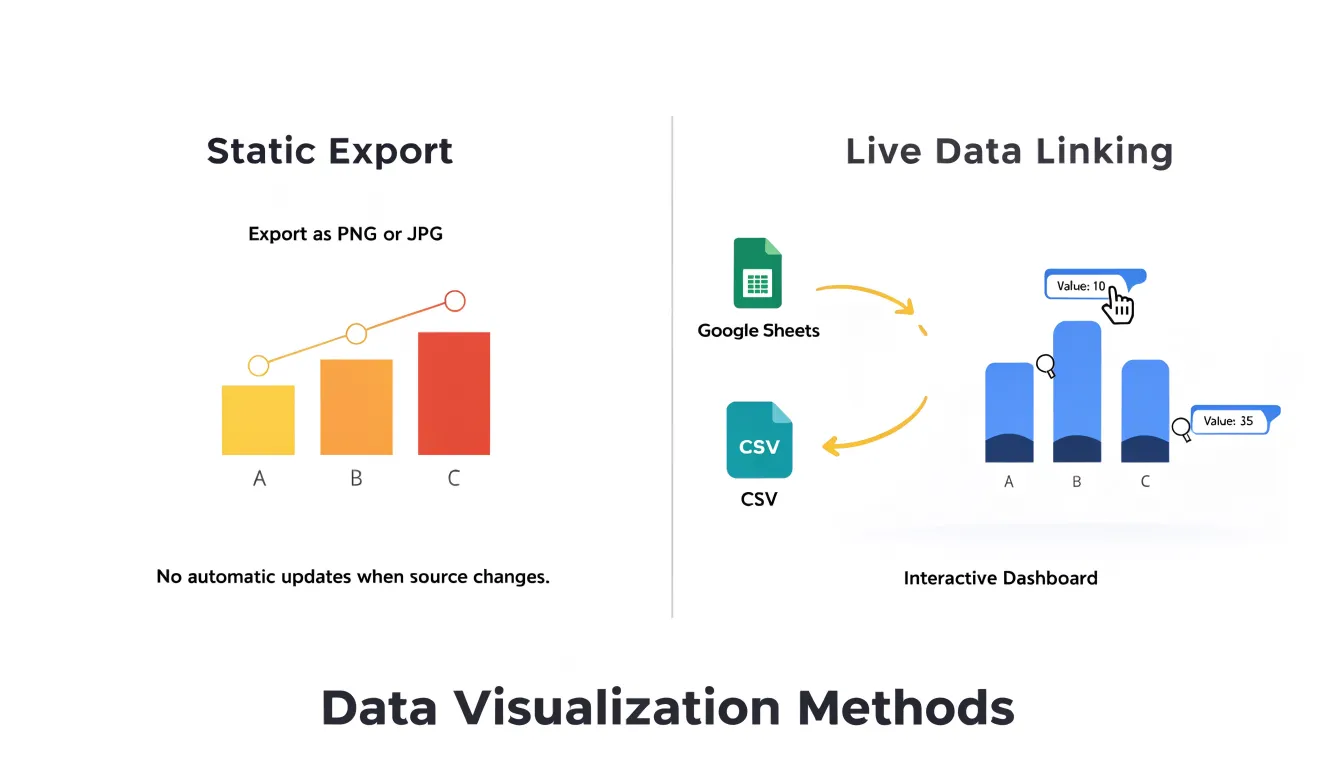
- CSV uploads: Most platforms accept comma-separated value files and map columns to canvas elements like bar heights, label text, or icon counts. Clean CSVs with a header row and consistent number formatting import smoothly, whereas mixed formats or stray characters can break the mapping step. Many tools provide a mapping preview and let you save the configuration as a reusable template for future uploads.
- Google Sheets: By pasting a share link or authenticating a Google account, the infographic pulls values directly from the spreadsheet. Edits to cells refresh the chart on the next load or at scheduled polling intervals, keeping reports current without re-uploading files.
- Real-time and API feeds: Advanced platforms push changes in near real time—redrawing lines, growing bars, and rolling number counters as underlying data moves—and can connect to published Google Sheets via API or cloud storage folders that watch for new files. Teams often pair this with conditional styling so metrics crossing a threshold change color automatically.
When evaluating tools, test the full loop—import, map, edit the source, and refresh—to see how much manual rework the software removes from recurring reporting cycles.
Export formats
The export formats a tool supports determine how the final design performs in print and online.
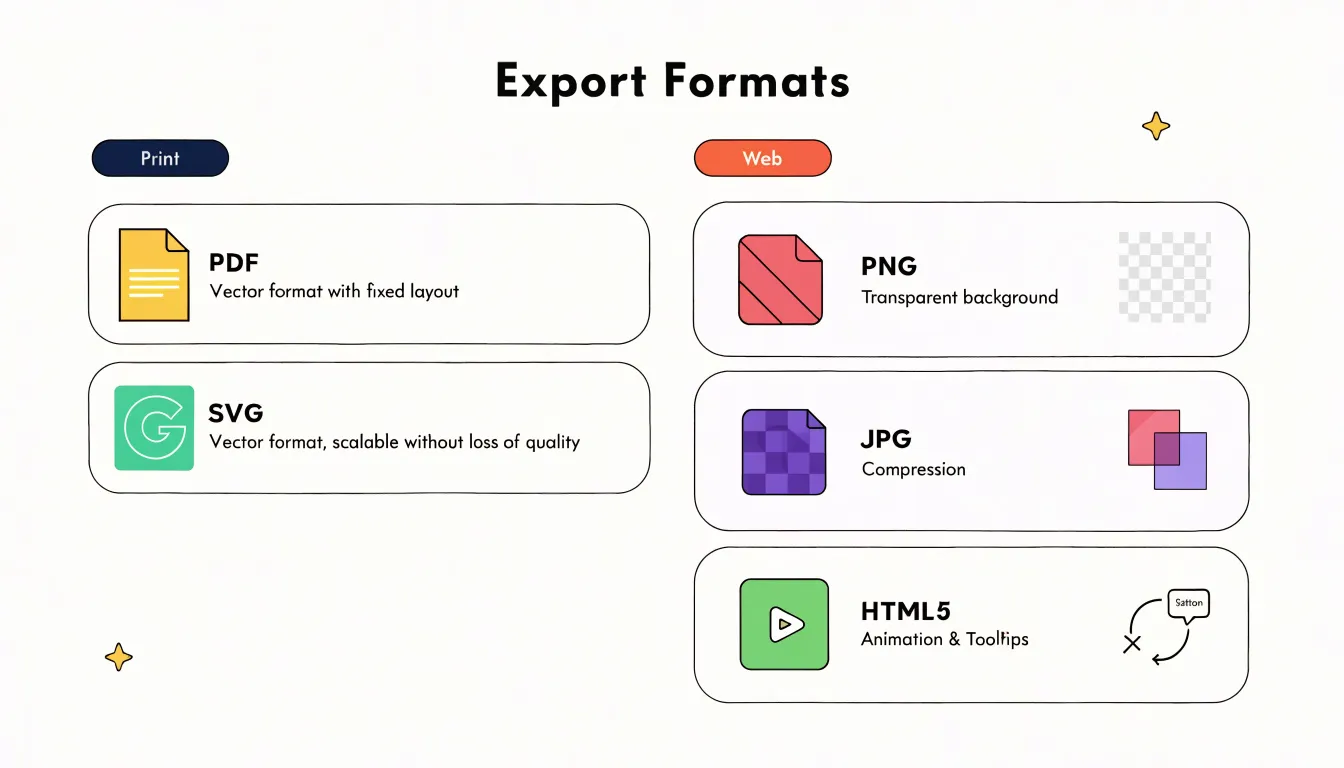
Print and scalable formats (Vector): Vector files store mathematical paths rather than pixels, scaling to any size without losing clarity on large-format printers.
- PDF: Preserves layout, fonts, and colors for sharing print-ready posters, flyers, or reports with professional printers.
- SVG: A web-friendly vector format that can be embedded in websites or edited in vector software, bridging print and digital use.
Digital and web formats:
- PNG: Supports transparency and lossless compression, keeping text and sharp edges crisp on screens.
- JPG: Uses lossy compression to shrink file sizes for faster loading on websites and social media, though it may introduce slight artifacts around text and fine details.
- HTML5: Exports interactive, responsive graphics that preserve animations, tooltips, and clickable elements directly in a browser across devices.
Final recommendations
To shortlist the right infographic tool, weigh four factors together:
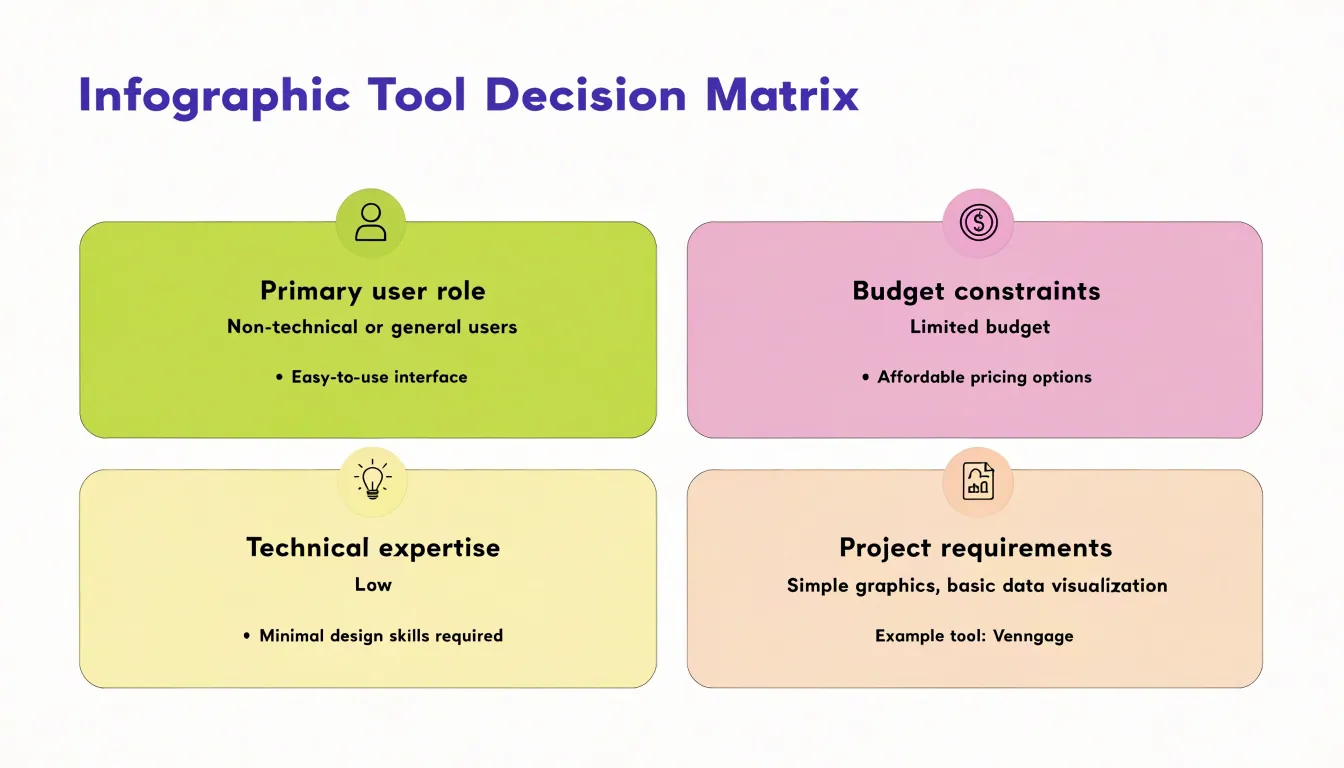
- Primary user role: A solo marketer creating social visuals has different priorities than a data journalist, a small nonprofit, or an enterprise design department. Template-driven tools suit generalists, while granular chart controls serve analysts and designers needing precision.
- Technical expertise: Match the software to your team’s existing skills. Tools that assume familiarity with layering and vector editing can go unused if they feel intimidating compared to guided, preset layouts.
- Budget constraints: Account for how watermarks, export limits, and restricted libraries on free tiers affect final quality, and calculate paid per-seat costs for your actual number of users rather than comparing headline prices.
- Project requirements: Determine whether your workflow demands interactive elements, animation, print-ready resolution, multi-asset brand consistency, or live data integrations. A tool built for one-off static graphics may struggle with recurring branded campaigns, and vice versa.
Frequently Asked Questions
What is a good infographic tool for beginners without design training?
Canva is described as a go-to solution for creating infographics quickly without formal design training because its drag-and-drop interface removes the steep learning curve. DesignCap uses predefined layout modules and runs in the cloud, while Easel.ly keeps the learning curve gentle with a template-driven canvas.
Can teams collaborate on infographics in real time?
Canva allows simultaneous editing plus comments and annotations, and Piktochart teams can comment and edit in real time. Venngage includes multi-stakeholder commenting.
Which infographic tools can update charts automatically from live data?
Infogram connects directly to spreadsheets, Google Sheets, or API feeds so published graphics update automatically as underlying numbers change. Visme offers live data connections that link charts to external sources so teams can update figures without rebuilding the visual.
How do I import data from a CSV or Google Sheet into an infographic tool?
Most platforms accept CSV files and map columns to canvas elements like bar heights, label text, or icon counts; clean CSVs with a header row and consistent number formatting import smoothly. For Google Sheets, users paste a share link or authenticate a Google account so edits refresh the chart on the next load or at scheduled polling intervals.
What export formats should I look for in an infographic tool?
For print and scalable use, vector formats include PDF, which preserves layout, fonts, and colors for print-ready files, and SVG, a web-friendly vector format that can be edited in vector software. Digital formats include PNG for transparency and lossless compression, JPG for smaller file sizes, and HTML5 for interactive, responsive graphics.
How should I compare free and paid infographic tool plans?
Compare feature gates, export restrictions, and seat costs, and account for add-ons for storage or advanced features to avoid hidden expenses. Free tiers often restrict premium templates, advanced icons, and specialized chart types, and may limit exports to low-resolution images or add watermarks, while paid plans unlock high-resolution PDF, PNG, and SVG files.
Tony Astor
Tony writes about data visualization and the tools people use to build charts and dashboards. More about Data Illustrator